
Tags
Birth/Death Model of Business Formation, Bureau of Labor Statistics, Claudia Sahm, Donald Trump, Erika McEntarfer, Establishment Survey, Household Survey, John Podhoretz, Mish Shedlock, Nonfarm Payroll Employment, Quarterly Census of Employment and Wages, Seasonal Adjustments, Veronique de Rugy
The dismissal of the Bureau of Labor Statistics (BLS) commissioner Erika McEntarfer by President Trump was regrettable and a dumb move besides. It was undeserved, and its timing made Trump look like the authoritarian buffoon of his enemies’ worst nightmares.
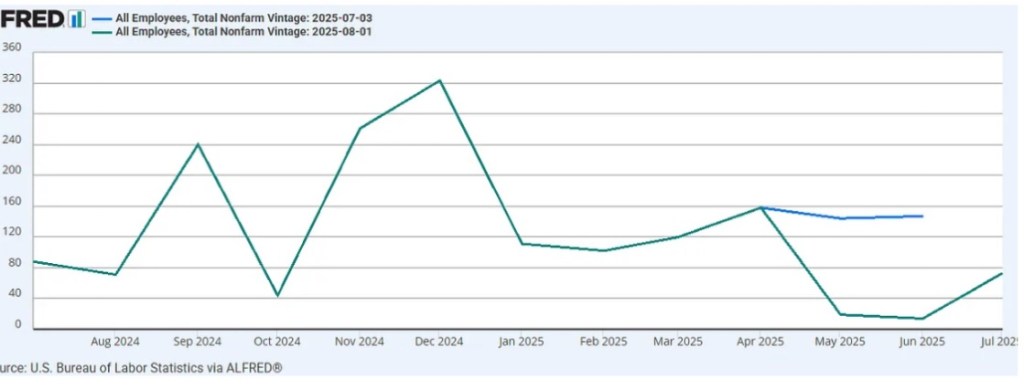
Trump believed the weak employment report for July made him “look bad”. He was particularly enraged by the downward revisions in nonfarm payrolls for the months of May and June (see chart above). Of course, he would not have liked the estimates to begin with, had they been in line the ultimate revisions — he just doesn’t like “bad” numbers on his watch. Trump stated his conviction that the weak report was “politically motivated”, and even “rigged” by McEntarfer, which is absurd. To anyone who knows anything about how these numbers are produced, this makes Trump look like a guy who is willing to manipulate economic data to his advantage. Only good numbers, please!
As I’ve said before, the mere availability of aggregate economic statistics seems to encourage activist policy. This is made worse by the unreliability and mis-measurement of these aggregates, which compounds policy failures. Like other parts of the federal statistical system, BLS reporting has shortcomings, some of them severe and getting worse. But that’s not McEntarfer’s doing. The numbers, for all their faults, are generated by a highly standardized process. Reforming that process will not be cheap.
One compelling take on the negative revisions is that they are really Trump’s very own fault. In an excellent post describing some of the technicalities that drive revisions, Claudia Sahm says:
“This is a policy problem, not a measurement problem. … Large, unpredictable shifts in economic policy are placing unusual strains on our measurement apparatus because they are causing large, unpredictable changes in the behavior of consumers and businesses. These changes are difficult to measure in real time. The GDP statistics this year have struggled to isolate massive swings in imported goods around the start of tariffs from its measure of domestic production. The initial estimates of payrolls didn’t capture the slowdown in employment, but that’s more a reflection of how sharp the jobs slowdown is, rather than a limitation of the surveys.“
The key lesson here is that shifts in the policy landscape can make economic activity more difficult to measure. And of course, policy uncertainty has contractionary effects on top of the stagflationary effects of higher taxes (i.e., tariffs). But I’m not holding out hope that Trump will engage in any introspection on the point.
As Sahm explains, the sharp slowing of job growth serves to highlight one of the difficulties inherent in survey-based measures of economic performance: not all responses are timely, and that is likely aggravated when underlying changes in activity are dramatic. In fact, she says, the June revision was driven largely by late reporting. Furthermore, the May and June revisions to payrolls were also partly driven by a change in seasonal adjustment factors based on new data (BLS uses a concurrent seasonal adjustment methodology).
In terms of industries, half of the June revision to payrolls came from state and local education, erasing an initial estimate showing that public education jobs had increased in June, which perplexed analysts at the time. The other half of the revision was spread broadly across the private sector.
In addition to the changeable nature of survey data and seasonal variability, BLS reports suffer because they often involve shaky assumptions made necessary by the limits of survey coverage. Perhaps the most controversial of these comes from the so-called birth/death (b/d) model of business formation/closure. This model is used by the BLS to estimate the net jobs created by new businesses that cannot be covered by the monthly Establishment Survey. Month-to-month, that can be a large gap to fill. Unfortunately, the b/d model can be extremely inaccurate, especially at turning points. In July 2025, the b/d model added about 257,000 jobs to total new jobs (prior to seasonal adjustment). Thus, the b/d assumption was 3.5 times the seasonally adjusted total gain of 73,000!
Critics of BLS methodology insist that its monthly payroll estimates should be benchmarked to quarterly data from a different survey as soon as it is available: the Quarterly Census of Employment and Wages, which has a 90% response rate. From Mish Shedlock:
“It is inexcusable for the BLS to not incorporate QCEW data as soon as possible.
“Instead, it relies on poor sampling of a small subset. On that poor sample, the response rate is pathetic.
“In addition, there is survival bias. In recognition of survival bias, the BLS concocted its absurd birth-death model.
“And on top that that, struggling businesses have no incentive to respond. In contrast, large corporations likely have someone dedicated to filling out government surveys.”
I’ve been critical of large BLS revisions in the past, as well as glaring inconsistencies between estimates of payroll jobs from the Establishment Survey and total civilian employment from the BLS Household Survey. Of course, they are different surveys designed to estimate different things with different samples, different coverage, geared toward counting jobs in one case and people employed and unemployed in the other. The two are benchmarked differently and at different frequencies. Still, it’s unsettling to see the two surveys diverge sharply in terms of monthly changes or trends, or to see consistently one-directional revisions. John Podhoretz states that the number of new nonfarm payroll jobs has been revised down in 25 of the past 30 months!
As Veronique de Rugy says, flaws are not the same as bad faith. Surely improvements can be made to both BLS surveys, their benchmarking, and to other adjustments and assumptions made for reporting. However, it’s pretty clear that BLS has not had the staffing and resources necessary to address these shortcomings. Over the ten years ending in 2024, inflation-adjusted BLS funding declined by more than 20%. At the same time, response rates on the Household survey have declined from 89% to less than 70%. The Establishment Survey of nonfarm businesses has also been plagued by deteriorating response rates, which fell from 61% to less than 43% over the past 10 years. And now, the Trump Administration has proposed an additional budget cut for the BLS of 8% in 2026.
Trump would have done better to ask the BLS commissioner what resources were needed to revamp its processes. Instead, his approach was to create a public spectacle by firing the head of the agency. One has to wonder how Trump might find a well-trained economist or statistician who will take the job if the numbers must always reflect well on the boss.
