• About

Sacred Cow Chips

Sacred Cow Chips

Monthly Archives: May 2020

Trump and Coronavirus

26 Tuesday May 2020

Posted by Nuetzel in Pandemic, Public Health, Risk Management, Stimulus, Trump Administration

≈ 1 Comment

Tags

Andrew Cuomo, Anthony Fauci, Bill De Blasio, CARES Act, CDC, Coronavirus, Deborah Birx, DHS, Disinfectant, Donald Trump, Elective Surgeries, FDA, Federalism, FEMA, Fiscal policy, Hydroxychloraquine, International Travel, Javits Center, John Bolton, John Cochrane, Laboratory Federalism, Lancet, Liability Waivers, Lockdowns, Michael Pence, Mike Pompeo, N95 Mask, NSC, Paycheck Protection Program, PPE, Robert Redfield, State Department, Testing, Unfunded Pensions, UV Light, Vaccines, Ventilators, WHO, Wuhan, Zinc

It’s a bit early to fully evaluate President Trump’s performance in dealing with the coronavirus pandemic, but there are a number of criteria on which I might assign marks. I’ll address some of those below, but in so doing I’m reminded of Jerry Garcia’s quip that he was “shopping around for something no one will like.” That might be how this goes. Of course, many of the sub-topics are worthy of lengthier treatment. The focus here is on the pandemic and not more general aspects of his performance in office, though there is some unavoidable overlap.

General “Readiness”

Many have criticized the Trump Administration for not being “ready” for a pandemic. I assign no grade on that basis because absolutely no one was ready, at least not in the West, so there is no sound premise for judgement. I also view the very general charge that Trump did not provide “leadership” as code for either “I don’t like him”, or “he refused to impose more authoritarian measures”, like a full-scale nationwide lockdown. Such is the over-prescriptive instinct of the Left.

Equally misleading is the allegation that Trump had “disbanded” the White House pandemic response team, and I have addressed that here. First, while the NSC would play a coordinating role, pandemic response is supposed to be the CDC’s job, when it isn’t too busy with diseases of social injustice to get it done. Second, it was John Bolton who executed a reorganization at the NSC. There were two high profile departures from the team in question at the time, and one one was a resignation. Most of the team’s staff remained with the NSC with the same duties as before the reirganization.

Finally, there was the matter of a distracting impeachment on false charges. This effort lasted through the first three years of Trump’s administration, finally culminating in January 2020. Perhaps the Administration would have had more time to focus on what was happening in China without the histrionics from the opposition party. So whatever else I might say below, these factors weigh toward leniency in my appraisal of Trump’s handing of the virus.

Messaging: C

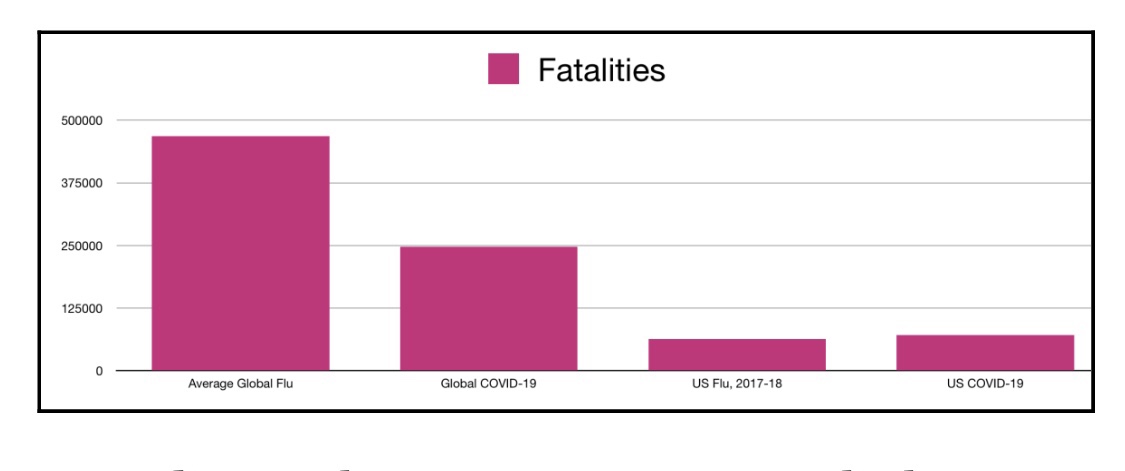
As usual, Trump’s messaging during the pandemic was often boorish and inarticulate. His appearances at coronavirus briefings were no exception, often cringeworthy and sometimes featuring misinterpretations of what his team of experts was saying. He was inconsistent in signaling optimism and pessimism, as were many others such as New York Governor Andrew Cuomo and New York City Mayor Bill De Blasio. It shifted from “the virus is about like the flu” in February to a more sober assessment by mid-March. This was, however, quite consistent with the messaging from Dr. Anthony Fauci over the same time frame, as well as the World Health Organization (WHO). Again, no one really knew what to expect, so it’s understandable. A great deal of that can be ascribed to “the fog of war”.

Delegation and Deference: B

Trump cannot be accused of ignoring expert advice through the episode. He was obviously on-board with Fauci, Dr. Deborah Birx, Dr. Robert Redfield, and other health care advisors on the “15 Days to Slow the Spread” guidelines issued on March 16. His messaging wavered during those 15 days, expressing a desire to fully reopen the nation by Easter, which Vice President Michael Pence later described as “aspirational”. Before the end of March, however, Trump went along with a 30-day extension of the guidelines. Finally, by mid-April, the White House released guidelines for “Opening Up America Again“, which was a collaboration between Trump’s health care experts and the economic team. Trump agreed that the timeline for reopening should be governed by “the data”. There is no question, however, that Trump was chomping at the bit for reopening at several stages of this process. I see value in that positioning, as it conveys an intent to reopen asap and that people should have confidence in progress toward that goal.  

International Travel Bans: A

If anyone wonders why the world was so thoroughly blindsided by the coronavirus, look no further than China’s failure to deliver a proper warning as 2019 drew to a close. Wuhan, China was ground zero; the virus spread to the rest of the world with travelers out of Wuhan and other Chinese cities. The White House announced severe restrictions on flights from China on January 31, including a two-week quarantine for returning U.S. citizens. In retrospect, it wasn’t a minute too soon, yet for that precaution, Trump was attacked as a racist by the Left. In early February, WHO actually said travel bans were unnecessary, among other missteps. Other bans were instituted on entry from Iran and Brazil, as well as entry from Europe in early March, as countries around the globe closed their borders. Trump’s actions on incoming travelers were prescient, so I’ll score this one for Trump. Some of these travel restrictions can and should be eased now, and certainly that is expected in coming months, so we’ll see how well that process is managed.

Deference to States: A-

As a federalist, I was pleased that Trump and his team left most of the specifics on closures and bans on public gatherings up to state and local governments. That allowed more targeted mitigation efforts as dictated by local conditions and, to some extent, public opinion. This is a classic case of “laboratory federalism” whereby the most effective policies can be identified, though as we’ve seen, there’s no guarantee less successful states will emulate them. I grade Trump well on this one.

On reopening, too, Trump has been a consistent advocate of allowing flexility where local conditions permit, though he wrongly claimed he had “total authority” over ending social distancing rules. It’s hard to square that remark with his general stand on the issue of autonomy except as a tactic to strong-arm certain governors on other points.   

CDC/FDA Snafus: D

I applaud the Administration for its emphasis on the salutary effects of deregulation, but Trump went along with some major pieces of “expert advice” that were not only poor from regulatory perspective, but an affront to federalism. One was a directive issued by the CDC to delay “all elective surgeries, non-essential medical, surgical, and dental procedures during the 2019 Novel Coronavirus (COVID-19) outbreak“. (See my post “Suspending Medical Care in the Name of Public Health“.)

This is exactly the kind of “one size fits all” regulatory policy that has proven so costly, sacrificing not just economic activity but lives and care for the sick, creating avoidable illnesses and complications. The idea was to assure that adequate health care resources were available to treat an onslaught of coronavirus patients, but that was unneeded in most jurisdictions. And while the contagion was in it’s early “exponential” phase at the time, a more nuanced approach could have been adopted to allow different geographic areas and facilities more discretion, especially for different kinds of patients, or perhaps something less than a complete suspension of care. In any case, the extensions into May were excessive. I must grade Trump poorly for allowing this to happen, despite what must have been extreme pressure to follow “expert advice” on the point and the others discussed earlier.

That’s not the only point on which I blame Trump for caving to the CDC. In a case of massive regulatory failure, the CDC and FDA put the U.S. well over a month behind on testing when the first signs of the virus appeared here. Not only did they prohibit private labs and universities from getting testing underway, insisting on exclusive use of the CDC’s own tests, they also distributed faulty tests in early February that took over a month to replace. The FDA also enforced barriers to imported N95-type masks during the pandemic. Trump tends to have a visceral understanding of the calcifying dangers of regulation, but he let the so-called “experts” call the shots here. Big mistake, and Trump shares the blame with these agencies.  

Health Resources: B-

Managing the emergency distribution of PPE and ventilators to states did not go as smoothly as might have been hoped. The shortage itself left FEMA with the unenviable task of allocating quantities that could never satisfy all demands. A few states were thought to have especially acute needs, but there was also an obligation to hold stockpiles against potential requests from other states. In fact, a situation of this kind creates an incentive for states to overstate their real needs, and there are indications that such was the case. Trump sparred with a few governors over these allocations. There is certainly blame to be shared, but I won’t grade Trump down for this.

Vaccines and Treatments: C+


The push to develop vaccines might not achieve success soon, if ever, but a huge effort is underway. Trump gets some of the credit for that, as well as the investment in capacity now to produce future vaccine candidates in large quantities. As for treatments, he was very excited about the promise of hydroxychloraquine, going so far as to take it himself with zinc, a combination for which no fully randomized trial results have been reported (the recent study appearing in the Lancet on HCQ taken by itself has been called into question). Trump also committed an unfortunate gaffe when the DHS announced the results of a study showing that sunlight kills coronavirus in a matter of minutes, as do bleach and other disinfectants. Trump mused that perhaps sunlight or some form of disinfectant could be used as a treatment for coronavirus patients. He might have been thinking about an old and controversial practice whereby blood is exposed to UV light and then returned to the body. Later, he said he used the term “disinfectant” sarcastically, but he probably meant to say “euphemistically” …. I’m not sure he knows the difference. In any case, his habit of speculating on such matters is often unhelpful, and he loses points for that.

Fiscal Policy: B

The several phases of the economic stimulus program were a collaboration between the Trump Administration and Congress. A reasonably good summary appears here. The major parts were the $2.3 trillion CARES Act in late March and a nearly $500 billion supplemental package in late April. These packages were unprecedented in size. Major provisions were direct cash payments and the Paycheck Protection Program (PPP), which provides loans and grants to small businesses. The execution of both was a bit clunky, especially PPP, which placed a burden on private banks to extend the loans but was sketchy in terms of qualifications. The extension of unemployment compensation left some workers with more benefits than they earned in their former jobs, which could be an impediment to reopening. There were a number of other reasonable measures in these packages and the two smaller bills that preceded them in March. A number of these measures were well-targeted and inventive, such as waiving early withdrawal penalties from IRA and 401(k) balances. The Trump Administration deserves credit for helping to shape these efforts as well as others taken independently by the executive branch. 

Trump’s proposal to suspend payroll taxes did not fly, at least not yet. The idea is to reduce the cost of hiring and increase the return to work, if only temporarily. This is not a particularly appealing idea because so much of the benefits would flow to those who haven’t lost their jobs. It could be improved if targeted at new hires and rehires, however.

Trump’s proposal to grant liability waivers to reopened private businesses is extremely contentious, but one I support. Lockdowns are being eased under the weight of often heavy public and private regulation of conduct. As John Cochrane says in “Get Ready for the Careful Economy“: 

“One worry on regulation is that it will provide a recipe for a wave of lawsuits. That may have been a reason the Administration tried to hold back CDC guidance. A long, expensive, and impractical list of things you must do to reopen is catnip when someone gets sick and wants to blame a business. Show us the records that you wiped down the bathrooms every half hour. A legal system that can sue over talcum powder is not above this.”

Indeed, potential liability might represent a staggering cost to many businesses, one that might not be insurable. Accusations of negligence, true or false, can carry significant legal costs. Customers and employees, not just businesses, must accept some of the burden of risks of doing business. I give Trump good marks for this one, but we’ll see if it goes anywhere.

Some of the proposals for new stimulus legislation from democrats are much worse, including diversity initiatives, massive subsidies for “green” technologies, and bailouts for state and local government for unfunded pension liabilities. None of these has anything to do with the virus. The burden of pension shortfalls in some states should not fall on taxpayers nationwide, but on the states that incurred them. The Trump Administration and congressional Republicans should continue resisting these opportunistic proposals.

The Grade

Without assigning weights to the sub-topics covered above, I’d put the overall grade for Trump and his Administration’s handling of matters during the pandemic at about a B-, thus far. When it comes to politics, it’s often unfair to credit or blame one side for the promulgation of an overall set of policies. Nevertheless, I think it’s fair to say that Trump, could have done much better and could have done much worse. We will learn more with the passage of time, the continued evolution of the virus, the development of treatments or vaccines, and the course of the economy.


Suspending Medical Care In the Name of Public Health

23 Saturday May 2020

Posted by Nuetzel in Health Care, Pandemic

≈ 3 Comments

Tags

Asian Flu, Comorbidities, Coronavirus, Covid-19, Get Outside, Hong Kong Flu, Imperial College Model, Italy, Lockdowns, Mortality by Age, Mortality Rates, Neil Ferguson, New York, Organ Failure, Pandemic, Public Health, Slow the Spread, South Korea, Spanish Flu, Suicide Hotlines, Vitamin D Deficiency

Step back in time six months and ask any health care professional about the consequences of suspending delivery of most medical care for a period of months. Forget about the coronavirus for a moment and just think about that “hypothetical”. These experts would have answered, uniformly, that it would be cataclysmic: months of undiagnosed cardiac and stroke symptoms; no cancer screenings, putting patients months behind on the survival curve; deferred procedures of all kinds; run-of-the-mill infections gone untreated; palsy and other neurological symptoms anxiously discounted by victims at home; a hold on treatments for all sorts of other progressive diseases; and patients ordinarily requiring hospitalization sent home. And to start back up, new health problems must compete with all that deferred care. Do you dare tally the death and other worsened outcomes? Both are no doubt significant.

What you just read has been a reality for more than two months due to federal and state orders to halt non-emergency medical procedures in the U.S. The intent was to conserve hospital capacity for a potential rush of coronavirus patients and to prevent others from exposure to the virus. That might have made sense in hot spots like New York, but even there the provision of temporary capacity went almost completely unused. Otherwise, clearing hospitals of non-Covid patients, who could have been segregated, was largely unnecessary. The fears prompted by these orders impacted delivery of care in emergency facilities: people have assiduously avoided emergency room visits. Even most regular office visits were placed on hold. And as for the reboot, there are health care facilities that will not survive the financial blow, leaving communities without local sources of care.

A lack of access to health care is one source of human misery, but let’s ask our health care professional about another “hypothetical”: the public health consequences of an economic depression. She would no doubt predict that the stresses of joblessness and business ruin would be acute. It’s reasonable to think of mental health issues first. Indeed, in the past two months, suicide hotlines have seen calls spike by multiples of normal levels (also see here and here). But the stresses of economic disaster often manifest in failing physical health as well. Common associations include hypertension, heart disease, migraines, inflammatory responses, immune deficiency, and other kinds of organ failure.

The loss of economic output during a shutdown can never be recovered. Goods don’t magically reappear on the shelves by government mandate. Running the printing press in order to make government benefit payments cannot make us whole. The output loss will permanently reduce the standard of living, and it will reduce our future ability to deal with pandemics and other crises by eroding the resources available to invest in public health, safety, and disaster relief.

What would our representative health care professional say about the health effects of a mass quarantine, stretching over months? What are the odds that it might compound the effects of the suspension in care? Confinement and isolation add to stress. In an idle state of boredom and dejection, many are unmotivated and have difficulty getting enough exercise. There may be a tendency to eat and drink excessively. And misguided exhortations to “stay inside” certainly would never help anyone with a Vitamin D deficiency, which bears a striking association with the severity of coronavirus infections.

But to be fair, was all this worthwhile in the presence of the coronavirus pandemic? What did health care professionals and public health officials know at the outset, in early to mid-March? There was lots of alarming talk of exponential growth and virus doubling times. There were anecdotal stories of younger people felled by the virus. Health care professionals were no doubt influenced by the dire conditions under which colleagues who cared for virus victims were working.

Nevertheless, a great deal was known in early March about the truly vulnerable segments of the population, even if you discount Chinese reporting. Mortality rates in South Korea and Italy were heavily skewed toward the aged and those with other risk factors. One can reasonably argue that health care professionals and policy experts should have known even then how best to mitigate the risks of the virus. That would have involved targeting high-risk segments of the population for quarantine, and treatment for the larger population in-line with the lower risks it actually faced. Vulnerable groups require protection, but death rates from coronavirus across the full age distribution closely mimic mortality from other causes, as the chart at the top of this chart shows.

The current global death toll is still quite small relative to major pandemics of the past (Spanish Flu, 1918-19: ~45 million; Asian Flu, 1957-58: 1.1 million; Hong Kong flu, 1969: 1 million; Covid-19 as of May 22: 333,000). But by mid-March, people were distressed by one particular epidemiological model (Neil Ferguson’s Imperial College Model, subsequently exposed as slipshod), predicting 2.2 million deaths in the U.S. (We are not yet at 100,000 deaths). Most people were willing to accept temporary non-prescription measures to “slow the spread“. But unreasonable fear and alarm, eagerly promoted by the media, drove the extension of lockdowns across the U.S. by up to two extra months in some states, and perhaps beyond.

The public health and policy establishment did not properly weigh the health care and economic costs of extended lockdowns against the real risks of the coronavirus. I believe many health care workers were goaded into supporting ongoing lockdowns in the same way as the public. They had to know that the suspension of medical care was a dire cost to pay, but they fell in line when the “experts” insisted that extensions of the lockdowns were worthwhile. Some knew better, and much of the public has learned better.

The Decline and Fall of a Virus

19 Tuesday May 2020

Posted by Nuetzel in Uncategorized

≈ 4 Comments

Tags

Heterogeneity, Inhomogeneity

Asymptomatic cases of coronavirus have some important implications, both good and bad. Of course, it’s great that so many people are asymptomatic. It demonstrates an innate immunity or some other kind of acquired immunity to the virus. On the other hand, these individuals can still spread the virus while infected, and they are hard to identify.

Estimates of the share of asymptomatic cases vary tremendously, some reaching almost 90%. But being asymptomatic is a matter of degree: in some cases there might be no symptoms whatsoever, from initial infection to complete suppression. In others, the symptoms are mild and may not raise any alarm in one’s mind. That distinction implies that testing criteria should be broadened, especially as the cost of testing declines.

Here I show two simple examples of viral spread to demonstrate that some level of asymptomatic “pre-immunity” in the population reduces the threshold at which the impact of the virus reverses. Both examples involve a population of 100 people. In both cases, social interactions are such that an infected person infects an average of two others. That is, the initial reproduction rate (known as R0) is equal to two. In both examples, the process starts with one infected individual:

Example #1:

Everyone is susceptible, meaning that the virus will cause symptoms and illness in anyone who catches it. Condensing the timeline, let’s just say we go from the first infection to three infections; then #2 and #3 each infect two more, and we have a total of seven infections; then the extra four pass the virus along to another eight victims and we’re up to 15; and so on. This is the exponential growth that is characteristic of the early stage of an epidemic. But then other dynamics start to kick in: most of the infected people recover with adaptive immunity, though a few may die. By now, however, only 85 susceptible people remain in the population, so each infected person infects an average of less than two more. The reproduction rate R must fall from it’s initial value of R0 as the susceptible population shrinks. By the time 50 people are infected and 50 susceptible people remain, the value of R is halved. In this example, that’s where herd immunity is achieved: when 50% of the population has been infected.

For those who enjoy math, here is a useful relation:

Herd Immunity Threshold (HIT) = 1 – 1/R0.

The higher is R0, the initial reproduction rate, the more people must be infected to achieve herd immunity. The coronavirus is said to have an R0 somewhere in the mid-2s. If it’s 2.5, then 60% of the population must be infected to achieve herd immunity under the assumption of universal susceptibility. When 60% are infected, R is equal to one. More people will be infected beyond that time, but fewer and fewer. R continues to fall, and the contagion wanes.

While I’ve abstracted from the time dimension, the total number of people who will be infected depends on factors like the duration of an infection. It takes time for an infected individual to come into contact with new, susceptible hosts for the virus, and fewer hosts will be available as time passes. That means the virus will die out well before the full population has been infected.

Example #2:

Let’s say 40 of the 100 people are not susceptible to the virus, meaning they will experience few if any symptoms if they catch it. Those 40 are innately immune, or perhaps they retain some adaptive immunity from previous exposure to a non-novel coronavirus. Strictly speaking, the entire population can catch the virus and can transmit it to others, but only 60% the population is susceptible to illness. It’s still true that each infected person would infect two others at the start. However, only 1.2 of those newly infected people would get sick on average. I will call that value the effective R0, which is net of the immune cohort. By the time 17 people have been infected, and about 10 of them get sick, there are only 50 susceptible people remaining. The effective R is already down to one. Herd immunity is effectively achieved after less than 20 infections. The HIT is just 17% (rounded)! That means the number of symptomatic infections will begin declining beyond that point. In this case, again depending on the average duration of an infection, it’s likely that much less than half of the population is ultimately sickened by the virus.

To summarize thus far, what example #2 demonstrates is that the existence of prior immunity in some individuals reduces the effective HIT. We know that sub-groups have differing levels of prior immunity / susceptibility to the coronavirus. In fact, for the coronavirus, we know the non-susceptible share of the population is substantial, given the large number of individuals who have been exposed but were asymptomatic.

Other Impacts on Reproduction Rate

Other influences can inhibit the spread of a virus. Weather, for example (see the nice interactive tool in “Weather and Transmission Rates“). Social distancing, including avoidance of “super-spreader events“, reduces the average number of people anyone can come into contact with. Masks might reduce the spread to others as well. Quarantining infected individuals obviously eliminates contacts with other individuals. Quarantining susceptible individuals prevents them from being exposed. In all of these cases, R is reduced more drastically over time from it’s initial value R0. This reduces the effective HIT and the ultimate number of individuals infected. Those effects are incremental to the impact of a large, non-susceptible sub-group, as in example #2, And there are variations on the appeal to heterogeneity that are equally convincing, as described below.

New HIT Literature

So herd immunity is not as far out of reach as many believe. That question is now being addressed more intensively in the academic world. Herd immunity occurs in the context of a virus’s ability to spread from host to host, which is summarized by R. In my limited review, most of the articles addressing a lower HIT emphasize distancing or other practices that reduce R. However, herd immunity really means that given a set of social conditions, enough of the population has either an innate or an acquired immunity to cause the impact of a contagion to recede. Both the level of immunity and the social conditions can alter the effective HIT.

Jacob Sullum offers a nice summary of some of this work. One paper describing the impact of heterogeneity emphasizes the order in which individuals become infected. Here is Sullum’s description with a link to the paper:

“A couple of new reports speculatively lower the possible herd immunity threshold for the coronavirus to just 10 to 20 percent of the population. This conjecture depends chiefly on assumptions about just how susceptible and connected members of the herd are. In their preprint, a team of European epidemiologists led by the Liverpool School of Tropical Medicine mathematical bioscientist Gabriela Gomes explains how this might work.

If highly susceptible herd members become infected and thus immune first, the preprint says, their subsequent interactions with the still-uninfected will not result in additional cases. Basically, the virus stymies itself by disproportionately removing those most useful to it from contributing to its future transmission. In addition, if herd members are very loosely connected and interact with one another rarely, the virus will have a much harder time jumping to its next victims. Sustained social distancing aimed at flattening the curve of coronavirus infections and cases mimics this effect.”

The sequential explanation is of obvious importance, But don’t it’s not the fundamental mechanism at play in example #2, which is strictly the heterogeneity of the population.

Nick Spyropoulas of the Alma Economics Group describes reductions in the herd immunity threshold in “Notes on the Dynamics of Subsequent Epidemic Waves“. It’s a very nice write-up, but it only emphasizes social distancing.

Judith Curry provides an excellent and well-referenced exposition of some herd immunity experiments. They are based on an even more extended approach to heterogeneity introducing: 1) variation in susceptibility across individuals; and 2) variation in the dispersion of transmission. The latter means, “… the extent to which infection happens through many spreaders or just a few“. She uses these mechanisms to modify a standard epidemiological model using prior estimates of variability to calibrate the model. Both experiments arrive at drastically lower HITs and total infections than her baseline experiment, which uses the standard model. The chart below shows her results with moderate heterogeneity. Her results with more extreme (though realistic) values of the heterogeneity metrics are even more remarkable. See the link above.

Check Against Real World

How does all this square with our experience to-date with the coronavirus? It’s difficult to tell with case counts, as the volume of testing keeps increasing and so many infected individuals are asymptomatic and remain undiagnosed. Estimates of R vary, but most states appear to have an R currently less than one. That means the virus is receding almost everywhere in the U.S. The same is true in much of the developed world, where the virus was most prevalent. Even Sweden, where achieving herd immunity is policy, diagnosed cases and deaths have been largely confined to vulnerable groups, and in total are less than many other (though not all) European countries.

Does that mean many areas in the U.S. and elsewhere have reached herd immunity? Locales that have had serological testing have thus far shown infection rates of anywhere from 2% to 10%, though New York City, where the outbreak was most severe, may have had more than 20% of its population infected as of a month ago. Different regions may have different HITs, so there is a chance that some areas, including NYC, are close to herd immunity.

Unfortunately, some of the reductions in R and in the effective HIT were won by social distancing, which will be reversed to some extent as the economy reopens. That’s the flip side of the “flat curve” we’ve managed to experience. The value of R may drift back toward or above one for a time. Diminished sunlight and humidity in the fall might have a similar effect. A second wave is not likely to be as bad as the first, however. That’s because: 1) we’ll now have more adaptive immunity in the population; 2) the most susceptible people are among those who already have acquired immunity or, more sadly, have died; 3) we’ll be better at coping with an outbreak in multiple ways; and 4) more speculatively, we’ll have identified the most effective treatments and, with less likelihood, a vaccine for those who want it.

Policy Lessons

In any outbreak, keeping R below one at least-cost is the objective. Given the alternatives, that rules out full-scale lockdowns because we know a large share of the population already has innate or acquired immunity. Forced shutdowns are unnecessarily costly relative to a targeted approach. But what form does that take?

Infected individuals must be quarantined until they recover, and their close contacts should be quarantined for up to a full incubation period. Large gatherings must be suspended temporarily. Testing capacity must be such that anyone with a fever or any symptom, mild or otherwise, can be tested. Regular testing of certain individuals like health care workers, teachers, and other first responders should take place. Simple screenings using infrared thermometers will be useful in high-traffic establishments. Precautions must be targeted at the most susceptible, and it’s pretty easy to identify them: the elderly and those with co-morbidities such as heart disease, diabetes, and lung conditions.

There are questions of civil liberties that must be addressed as well. Many high-risk individuals can live independently, so their freedoms must be weighed against their safety. Keeping this cohort quarantined is out of the question unless it’s voluntary. Regular testing should take place, and a subset of this group might already have the markers of immunity. Another question of civil liberties involves detailed contact tracing, which requires the establishment of an apparatus capable of great intrusion and abuse. I believe identification of close contacts should be an adequate precaution, though there may be degrees of tracing that I would find acceptable. Finally, a vaccine would be welcome, but it should not be mandatory


Covid Framing #6: The Great Over-Reaction

16 Saturday May 2020

Posted by Nuetzel in Pandemic

≈ 2 Comments

Tags

Asian Flu, California, Colorado, Confirmed Cases, Coronavirus, Covid-19, Death Toll, Florida, Georgia, Germany, Great Over-Reaction, Hong Kong Flu, Italy, Nate Silver, Neil Ferguson, New York, Pandemics, Spanish Flu, Sweden

I visited my doctor last Wednesday. He’s a specialist but also serves as my primary care physician, and we share the same condition. He’s affiliated with a prestigious medical school and practices on the campus of a large research hospital. First thing, I asked him, “So what do you think of all this?” Without hesitation, he said he believes we’re witnessing the single greatest over-reaction in all of medical history. He elaborated at length, which I very much appreciated, and I was gratified that much of what he said was familiar to me and my readers. The risks of the coronavirus are highly concentrated among the elderly and the already-sick, and the damage that the panic and lockdowns have done to the delivery of other medical care is probably a bigger tragedy, to say nothing of the economic damage. Furthermore, the Covid-19 pandemic is certainly not more threatening than others the world has experienced since WW II.

But did we know all that in March? No one with any sense believed the low numbers coming out of China; major flip-flops and mistakes by public health officials in the U.S. did much to confuse matters and delay evaluation of the outbreak. Nevertheless, there were reasons to proceed more deliberately. The explosion of cases in Italy and elsewhere consistently indicated that risk was concentrated among the elderly, so a targeted approach to protecting the vulnerable would have made sense. Still, individuals took voluntary action to social distance even before governments initiated broad lockdowns.

The lockdowns, of course, were sold as a short-term effort to “flatten the curve” so that medical resources would not be overwhelmed. There was, no doubt, great stress on front-line health care workers in March and April, and there were short-term shortages of personal protective equipment as well as ventilators for the most severe cases (but it’s possible ventilators actually harmed some patients). But whether you credit government action, private action, or the fact that so much of the population was not susceptible to begin with, mission accomplished! The strains were concentrated in certain geographic regions, especially the New York City metro area, but even there, the virus is on the wane. There is always the possibility of a major second wave, but perhaps it can be handled more intelligently by the public and especially public servants.

And now for some charts. Due to day-to-day volatility, and because the data on case numbers and deaths fluctuate on a weekly frequency, the charts below are on a 7-day moving average basis. It’s clear that the peak in U.S. daily confirmed cases was over five weeks ago, while the peak in Covid-attributed deaths was about three weeks ago.

Unfortunately, there is more doubt than ever about the legitimacy of the numbers. New York keeps “discovering” new deaths in nursing homes, a situation aggravated by a statewide order in March prohibiting homes from rejecting new or returning patients with active infections. There are reports from across the country of family deaths that were imminent, yet officially attributed to Covid. In one case, a death from severe alcohol poisoning was attributed to Covid. Colorado announced today that it was revising its death toll downward by about 24%.

The data on confirmed cases are elevated because testing keeps expanding. The first chart below shows that the number of daily tests has more than doubled over the past 3½ weeks. At the same time, the second chart below shows that the rate of “positives” has declined steadily for over six weeks. That is likely due to a combination of expanded testing for screening purposes, as opposed to testing mainly individuals presenting symptoms, and fewer individuals presenting symptoms each day.

As Nate Silver said on Saturday:

“There are still *way* too many stories about big spikes in cases when the cause of those spikes was a big increase in tests. And remember, it’s a good thing when states start doing more tests!”

One commenter on Silver’s thread pointed out that more testing is likely to lead to more confirmed cases even if the true number of infections is declining.

I’ll highlight just a few individual states. Missouri’s peak in cases appears to have occurred several weeks ago, though a spike at the end of April interrupted the trend. The spike was partly attributable to a flare-up at a single meat-packing plant (facilities that are particularly conducive to viral spread due to close conditions and aerosols).

Here is Georgia, which began to reopen its economy on April 24. The pro-lockdown crowd confidently predicted the reopening would lead to a spike in cases within two weeks. Georgia is conservative in its reporting, so they don’t extend the lines in the chart beyond 14 days of the most recent reports due to potential revisions. Nevertheless, it’s clear that the trend in cases is downward.

The pro-lockdown contingent predicted the same for Florida, but that has not been the case:

The next chart shows seven-day moving averages of deaths per million of population for four states: CA, FL, GA, and MO. The labels on the right might be hard to read, but MO is the green line. Deaths lag cases by a few weeks, and Missouri’s death rate was elevated more recently, again owing partly to the meat-packing plant. These death rates are all fairly low relative to the northeastern states around New York.

Finally, here are death rates per million of population for a few selected countries: Italy, Germany, Sweden, and the US. Italy had the large early spike, while Germany lagged and with a much lower fatality rate. The U.S. suffered more than twice the German death rate. Sweden, which has pursued a herd immunity strategy, has come in somewhat higher. The Italian and Swedish experiences both reflect high deaths in nursing homes, which might indicate a lack of preparedness at those institutions.

Here is a post from just a few days ago with a nice collection of charts for various countries.

Returning to the main gist of this “framing”, the Great Over-Reaction, the predictions setting off this panic were made by a forecaster, Neil Ferguson, who has had a rather poor track record of predicting the severity of earlier pandemics. The model he used is said to have been poorly coded and documented, and it is underdetermined such that many multiple forecast paths are possible. That means the choice of a “forecast” path is arbitrary.

Make no mistake: Covid-19 is a serious virus. Ultimately, however, the Covid-19 pandemic might not reach the scale of a typical global flu: the current global death toll is only about two-thirds of the average flu season (global deaths from Covid-19 are now about 312,000—the chart below is a few days old). In the U.S., the death toll is modestly higher than the average flu season, but that is largely attributable to the New York City metro area. Worldwide, Covid19 deaths are now about 30% of the toll of the Hong Kong flu in 1969-70, 28% of the Asian flu in 1957-58, and far less than 1% of the Spanish flu at the end of WW I. Neither the Hong Kong flu nor the Asian flu were dealt with via widespread non-prescription health interventions like the draconian lockdowns instituted this time. The damage to the economy has been massive and unjustifiable, and the effective moratorium on medical care for other serious conditions is inflicting a large toll of its own.

Again, we can identify distinct groups that are highly vulnerable to Covid-19: the aged and individuals with co-morbidities most common among the aged. A large share of the population is not susceptible, including children and the vast bulk of the work force. The sensible approach is to target vulnerable groups for protection while minimizing interference with the liberties of those capable of taking care of themselves, especially their freedom to weigh risks. Nevertheless, those facing low risks should continue to practice extra-good manners…. er, social distancing, to avoid subjecting others to undue risk. Don’t be a close talker, don’t go out if you feel at all out of sorts, and cover your sneezes!

Cuomo Denies Tradeoffs, Cries Scarcity

12 Tuesday May 2020

Posted by Nuetzel in Pandemic, statism, Virtue Signaling

≈ 1 Comment

Tags

Andrew Cuomo, BMI, Coronavirus, Cost-Benefit Analysis, Covid-19, Economic Value of Life, European Virus, Javits Center, Lockdown, New York Virus, Shadow Price, statism, The Nation, Ventilators, Who Shall Live?, Wuhan Virus

Here’s an all-time dumbass bromide: “If it saves only one life, it’s worth it.” New York Governor Andrew Cuomo said it last week in a bit of sanctimonious posturing intended for consumption by the unthinking. A variant on this is, “You can’t put a value on a human life,” and Cuomo said that too. But of course we do that every day. Yes, we weigh lives against costs, and we must. Each and every decision involving any personal or public health risk entails an implicit and sometimes explicit valuation of human life. There are few costless decisions in a world of scarce resources, and lives are often one of those costs. These might be matters of probability in an ex ante sense, which might make it more palatable. Ex post, they add up to real lives.

Imagine a world in which we spared no expense to save lives. We’d shift massive resources into health care to the detriment of all production and consumption that does not save lives. No precaution would be too conservative. No driving or biking, because those prohibitions would save many lives. Many risky construction and maintenance jobs would be off limits. No smoking, of course, and no drinking! No chips! Every BMI greater than 25 and you’re off to mandatory fat camp. Sadly, the effort to save a life is sometimes fruitless, but as long as there’s a chance, we’d try and try, providing mechanical life support to every patient hanging on by a tattered thread. No, we don’t do these things because it’s too damn costly.

We face an infinite number of tradeoffs in medical care and in public health more generally. The question “Who Shall Live?” must be answered every day when deciding how health care resources are to be allocated. No matter how you answer that question, certain lives will be lost as the cost of meeting your preferred medical objectives. You can’t meet them all. Resources are scarce — or in more everyday language, budgets are tight.

So human life is often assigned an implicit or shadow value in decision making. But even explicit assignment of economic value to human life is not uncommon. Valuing lives is a standard practice in cost-benefit analysis. It’s also quite common for life values to be estimated as part of forensic analyses in support of legal proceedings.

Andrew Cuomo surely knows all this. That makes his statements all the more disingenuous. This article in The Nation from the end of March implies that Cuomo has valued life all too cheaply in light of his past budget proposals for health care programs. Along the same lines, see this eye-opening critique of the policies Cuomo has pursued that left NY poorly prepared for a pandemic. And now, he’d like to keep his costly lockdown order in place even if it saves “just one life”.

Beyond all that, Cuomo is a stupendous hypocrite, asserting that life is too precious to spare any expense after signing an order in March requiring nursing homes to accept individuals with active Covid infections. Nursing homes have been the very hottest of spots for Covid infections and deaths, so the order was glaringly dismissive in valuing the lives of vulnerable nursing home residents. The rationale for the order was to save hospital beds, but there was no shortage. 

In fairness, Cuomo was also clamoring for assistance to add hospital capacity. Millions were spent to convert the Javits Center to a temporary field hospital and to bring a U.S. Navy hospital ship up the Hudson, but they went almost completely unused. Why not send the elderly patients there, instead of back to the nursing homes?

Finally, he pouted for weeks about his state’s shortage of ventilators, only to quickly reverse course as it became apparent that the state had a surplus of ventilators.

Recently, Cuomo felt it necessary to demonstrate his anti-Western bona fides by labeling the coronavirus the “European Virus“. He must think that’s a clever poke in the eye to those who prefer “Wuhan Virus”, though it is quite correct (and not the least bit “racist”) to note that the virus originated in Wuhan, China. For what it’s worth, the genome of the European strain, like the others that hit New York, differs by less than 12 out of 30,000 base-pairs of DNA from the original Wuhan strain. And of course the New York metropolitan area has made a massive contribution to the U.S. case load and death toll from the virus. Travelers from New York did much to spread Covid-19 to the rest of the country. So, as some have suggested, perhaps a better name might be “New York Virus”.

Andrew Cuomo is nothing if not a politician, and I suppose he’s just behaving like one. I probably wouldn’t gripe were it not for the minions who fall for Cuomo’s sham virtue. But it’s worse than that: the claim that public intervention at any cost is worthwhile if it saves “just one life” is a deeply statist sentiment.

On the Meaning of Herd Immunity

09 Saturday May 2020

Posted by Nuetzel in Pandemic, Public Health, Risk

≈ 2 Comments

Tags

Antibody, Antigen, Carl T. Bergstrom, Christopher Moore, Covid-19, Herd Immunity, Heterogeneity, Household Infection, Immunity, Infection Mortality Risk, Initial Viral Load, John Cochrane, Lockdowns, Marc Lipsitch, Muge Cevik, Natalie Dean, Natural Immunity, Philippe Lemoine, R0, Santa Fe Institute, SARS-CoV-2, Social Distancing, Super-Spreaders, Zvi Mowshowitz

Immunity doesn’t mean you won’t catch the virus. It means you aren’t terribly susceptible to its effects if you do catch it. There is great variation in the population with respect to susceptibility. This simple point may help to sweep away confusion over the meaning of “herd immunity” and what share of the population must be infected to achieve it.

Philippe Lemoine discusses this point in his call for an “honest debate about herd immunity“. He reproduces the following chart, which appeared in this NY Times piece by Carl T. Bergstrom and Natalie Dean:

Herd immunity, as defined by Bergstrom and Dean, occurs when there are sufficiently few susceptible individuals remaining in the population to whom the actively-infected can pass the virus. The number of susceptible individuals shrinks over time as more individuals are infected. The chart indicates that new infections will continue after herd immunity is achieved, but the contagion recedes because fewer additional infections are possible.

We tend to think of the immune population as those having already been exposed to the virus, and who have recovered. Those individuals have antibodies specifically targeted at the antigens produced by the virus. But many others have a natural immunity. That is, their immune systems have a natural ability to adapt to the virus.

Heterogeneity

At any point in a pandemic, the uninfected population covers a spectrum of individuals ranging from the highly susceptible to the hardly and non-susceptible. Immunity, in that sense, is a matter of degree. The point is that the number of susceptible individuals doesn’t start at 100%, as most discussions of herd immunity imply, but something much smaller. If a relatively high share of the population has low susceptibility, the virus won’t have to infect such a large share of the population to achieve effective herd immunity.

The apparent differences in susceptibility across segments of the population may be the key to early herd immunity. We’ve known for a while that the elderly and those with pre-existing conditions are highly vulnerable. Otherwise, youth and good health are associated with low vulnerability.

Lemoine references a paper written by several epidemiologists showing that “variation in susceptibility” to Covid-19 “lowers the herd immunity threshold”:

“Although estimates vary, it is currently believed that herd immunity to SARS-CoV-2 requires 60-70% of the population to be immune. Here we show that variation in susceptibility or exposure to infection can reduce these estimates. Achieving accurate estimates of heterogeneity for SARS-CoV-2 is therefore of paramount importance in controlling the COVID-19 pandemic.”

The chart below is from that paper. It shows a measure of this variation on the horizontal axis. The colored, vertical lines show estimates of historical variation in susceptibility to historical viral episodes. The dashed line shows the required exposure for herd immunity as a function of this measure of heterogeneity.

Their models show that under reasonable assumptions about heterogeneity, the reduction in the herd immunity threshold (in terms of the percent infected) may be dramatic, to perhaps less than 20%.

Then there are these tweets from Marc Lipsitch, who links to this study:

“As an illustration we show that if R0=2.5 in an age-structured community with mixing rates fitted to social activity studies, and also categorizing individuals into three categories: low active, average active and high active, and where preventive measures affect all mixing rates proportionally, then the disease-induced herd immunity level is hD=43% rather than hC=1−1/2.5=60%.”

Even the celebrated Dr. Bergstrom now admits, somewhat grudgingly, that hereogeniety reduces the herd immunity threshold, though he doesn’t think the difference is large enough to change the policy conversation. Lipsitch also is cautious about the implications.

Augmented Heterogeneity

Theoretically, social distancing reduces the herd immunity threshold. That’s because infected but “distanced” people are less likely to come into close contact with the susceptible. However, that holds only so long as distancing lasts. John Cochrane discusses this at length here. Social distancing compounds the mitigating effect of heterogeneity, reducing the infected share of the population required for herd immunity.

Another compounding effect on heterogeneity arises from the variability of initial viral load on infection (IVL), basically the amount of the virus transmitted to a new host. Zvi Mowshowitz discusses its potential importance and what it might imply about distancing, lockdowns, and the course of the pandemic. In any particular case, a weak IVL can turn into a severe infection and vice versa. In large numbers, however, IVL is likely to bear a positive relationship to severity. Mowshowitz explains that a low IVL can give one’s immune system a head start on the virus. Nursing home infections, taking place in enclosed, relatively cold and dry environments, are likely to involve heavy IVLs. In fact, so-called household infections tend to involve heavier IVLs than infections contracted outside of households. And, of course, you are very unlikely to catch Covid outdoors at all.

Further Discussion

How close are we to herd immunity? Perhaps much closer than we thought, but maybe not close enough to let down our guard. Almost 80% of the population is less than 60 years of age. However, according to this analysis, about 45% of the adult population (excluding nursing home residents) have any of six conditions indicating elevated risk of susceptibility to Covid-19 relative to young individuals with no co-morbidities. The absolute level of risk might not be “high” in many of those cases, but it is elevated. Again, children have extremely low susceptibility based on what we’ve seen so far.

This is supported by the transmission dynamics discussed in this Twitter thread by Dr. Muge Cevik. She concludes:

“In summary: While the infectious inoculum required for infection is unknown, these studies indicate that close & prolonged contact is required for #COVID19 transmission. The risk is highest in enclosed environments; household, long-term care facilities and public transport. …

Although limited, these studies so far indicate that susceptibility to infection increases with age (highest >60y) and growing evidence suggests children are less susceptible, are infrequently responsible for household transmission, are not the main drivers of this epidemic.”

Targeted isolation of the highly susceptible in nursing homes, as well as various forms of public “distancing aid” to the independent elderly or those with co-morbidities, is likely to achieve large reductions in the effective herd immunity ratio at low cost relative to general lockdowns.

The existence of so-called super-spreaders is another source of heterogeneity, and one that lends itself to targeting with limitations or cancellations of public events and large gatherings. What’s amazing about this is how the super-spreader phenomenon can lead to the combustion of large “hot spots” in infections even when the average reproduction rate of the virus is low (R0 < 1). This is nicely illustrated by Christopher Moore of the Santa Fe Institute. Super-spreading also implies, however, that while herd immunity signals a reduction in new infections and declines in the actively infected population, “hot spots” may continue to flare up in a seemingly random fashion. The consequences will depend on how susceptible individuals are protected, or on how they choose to mitigate risks themselves.

Conclusion

I’ve heard too many casual references to herd immunity requiring something like 70% of the population to be infected. It’s not that high. Many individuals already have a sort of natural immunity. Recognition of this heterogeneity has driven a shift in the emphasis of policy discussions to the idea of targeted lockdowns, rather than the kind of indiscriminate “dumb” lockdowns we’ve seen. The economic consequences of shifting from broad to targeted lockdowns would be massive. And why not? The health care system has loads of excess capacity, and Covid infection fatality risk (IFR) is turning out to be much lower than the early, naive estimates we were told to expect, which were based on confirmed case fatality rates (CFRs).

Private Social Distancing, Private Reversal

04 Monday May 2020

Posted by Nuetzel in Liberty, Pandemic, Uncategorized

≈ 1 Comment

Tags

Andrew Cuomo, Anthony Fauci, Apple Mobility, Bill De Blasio, Centre for Economic Policy Research, Donald Trump, Externalities, Forbes, Foursquare, Heterogeneity, John Koetsier, Laissez Faire, Lockdowns, Nancy Pelosi, Points of Interest, Private Governance, Safegraph, Social Distancing, Social Welfare, Stay-at-Home Orders, Vitamin D, Wal Mart, WHO

My original post on the dominance of voluntary social distancing over the mandated variety appears below. That dominance is qualified by the greater difficulty of engaging in certain activities when they are outlawed by government, or when the natural locations of activities are declared off-limits. Nevertheless, as with almost all regulation, people make certain “adjustments” to suit themselves (sometimes involving kickbacks to authorities, because regulation does nothing so well as creating opportunities for graft). Those “adjustments” often lead to much less desirable outcomes than the original, unregulated state. In the case of a pandemic, however, it’s tempting to view such unavoidable actions as a matter of compromise.

I say this now because the voluntary social distancing preceding most government lockdown orders in March (discussed in the post below) is subject to a degree of self-reversal. Apple Mobility Data suggests that something like that was happening throughout much of April, as shown in the chart at the top of this post. Now, in early May, the trend is likely to continue as some of the government lockdown mandates are being lifted, or at least loosened.

An earlier version of the chart above appeared in a Forbes article entitled, “Apple Data Shows Shelter-In-Place Is Ending, Whether Governments Want It To Or Not“. The author, John Koetsier, noted the Apple data are taken from map searches, so they may not be reliable indicators of actual movement. But he also featured some charts from Foursquare, which showed actual visits to various kinds of destinations, and some of theoe demonstrate the upward trend in activity.

In the original post below, I used SafeGraph charts lifted from a paper I described there. The four charts below are available on the SafeGraph website, which offered the services of the friendly little robot in the lower right-hand corner, but I demurred. You’ll probably need to click on the image to read the detail. They show more granular information by industry, brand, region, and restaurant categories. The upward trends are evident in quite a few of the series.

I should qualify my interpretation of the charts above and those in my original post: First, nine states did not have stay-at-home orders, though a few of those had varying restrictions on individuals and on the operation of “non-essential” businesses. The five having no orders of any kind (that I can tell) are lightly-populated, very low-density states, so the vast majority of the U.S. population was subject to some sort of lockdown measure. Second, eight states began to ease or lift orders in the last few days of April, Georgia and Colorado being the largest. Therefore, at the tail end, a small part of the increase in activity could be related to those liberalizations. Then again, it might have happened anyway.

The authoritarian impulse to shut everything down was largely unnecessary, and it did not accomplish much that voluntary distancing hadn’t accomplished already (again, see below). Healthy people need to stop cowering and take action. That includes the non-elderly and those free of underlying health conditions. Sure, take precautions, keep your distance, but get out of your home if you can. Get some sunny Vitamin D.

Committing yourself to the existence of a shut-in is not healthy, not wise, and it might destroy whatever wealth you possess if you are a working person. The data above show that people are recognizing that fact. As much as the Left wishes it were so, government seldom “knows better”. It is least effective when it uses force to suppress voluntary behavior; it is most effective when it follows consensus, and especially when it protects the rights of individuals to make their own choices where no consensus exists.

Last week’s post follows:

~~~~~~~~~~~~~~~~~~~~~~~~~~~~~~~

How much did state and local governments accomplish when they decided to issue stay-at-home orders? Perhaps not much. That’s the implication of data presented by the authors of “Internal and external effects of social distancing in a pandemic” (starts on page 22 in the linked PDF). Social distancing began in the U.S. in a series of voluntary, private actions. Government orders merely followed and, at best, reinforced those actions, but often in ham-handed ways.

The paper has a broader purpose than the finding that social distancing is often a matter of private initiative. I’ll say a bit more about it, but you can probably skip the rest of this paragraph without loss of continuity. The paper explores theoretical relationships between key parameters (including a social distancing construct) and the dynamics of a pandemic over time in a social welfare context. The authors study several alternatives: a baseline in which behavior doesn’t change in any way; a “laissez faire” path in which actions are all voluntary; and a “socially optimal” path imposed by a benevolent and all-knowing central authority (say what???). I’d offer more details, but I’ll await the coming extension promised by the authors to a world in which susceptible populations are heterogenous (e.g., like Covid-19, where children are virtually unaffected, healthy working age adults are roughly as at-risk as they are to the flu, and a population of the elderly and health-compromised individuals for which the virus is much more dangerous than the flu). In general, the paper seems to support a more liberalized approach to dealing with the pandemic, but that’s a matter of interpretation. Tyler Cowen, who deserves a hat-tip, believes that reading is correct “at the margin”.

Let’s look at some of the charts the authors present early in the paper. The data on social distancing behavior comes from Safegraph, a vendor of mobility data taken from cell phone location information. This data can be used to construct various proxies for aggregate social activity. The first chart below shows traffic at “points of interest” (POI) in the U.S. from March 8 to April 12, 2020. That’s the blue line. The red line is the percentage of the U.S. population subject to lockdown orders on each date. The authors explain the details in the notes below the chart:

Clearly POI visits were declining sharply before any governments imposed their own orders. The next two charts show similar declines in the percent of mobile devices that leave “home” each day (“home” being the device’s dominant location during nighttime hours) and the duration over which devices were away from “home”, on average.

So all of these measures of social activity began declining well ahead of the government orders. The authors say private social distancing preceded government action in all 50 states. POI traffic was down almost 40% by the time 10% of the U.S. population was subject to government orders, and those early declines accounted for the bulk of the total decline through April 12. The early drops in the two away-from-home measures were 15-20%, again accounting for well over half of the total decline.

The additional declines beyond that time, to the extent they can be discerned, could be either trends that would have continued even in the absence of government orders or reinforcing effects the orders themselves. This does not imply that lockdown orders have no effects on specific activities. Rather, it means that those orders have minor incremental effects on measures of aggregate social activity than the voluntary actions already taken. In other words, the government lockdowns are largely a matter of rearranging the deck chairs, or, that is to say, their distribution.

Many private individuals and institutions acted early in response to information about the virus, motivated by concerns about their own safety and the safety of family and friends. The public sector in the U.S. was not especially effective in providing information, with such politicos as President Donald Trump, Nancy Pelosi, Andrew Cuomo, Bill De Blasio, and the mayor of New Orleans minimizing the dangers into the month of March, and some among them encouraging people to get out and celebrate at public events. Even Anthony Fauci minimized the danger in late February (not to mention the World Health Organization). In fact, “the scientists” were as negligent in their guidance as anyone in the early stages of the pandemic.

When lockdown orders were issued, they were often arbitrary and nonsensical. Grocery stores, liquor stores, and Wal Mart were allowed to remain open, but department stores and gun shops were not. Beaches and parks were ordered closed, though there is little if any chance of infection outdoors. Lawn care services, another outdoor activity, were classified as non-essential in some jurisdictions and therefore prohibited. And certain personal services seem to be available to public officials, but not to private citizens. The lists of things one can and can’t buy truly defies logic.

In March, John W. Whitehead wrote:

“We’re talking about lockdown powers (at both the federal and state level): the ability to suspend the Constitution, indefinitely detain American citizens, bypass the courts, quarantine whole communities or segments of the population, override the First Amendment by outlawing religious gatherings and assemblies of more than a few people, shut down entire industries and manipulate the economy, muzzle dissidents, ‘stop and seize any plane, train or automobile to stymie the spread of contagious disease,’…”

That is fearsome indeed, and individuals can accomplish distancing without it. If you are extremely risk averse, you can distance yourself or take other precautions to remain protected. You can either take action to isolate yourself or you can decide to be in proximity to others. The more risk averse among us will internalize most of the cost of voluntary social distancing. The less risk averse will avoid that cost but face greater exposure to the virus. Of course, this raises questions of public support for vulnerable segments of the population for whom risk aversion will be quite rational. That would certainly be a more enlightened form of intervention than lockdowns, though support should be offered only to those highly at-risk individuals who can’t support themselves.

Christopher Phelan writes of three rationales for the lockdowns: buying time for development of a vaccine or treatments; reducing the number of infected individuals; and to avoid overwhelming the health care system. Phelan thinks all three are of questionable validity at this point. A vaccine might never arrive, and Phelan is pessimistic about treatments (I have more hope in that regard). Ultimately a large share of the population will be infected, lockdowns or not. And of course the health care system is not overwhelmed at this point. Yes, those caring for Covid patients are under a great stress, but the health care system as a whole, and patients with other maladies, are currently suffering from massive under-utilization.

If you wish to be socially distant, you are free to do so on your very own. Individuals are quite capable of voluntary risk mitigation without authoritarian fiat, as the charts above show. While private actors might not internalize all of the external costs of their activities, government is seldom capable of making the appropriate corrections. Coercion to enforce the kinds of crazy rules that have been imposed during this pandemic is the kind of abuse of power the nation’s founders intended to prevent. Reversing those orders can be difficult, and the precedent itself becomes a threat to future liberty. Nevertheless, we see mounting efforts to resist by those who are harmed by these orders, and by those who recognize the short-sighted nature of the orders. Private incentives for risk reduction, and private evaluation of the benefits of social and economic activity, offer superior governance to the draconian realities of lockdowns.

The Vagaries of Excess Deaths

02 Saturday May 2020

Posted by Nuetzel in Liberty, Pandemic, Tyranny

≈ 2 Comments

Tags

Cause of Death, CDC, Civid-Only Deaths, Co-Morbidities, Coronavirus, Covid-19, Denmark Covid, Eastern Europe Covid, Euromomo, Excess Mortality, Germany Covid, Jacob Sullum, John Burn-Murdoch, New York Covid, New York Times, Probable Covid Deaths

The New York Times ran a piece this week suggesting that excess mortality from Covid-19 in the U.S. is, or will be, quite high. The analysis was based on seven “hard hit” states, including three of the top four states in Covid death rate and five of the top ten. Two states in the analysis, New York and New Jersey, together account for over half of all U.S. active cases. This was thinly-veiled cherry picking by the Times, as Jacob Sullum notes in his discussion of what excess mortality does and doesn’t mean. Local and regional impacts of the virus have varied widely, depending on population density, international travel connections, cultural practices, the quality of medical care, and private and public reaction to news of the virus. To suggest that the experience in the rest of the country is likely to bear any similarity to these seven states is complete nonsense. Make no mistake: there have been excess deaths in the U.S. over the past few weeks of available data, but again, not of the magnitude the Times seems to intimate will be coming.

Beyond all that, the Times asserts that the CDC’s all-cause death count as of April 11 is a significant undercount, though the vast majority of deaths are counted within a three week time frame. In fact, CDC data at this link show that U.S. all-cause mortality was at a multi-year low during the first week of April. The author admits, however, that the most recent data is incomplete. The count will rise as reporting catches up, but even an allowance for the likely additions to come would leave the count for the U.S. well below the kinds of levels suggested by the Times‘s fear-mongering article, based as it was on the seven cherry-picked states.

The author of this Twitter thread, John Burn-Murdoch, seems to engage in the same practice with respect to Europe. He shows charts with excess deaths in 12 countries, almost all of which show significant, recent bumps in excess deaths (the sole exception being Denmark). Inexplicably, he excludes Germany and a number of other countries with low excess deaths or even “valleys” of negative excess deaths. His most recent update is a bit more inclusive, however. (It was the source of the chart at the top of this post.) Euromomo is a site that tracks excess mortality in 24 European countries or major regions (non-overlapping), and by my count, 13 of have no or very little excess mortality. And by the way, even this fails to account for a number of other Eastern European nations having low Covid deaths.

Excess mortality is a tricky metric: it cannot be measured with certainty, and almost any measure has conceptual shortcomings. In the case of Covid-19, excess mortality seeks to measure the number of deaths attributable to the virus net of deaths that would have occurred anyway in the absence of the virus. For example, abstracting from some of the details, suppose there are 360 deaths per hundred-thousand of population during the average month of a pandemic. If the “normal” mortality rate is 60 per hundred-thousand, then excess mortality is 300 per month. It can also be expressed as a percentage of the population (0.3% in the example). But that’s just one way to measure it.

In the spirit of Sullum’s article, it’s important to ask what we’re trying to learn from statistics on excess mortality. It’s easy to draw general conclusions if the number of Covid-19 deaths is far in excess of the normal death rate, but that depends on the quality of the data, and any conclusion is subject to limits on its applicability. Covid deaths are not that high in many places. By the same token, if the number of Covid deaths (defined narrowly) is below the normal death rate (measured by an average of prior years), it really conveys little information about whether excess mortality is positive of negative: that depends on the nature of the question. For each of the following I offer admittedly preliminary answers:

  • Are people dying from Covid-19? Of course, virtually everywhere. There is no “normal” death rate here. And while this is the most direct question, it might not be the “best” question.
  • Is Covid-19 causing an increase in respiratory deaths? Yes, in many places, but perhaps not everywhere. Here and below, the answer might depend on the time frame as well.
  • Is Covid-19 increasing deaths from infectious diseases (biological and viral)? Yes, but perhaps not everywhere.
  • Is Covid-19 increasing total deaths from natural causes? Yes, but not everywhere.
  • Is all-cause mortality increasing due to Covid-19? In some places, not others. Accurate global and national numbers are still a long way off.

All-cause mortality is the most “rough and ready” comparison we have, but it includes deaths that have no direct relationship to the disease. For example, traffic fatalities might be down significantly due to social distancing or regulation during a pandemic. Thus, if our purpose is purely epidemiological, traffic fatalities might bias excess mortality downward. On the other hand, delayed medical treatments or personal malaise during a pandemic might lead to higher deaths, creating an upward bias in excess deaths via comparisons based on all-cause mortality.

Do narrow comparisons give a more accurate picture? If we focus only on respiratory deaths then we exclude deaths from other causes and co-morbidities that would have occurred in the absence of the virus. That may create a bias in excess mortality. So narrow comparisons have their drawbacks, depending on our purpose.

That also goes for the length of time over which excess mortality is measured. It can make a big difference. Again, much has been made of the fact that so many victims of Covid-19 have been elderly or already ailing severely before the pandemic. There is no question that some of these deaths would have occurred anyway, which goes to the very point of calculating excess mortality. If the pandemic accelerates death by a matter of weeks or months for a certain percentage of victims, it is reasonable to measure excess mortality over a lengthier period of time, despite the (perhaps) highly valuable time lost by those victims (that being dependent on the decedent’s likely quality of life during the interval).

Conversely, too narrow a window in time can lead to biases that might run in either direction. Yet a cottage industry is busy calculating excess mortality even as we speak with the pandemic still underway. There are many fatalities to come that are excluded by premature calculations of excess mortality. On the other hand, if the peak in deaths is behind us, a narrow window and premature calculation may sharply exaggerate excess mortality.

Narrow measures of excess mortality are affected by the accuracy of cause-of-death statistics. There are always inaccuracies in this data because so many deaths involve multiple co-morbidities, so there is often an arbitrary element in these decisions. For Covid-19, cause-of-death attribution has been extremely problematic. Some cases are easy: those testing positive for the virus, or even its presence immediately after death, and having no other respiratory infections, can fairly be counted as Covid-19 deaths. But apparently just over half of Covid-19 deaths counted by the CDC are “Covid-Only” deaths. A significant share of deaths involve both Covid and the flu, pneumonia, or all three. There are also “probable” Covid-19 deaths now counted without testing. In fact, hospitals and nursing homes are being encouraged to code deaths that way, and there are often strong financial incentives to do so. Many deaths at home, sans autopsy, are now routinely classified as Covid-19 deaths. While I have no doubt there are many Covid deaths of untested individuals both inside or outside of hospitals, there is no question this practice will overcount Covid deaths. Whether you believe that or not, doubts about cause-of-death accuracy is another reason why narrow comparisons can be problematic.

More trustworthy estimates of the coronavirus’ excess mortality will be possible with the passage of time. It’s natural, in the heat of the pandemic, to ask about excess mortality, but such early estimates are subject to tremendous uncertainty. Unfortunately, those calculations are being leveraged and often mis-applied for political purposes. Don’t trust anyone who would use these statistics as a cudgel to deny your Constitutional rights, or otherwise to shame or threaten you.

New York’s Covid experience is not applicable to the country as a whole. Urban mortality statistics are not applicable to areas with lower population densities. Excess mortality for the elderly cannot be used to make broad generalizations about excess mortality for other age groups. And excess mortality at the peak of a pandemic cannot be used to make generalizations about the full course of the pandemic. In the end, I expect Covid-19 excess mortality to be positive, whether calculated by all-cause mortality or more narrow measures. However, it will not be uniform in its impact. Nor will it be of the magnitude we were warned to expect by the early epidemiological models.

Follow Sacred Cow Chips on WordPress.com

Recent Posts

  • The Perils of Powell: Inflation, Illiquid Banks, Lonnng Lags
  • The Dreaded Social Security Salvage Job
  • Tariffs, Content Quotas, and What Passes for Patriotism
  • Carbon Credits and Green Bonds Are Largely Fake
  • The Wasteful Nature of Recycling Mandates

Archives

  • April 2023
  • March 2023
  • February 2023
  • January 2023
  • December 2022
  • November 2022
  • October 2022
  • September 2022
  • August 2022
  • July 2022
  • June 2022
  • May 2022
  • April 2022
  • March 2022
  • February 2022
  • January 2022
  • December 2021
  • November 2021
  • October 2021
  • September 2021
  • August 2021
  • July 2021
  • June 2021
  • May 2021
  • April 2021
  • March 2021
  • February 2021
  • January 2021
  • December 2020
  • November 2020
  • October 2020
  • September 2020
  • August 2020
  • July 2020
  • June 2020
  • May 2020
  • April 2020
  • March 2020
  • February 2020
  • January 2020
  • December 2019
  • November 2019
  • October 2019
  • September 2019
  • August 2019
  • July 2019
  • June 2019
  • May 2019
  • April 2019
  • March 2019
  • February 2019
  • January 2019
  • December 2018
  • November 2018
  • October 2018
  • September 2018
  • August 2018
  • July 2018
  • June 2018
  • May 2018
  • April 2018
  • March 2018
  • February 2018
  • January 2018
  • December 2017
  • November 2017
  • October 2017
  • September 2017
  • August 2017
  • July 2017
  • June 2017
  • May 2017
  • April 2017
  • March 2017
  • February 2017
  • January 2017
  • December 2016
  • November 2016
  • October 2016
  • September 2016
  • August 2016
  • July 2016
  • June 2016
  • May 2016
  • April 2016
  • March 2016
  • February 2016
  • January 2016
  • December 2015
  • November 2015
  • October 2015
  • September 2015
  • August 2015
  • July 2015
  • June 2015
  • May 2015
  • April 2015
  • March 2015
  • February 2015
  • January 2015
  • December 2014
  • November 2014
  • October 2014
  • September 2014
  • August 2014
  • July 2014
  • June 2014
  • May 2014
  • April 2014
  • March 2014

Blogs I Follow

  • Ominous The Spirit
  • Passive Income Kickstart
  • OnlyFinance.net
  • TLC Cholesterol
  • Nintil
  • kendunning.net
  • DCWhispers.com
  • Hoong-Wai in the UK
  • Marginal REVOLUTION
  • Stlouis
  • Watts Up With That?
  • Aussie Nationalist Blog
  • American Elephants
  • The View from Alexandria
  • The Gymnasium
  • A Force for Good
  • Notes On Liberty
  • troymo
  • SUNDAY BLOG Stephanie Sievers
  • Miss Lou Acquiring Lore
  • Your Well Wisher Program
  • Objectivism In Depth
  • RobotEnomics
  • Orderstatistic
  • Paradigm Library

Blog at WordPress.com.

Ominous The Spirit

Ominous The Spirit is an artist that makes music, paints, and creates photography. He donates 100% of profits to charity.

Passive Income Kickstart

OnlyFinance.net

TLC Cholesterol

Nintil

To estimate, compare, distinguish, discuss, and trace to its principal sources everything

kendunning.net

The future is ours to create.

DCWhispers.com

Hoong-Wai in the UK

A Commonwealth immigrant's perspective on the UK's public arena.

Marginal REVOLUTION

Small Steps Toward A Much Better World

Stlouis

Watts Up With That?

The world's most viewed site on global warming and climate change

Aussie Nationalist Blog

Commentary from a Paleoconservative and Nationalist perspective

American Elephants

Defending Life, Liberty and the Pursuit of Happiness

The View from Alexandria

In advanced civilizations the period loosely called Alexandrian is usually associated with flexible morals, perfunctory religion, populist standards and cosmopolitan tastes, feminism, exotic cults, and the rapid turnover of high and low fads---in short, a falling away (which is all that decadence means) from the strictness of traditional rules, embodied in character and inforced from within. -- Jacques Barzun

The Gymnasium

A place for reason, politics, economics, and faith steeped in the classical liberal tradition

A Force for Good

How economics, morality, and markets combine

Notes On Liberty

Spontaneous thoughts on a humble creed

troymo

SUNDAY BLOG Stephanie Sievers

Escaping the everyday life with photographs from my travels

Miss Lou Acquiring Lore

Gallery of Life...

Your Well Wisher Program

Attempt to solve commonly known problems…

Objectivism In Depth

Exploring Ayn Rand's revolutionary philosophy.

RobotEnomics

(A)n (I)ntelligent Future

Orderstatistic

Economics, chess and anything else on my mind.

Paradigm Library

OODA Looping

  • Follow Following
    • Sacred Cow Chips
    • Join 121 other followers
    • Already have a WordPress.com account? Log in now.
    • Sacred Cow Chips
    • Customize
    • Follow Following
    • Sign up
    • Log in
    • Report this content
    • View site in Reader
    • Manage subscriptions
    • Collapse this bar
 

Loading Comments...