In a free economy there are strong tendencies for wages to correspond closely to worker productivity. Shortfalls in wages below marginal productivities are exploited by firms competing for workers, pushing wages upward. Likewise, workers compete for jobs, so an excess of wages over productivity levels will likewise be competed away. The close connection between wages and productivity ensures that labor resources are allocated to their most productive and remunerative uses.
That seemingly miraculous tendency is a natural outcome of free markets and capitalism. Its force is strong in most sectors, but not when an employer has monopsony power, where powerful frictions prevent worker mobility, or where unions prevent competition between workers. A more ubiquitous threat to the correspondence between wages and productivity is from interventionists seeking to use the coercive power of government to capture rents at the expense of others. For example, minimum wages benefit many workers, but they distort the allocation of labor and punish the least productive members of the workforce. Likewise, DEI mandates via law or arbitrated settlement involve discrimination and disrupt natural, merit-based allocations of labor. Laws requiring union shops (or mandated arbitration) give unions monopoly power and raise union wages. They also restrict the freedom of non-union workers to choose their own representation and to compete for work with the employer of their choice. These distortions drive a wedge between wages and productivity, thus restraining trade and hampering economic growth.
But there are far more coercive forms of intervention in the labor market. China’s labor laws ostensibly protect worker rights. Like anywhere else, if enforced, it’s minimum wage laws (which vary across regions and are expressed monthly for full-time workers) would not protect workers from the normal unintended consequences. But it’s worse than that in China, almost as if those labor laws don’t exist. AsLi Qiang states in The Diplomat, Chinese employers extract a labor cost discount via:
“… a labor system that systematically lowers costs through lax enforcement, extended working hours, and wage suppression. The result is a structural cost gap that reflects not superior productivity, but a different set of rules governing how labor is treated and how much it is allowed to bear.“
In fact, Qiang says workers are often required to be on the job for 12-hour shifts (or more) six days a week, and they often must live in company dormitories.
Another practice that is far too common in China is the delay and often nonpayment of wages. This has been an issue since 1978, according to Lily Zhao, writing on the World Socialist Web Site. Protests over wage arrears have become quite common across all of China, especially among manufacturing and construction workers. Furthermore, this has been exacerbated with decisions rendered by Chinese courts that workers do not have recourse to payment by general contractors, but only from the “intermediaries” or subcontractors who actually hire them for a job. In practice, this often means workers have no recourse at all.
These abuses are particularly common in the treatment of workers who have migrated from the hinterlands to industrial cities. Protests over arrears have been condemned by the Chinese media. Police have sometimes brutally intervened, and some local governments maintain blacklists of workers whose behavior is deemed “abnormal”.
Zhao summarizes the situation early in her article:
“In reality, the CCP regime has, in recent years, been deepening its attacks on the democratic rights of workers and using all means to prevent them from demanding their unpaid wages—through legislation, vilification and arrests.“
And where does the money go? Certainly company owners and construction project contractors benefit, but only by virtue of cronyism, not capitalism. Others like the police, media, and even the judicial system may get a cut, but Zhou implicates the “CCP state apparatus”, and she is surely correct.
Years ago I scoffed at allegations that China was “dumping” goods on international markets below their true cost, but I’m afraid it’s true to a greater or lesser extent across many goods. However, it’s tough to find supporting data when you can hardly believe a thing a country reports. Nevertheless, there is credible evidence of wage suppression in China arising from facts that are probably looked upon with pride by the Chinese regime. Yasheng Huang, writing on his Substack, calls China an “absolute advantage economy”, by which he means that it has both lower capital costs and lower labor costs than most of its trading partners. The country does what it must to be more than competitive across all tradeable goods.
To do this, China must find ways to ignore its comparative disadvantages in certain products. By that, I mean there are goods produced which entail a larger, true sacrifice of lost output in other goods. Huang notes that “Comparative advantage is a theory about dividing up the work, not about competing for it“, but he does a disservice to David Ricardo by failing to acknowledge, up front, that a country ignores its comparative disadvantages only at a high cost. Someone must pay for the sacrifice that entails. And guess who pays in China!
Huang does a simple comparison of Chinese exports and imports across a diverse set of 98 categories of goods. He looks at the individual categories and finds that the ratio of exports to imports is well above one for advanced as well as simple goods. Huang asserts that Chinese output per worker is low by international standards, so competitive pricing must be the driver, not productive efficiency. His conclusion is reinforced by China’s labor share of income in manufacturing, which is lower than many developed, developing, and emerging countries, which tend to specialize in different categories of goods in which they possess comparative advantages.
On the services side of the Chinese economy, there is little to be gleaned regarding wage suppression from trade data, as exports and inputs of services are a small proportion of Chinese trade. However, for many years productivity in Chinese services (including consumer services and the gig economy) grew at a torrid pace. Meanwhile, wages have been stagnant in the labor-intensive service sector, which includes many consumer services.
In a free economy, wages typically follow trends in labor productivity. However, in China that is not the case due to its abusive labor practices. These include suppression of wages, tolerance of non-payment of wages, crackdowns on protests, and coercive tactics like arrests of workers and blacklists for “abnormal behavior”. This has been especially acute among migrant factory workers, but wage suppression, including nonpayment, is a fact of life in the provision of many services as well. Ostensibly, the Chinese bureaucracy, courts, and police do not take the country’s labor laws seriously. Instead, they wink at deals that surely benefit party cronies or the CCP itself. Wage suppression has allowed the Chinese to compete across a broad range of tradeable goods, making large and persistent trade surpluses possible. In this case, the cost falls squarely on workers.
Bad policy ideas are circulating that have been conceived amid hysteria over AI. These are interventionist approaches to the development and deployment of AI models, ranging from direct confiscation of AI capital, taxes on the flow of compute, various forms of regulation, and state and local efforts to forbid the construction of data centers. All of these actions would unnecessarily inhibit achievement of AI’s enormous potential benefits and present unnecessary national security challenges as well.
Land Use and Displacement
Emotionally I’m probably just as NIMBY as the next guy when it comes to developments in my vicinity that might offend my personal aesthetics or intrude on my privacy. But at a more rational level, I object to developments that will inflict external costs on me. I happen to live in a private community that provides some buffer against incursions of those kinds, but I deeply sympathize with anyone who finds their property will soon be next door to a large or obnoxious industrial, commercial or government facility, and I despise the use of eminent domain for almost any purpose.
But let’s step back and consider the case in which an owner of private property receives what they feel is just compensation on the sale of their land to a data center developer. This property might be in your close proximity, but you can’t prevent your neighbor from selling unless it’s by way of a larger political process to revoke his property rights. Of course, you can help organize or join a resistance group in an attempt to stop the development. That’s perfectly reasonable if you fear the prospect of having your property stranded in the middle of a new industrial or commercial development.
Ultimately, such efforts are likely to influence negotiations between communities and developers. In fact, developers of data centers can often be persuaded to work with communities in addressing public concerns, and some developers are eager to do so.
Water and Power Consumption
Aside from land use, potential displacement, and aesthetic issues (including plain-old NIMBYism), other underlying concerns exciting local opposition to data centers have to do with predicted strains on water and power supplies. These are no doubt critical issues in certain localities. However, on the whole these concerns are vastly overblown, as elucidated by Andy Masley at this link. In particular, water use by data centers is on the same order of magnitude as other industrial uses. Contrary to some claims, any water pollution by data centers is usually confined to the construction phase, if at all, and in that respect is very much like any other construction project. And as Masley points out, a data center can generate tax revenue for use in reducing water scarcity.
It should also be noted that data centers house the computational power of the entire internet. As the chart (from Masley) at the top of this post shows, AI represents an incremental need that is still relatively small relative to total data center power use. Incidentally, water cooling rather than air cooling reduces a data center’s power consumption.
Nevertheless, the power consumption of data centers is indeed a matter of critical importance and controversy. Referring again to the chart at the top, it’s evident that data center power usage is growing rapidly. However, developers are increasingly planning to produce their own power off-grid, often colocating with their power sources to minimize transmission costs. This includes locating alongside natural gas basins, installing wind and solar collection facilities nearby, and coming soon, incorporating modular nuclear reactors. The latter would provide base-load, dispatchable, zero-carbon power for data centers. Of course, modular reactors will be costly and might eat into returns from developing data centers, but other power sources are costly as well, and it is the one sure dispatchable, zero-carbon, off-grid solution.
Water and energy supplies for data centers are key to enabling broad contributions of AI to consumer welfare, productivity growth, and national security. Local interests should weigh other benefits that construction of data centers will bring to a community. Construction jobs and permanent data center jobs are obviously important considerations, as well as the aforementioned increases in local tax revenue.
State Regulation and Litigation
Of course, AI controversies are playing out at the national and state levels as well. First, there is the issue of AI regulation. AI legislation in all 50 states attempts to regulate various “threatening” aspects of AI. These bills address topics such as fraud prevention (e.g., deep fakes), chatbot safety, and restrictions on automated AI decisioning (e.g., hiring, insurance coverage and claims adjudication).
There is litigation and potential litigation at the state level related to alleged abuses by Open AI’s ChatGPT. These concern the use of customer data and alleged encouragement of self-harm, among other matters. And the New York legislature has passed a bill calling for a one-year moratorium on AI data center development.
These regulatory and legal efforts at the state and local level raise the prospect of fragmented treatment of AI in different jurisdictions that would be disruptive and costly for both AI companies and users. Federalist principles aside, economic efficiency argues for a more uniform approach to many concerns about AI. But whether it’s at the federal, state, or local level, tight regulatory control of AI risks compromising the healthy competitive development of AItechnology and the industry. That’s because politicians and bureaucrats cannot possess the knowledge of evolving competition, scarcity, and market incentives only revealed by free market processes.
Rooting for Regulation
Unfortunately, modern-day Luddites at the national level are calling for a moratorium on AI development. In fact, in 2023, fears of AI misalignment with human interests brought even Elon Musk to call for a six-month “pause” on development. Today, a number of industry insiders call for a “slowdown”, if only other countries go along with it (fat chance!).
Yes, AI is improving… fast, but the most consequential threats have to do with security protocols. Anthropic, in particular, almost begged for government control over its Mythos product, which recently gripped the AI and cybersecurity communities with its advanced ability to identify software vulnerabilities. The Fable version is said to incorporate “guardrails”, but reportedly Fable is vulnerable to “jailbreaks”. In what should not have surprised Anthropic after its own warnings, the federal government imposed export controls, restricting access by foreign nationals. And now, Anthropic has withdrawn availability of the models worldwide..
Be Careful What You Ask For
Perhaps Anthropic got what it deserved, but sadly, the Trump Administration seems to have crossed a threshold from a “light touch” approach to regulating AI to something more severe. Let’s hope the Mythos/Fable affair doesn’t presage a permanent transition from private governance to state control. Thatwouldinhibit development and present risks likely to rattle some of AI’s most important customers, .
The last link cites Timnit Gebru’s critique that AI labs have made a huge miscalculation:
“She argues that AI labs have consistently used ‘dangerous AI’ narratives for marketing, investor appeal, and competitive advantage, only for the narrative to backfire when actual state power intervenes. (on X)”
It’s possible that Anthropic and a few of its competitors have fallen for the same mistaken notion that central planning by government bureaucrats can improve upon market processes. Statists on the right and the left have been eager to join the chorus for regulatory control.
Dean Ball channels Friedrich Hayek in the following tweet on the mistaken impression that government must impose a “strategy” and “plan” AI.
“I think part of it, at least vis a vis US/China competition, is that US and western chattering classes find it hard to believe that the market-driven outcome of frontier AI could possibly be right. They basically believe, in their hearts, that the Chinese system, with its ‘industrial strategy,’ has eclipsed capitalism. So they harbor the same inferiority complex toward the Chinese system that many Americans once harbored toward the EU’s system. Their heuristic is that the industrial strategists of China have grasped the whole picture of the technological competition in a way that US industrialists, with their ‘profit maximizing incentives,’ could not possibly have matched. And so any outcome in the economy that is not the result of ‘strategy’ is therefore prima facie worse than what the ‘strategists’ have concocted. They also believe the Chinese strategists possess awesome powers of foresight and the ability to evade all tendencies of financial and economic gravity, due of course to ‘strategy,’ really it’s almost a kind of orientalism.”
National security is an important consideration, of course, but AI development should not be hamstrung for fear of the ever-present need for improved encryption or by the prospect of threats from autonomous weapons systems. Indeed, AI can and should be put to use defending against all such threats to national security without compromising its promise as a revolutionary technology with a wide range of applications. Again, Trump’s purported intent to encourage U.S. AI development is undercut by his fixations on controlling trade and “taking stakes”. And do foreign customers want to deal with this confusing state of affairs? Or simply go to China?
AI and Capital Redistribution
Another nest of controversies has to do with the widespread presumption that AI will be negative for labor markets. Prescriptions from the populist left and right include various kinds of AI taxation, redistribution, and even nationalization.
Bernie Sanders and Donald Trump both want a sovereign wealth fund, and Sanders wants to fund it with a one-time 50% tax on AI stock. Sanders, the High Prince of Economic Parasites, is sponsoring a bill he claims would allow the American public to take a role in determining the future of AI, whatever that means. What he hopes to create is a mechanism for wealth redistribution, since the fashionable view is that AI will be a catastrophe for labor. While the AI industry is far from profitable at the moment, many AI stocks have soared in value. And Sanders’ target “AI industry” might fairly broad, including chip manufacturers and other producers of AI infrastructure.
If the public wants to kill AI investment in the U.S., tank equity markets, and give politicians an excuse for more profligate spending, then Sander’s bill is a grand idea. It would be an outright expropriation of wealth. The impacts on economic growth, productivity, American competitiveness, and national security would be unambiguously negative. And lest you think such a redistribution is necessary to compensate for job losses caused by AI, that issue is far from settled. In fact, it’s highly likely that the job realignment certain to take place will result in growth from a variety of occupations previously unimagined, just as technological advances have in the past.
The Compute Tax
Others (including Sanders) have also broached the idea of a “compute tax”, or as Brian Albrecht explains:
“… a levy on computational resources. Think GPU hours, processing power, data center electricity, or some similar proxy for AI work.”
Albrecht believes the real intent is to tax the stock of physical AI capital, as opposed to a flow of input services rendered for AI. But consider the number of goods and services whose values are likely to be enhanced by the use of AI as an input. And also consider the innovation and discovery that will be made possible by AI. Albrecht wisely questions the logic of adding to the cost and discouraging this value added via taxation. In the context of killing the golden goose, he cites two rules of optimal taxation: don’t tax intermediate goods and don’t tax capital. When the supply of capital is elastic, he notes, taxing it is more likely to harm workers than to help them. And one can reasonably argue that the external benefits expected to flow from AI would justify a compute subsidy rather than a tax. Finally, Albrecht cautions that a compute tax, unless it is very broad and at a very high rate, won’t raise much revenue.
Trump’s Confusion
Bernie Sanders deserves plenty of condemnation for his infantile, class-warfare rhetoric and interventionist approach to economic policy, including state ownership of the means of production. But in practice Donald Trump isn’t much better. He’s been busy partially nationalizing several different industries, including steel, semiconductors, nuclear energy, rocket motors, quantum computing, and critical mineral supplies, often with direct reins on business decisions (e.g., the “Golden Share” in U.S. Steel). Now, he’s angling to acquire equity stakes in AI companies. The Senate Armed Services Committee is ready to help him out with a bill that would establish a Department of Defense Equity Investment Account at the Treasury.
These are all part of the sovereign wealth fund Trump has decided is in the fiscal and national security interests of the U.S. Again, government ownership stakes in private companies invite cronyism, political interference, and regulatory capture. In the case of AI, it is an invitation to censorship and government surveillance. Moreover, spare government funds would be better spent paying down our burgeoning public debt, reducing government obligations and interest expense at zero risk. In contrast, the value of private equity stakes and their returns are fully at risk, while leaving government debt, interest expenses, and interest rate rollover risks in place.
Trump is now inveigling the likes of Sam Altman (OpenAI), Dario Amodei (Anthropic), Sundar Pichai (Google), and even Elon Musk (xAI) to accept his vision of public ownership of AI stock. It’s effectively a trap and a prescription for competitive failure, but Trump doesn’t get it.
Superabundance?
Many AI industry leaders have indeed bought into some version of an AI wealth transfer, primarily because they accept the notion of superabundance along with heavy losses of remunerative work for humans. But in fact they don’t understand the economics of capital deepening and the contradictions implied by their position.
First, savings and funds available for capex are scarce, and any given project for AI buildout must compete with many other valued uses. The working world will not be monopolized by AI robots any time soon, even given dramatic cost reductions. AI may well increase the productivity of human workers (along with their wages) in greater proportion than other forms of physical capital. But some forms of labor are likely to be in surplus, and that will cause the wages in those occupations to become more competitive relative to the cost of potential AI-augmented substitutes. In fact, occupations in which humans are more competitive than machines will persist. Here is Albrecht on this point:
“And comparative advantage always pops up fighting against [human job losses]. When automation makes some things cheap, the things that remain expensive tend to be the things that are hard to automate. And the things that are hard to automate are, almost by definition, the things where humans still have comparative advantage. The saved dollar drifts toward where humans are still worth paying. That’s not optimism. That’s what comparative advantage means.“
A second contradiction of the superabundance job-loss narrative is, as I’ve said, that there will be many inventive new occupations available for humans. At worst, job losses will be a transitional phenomenon. Third, superabundance itself implies drastically lower prices, which would ultimately benefit wage earners and consumers, obviating the need for government intervention on their behalf.
I had to laugh when I read this quote of Rebecca Lowe, who has an amusing and sensible reaction to the “AI will take all the jobs” narrative:
“I think a large part of this is you don’t really get experts in their particular domains writing about AI. Instead, you get ‘the AI expert’, and they want to reinvent the wheel. You see this when they write about economics, or when they write about philosophy. You talk to an AI person and suddenly they’re like, ‘I’ve just discovered this thing!’ And it turns out they’re talking about, like, supply and demand. And you’re like, oh my God.”
CCP Interference
I’ll briefly touch on one other controversy: whether the anti-AI/data center furor is being instigated by the Chinese in an attempt to undermine U.S. leadership in AI. The House Energy and Commerce Committee claims to have evidence that strongly suggests the CCPs involvement in attempts to hamstring substantial U.S. leadership in AI. Apparently no details on that evidence have been made public, however. It would not be surprising or uncharacteristic of the CCP, and if true would constitute another tension in the attempt to safeguard national security while avoiding government obstruction in AI development.
Summary
Artificial intelligence is animating economic controversies at the local, state and federal levels. Like other forms of industrial development, opponents are roused by claims of strains on local resources as well as displacement of property owners. Some of these claims are exaggerated or can be resolved via negotiation or technological solutions.
There are also fears that AI can be used in a variety of nefarious ways. There may be legitimate dangers, and AI companies themselves are actively working to address so called “alignment” issues. Nevertheless, there are increasing calls for state and/or federal regulation of AI. These proposals must be approached cautiously or they could easily derail U.S. progress on perhaps the most promising technologies to ever come down the line. That would indeed represent an economic and national security failure.
Finally, fear that AI will lead to large-scale job losses and widening inequality has prompted calls for taxes on AI capital, or even partial nationalization, with redistribution of future profits to the public. This would be a colossal mistake. Nothing could stanch AI development more effectively than such a policy. Unfortunately, even Donald Trump has called for the government to take equity stakes in AI companies pursuant to “national priorities” and supposedly for the benefit of American taxpayers. In fact, this partial nationalization has already begun. This is a prescription for destructive regulation, planning failures, and corruption.
The key lesson in all this is that we’ll all be better off if government stays out of the way of AI development.
A lot has changed since Kevin Warsh was nominated by President Trump to replace Jerome Powell as chairman of the Federal Reserve Board. Most notably that includes the war in Iran, the run-up in oil prices, and a bond market increasingly nervous about inflation as it attempts to digest massive supplies of new Treasury debt. Tariffs have also contributed to the updraft in measured inflation since then, which (in addition to oil prices) represents another impingement on the economy’s supply side.
Change and Change Itself
By the time Warsh was sworn in as chairman, expectations for Fed rate cuts had swung to expectations of a quarter-point increase in the federal funds rate target, if not at the mid-June meeting of the Federal Open Market Committee (FOMC) then in July. It’s not clear that Warsh is on board with that, and the status of the Iranian conflict, oil supplies, and the bond market could change dramatically before the June meeting.
Short-term inflation expectations have risen, so a rate hike by the Fed might seem reasonable if not for the possibility that current inflation is transitory (but I use that term guardedly). In terms of money growth, policy seems roughly neutral to slightly restrictive. M2 growth from a year earlier was 4.7% in April. Nominal (current dollar) GDP grew at a slightly faster 5.1% clip in the first quarter, and it might accelerate in Q2. Real GDP advanced 1.6% from a year ago in the first quarter, but the Atlanta Fed’s forecast for real GDP in Q2 is a stronger 3.2%. Meanwhile, core PCE inflation (the Fed’s preferred gauge) was 3.1% in the first quarter and 3.3% in April. If the numbers roughly follow the same track going forward, nominal GDP in Q2 could be up by about 6% – 6.5% from a year ago. Slowing the rate of M2 growth much from its recent pace might be an overreaction.
Moreover, it might be premature to raise the funds rate when a peaceful resolution to the Iran conflict is still possible. Again, we might know by the time the FOMC convenes in June. In that case, market rates could ease quickly. I am skeptical, however, that Iran will prove to be a reliable partner to any peace agreement. I’ll be surprised if the blockade on the Strait of Hormuz ends any time soon, and a few air strikes have already been renewed. Still, I expect the FOMC to defer any rate hike until at least the July meeting. In fact, I’ll be surprised to see one at all.
Sound Money or Monetary Madness
Many describe Warsh as a “sound money” guy, having been greatly influenced by Milton Friedman. He’s been critical of quantitative easing (QE): the Fed’s purchases of securities for its own balance sheet to provide liquidity to the markets and banking system. If the hostilities continue in Iran, Warsh is more likely to favor quantitative tightening (QT) in the short-term than rate hikes. QT would involve reductions holdings of securities on the Fed’s balance sheet, which Warsh has long advocated.
On the other hand, Warsh has been undaunted in insisting that the AI revolution will be a dramatic deflationary force. That’s a longer-term proposition, but it reinforces his preference for lower rates. So Warsh is for “sound money” and would like to see QT, but he also prefers lower rates and apparently believes that AI might justify a more expansionary monetary posture. So where does that leave us?
Squaring the Circle
A few months ago I described a coherent policy agenda for the Fed under Kevin Warsh, given his policy preferences. It might have lacked realism in terms of Fed politics, but it was motivated by the question of whether lower rates are compatible with QT. The discussion did not anticipate the Iran conflict and its economic and financial consequences.
Lower rates and QT would be compatible if the Fed enables and incentivizes commercial banks to hold more securities and lend more aggressively. This would require regulatory changes as well as reductions in interest on bank reserves (IOR) held at the Fed.
Judy Shelton in the Wall Street Journal has made the same point, characterizing such a policy shift as “pro-market”. That’s because it would allow banks to invest in relatively safe assets, would eliminate a subsidy masquerading as a price (IOR – though fully administered), and would mean a transition from the Fed’s emphasis on maintaining ample bank reserves to scarce bank reserves. The latter would restore activity in the market for overnight loans of reserves (federal funds), which would then trade at a price corresponding to their degree of scarcity. That would provide an important signal to other markets, not to mention the Fed itself. Today, that signal is distorted by the Fed’s provision of ample reserves (repo rates notwithstanding). Jai Kadia and Norbert Michel have madea similar argument, along with advocating for rules-based monetary policy, rather than frequently destabilizing discretionary actions.
Momentum
In April, David Beckworth noted that momentum is buildingin influential circles for this change, which he describes as a “demand driven” approach, as opposed to the “supply driven”, ample reserve operating procedure now in force. This is the more common at many foreign central banks, and it has received prominent mention in recent speeches and statements by Fed officials. As Beckworth puts it in the title of his post, “The Fed’s Overton Window Is Shifting”.
Beckworth also mentions Warsh’s desire to establish a new Treasury-Fed Accord. The original 1951 Accord established the Fed’s independence from Treasury financing operations. Today’s ample reserves approach has made it far too easy for the Fed to succumb to pressures to monetize deficits and intervene in capital markets to manipulate longer rates. Warsh would surely like to re-establish the Fed’s monetary authority as a separate and independent function from Treasury financing.
The Fed Board of Governors (BoG) must approve changes in interest on reserves (IOR). (Better yet, an act of Congress would be required to prohibit IOR.) But Warsh, who is said to have good relations with the Fed staff and other Fed governors, is less likely to get a majority on the BoG than even the FOMC. For now, he’ll have to be persuasive to gain the support of a majority of either body.
Summary
Kevin Warsh is likely to argue strenuously for reductions in the size of the Fed’s balance sheet, and would almost certainly be happy for the FOMC to defer any rate hikes pending more clarity on a resolution to the Iran conflict. He will also argue for creating greater incentives for banks themselves to invest in Treasury debt, including reformed regulations on bank asset holdings and reduced interest on reserves held at the Fed. Ultimately, that would pave the way for lower rates on a variety of assets. But the Fed should be probably be cautious and gradual in the implementation: the changes to IOR and bank regulations must be well coordinated with QT and money growth must be calibrated to meet the Fed’s inflation target (or better yet, a nominal GDP target — see Part 2 of this post).
Evidence is piling up that claims of anthropogenic global warming (AGW) and an incipient climate apocalypse have constituted vast exaggerations if not outright falsehoods. And for several years it’s been hard to miss indications that the social mood has shifted away from climate alarmism. That’s true inside and outside the climate science community, where so-called “consensus” has given way to growing skepticism and dissent.
Backing Away From Crazy Town
The most prominent shift in the climate “vibe” involves the Intergovernmental Panel on Climate Change (IPCC), which has grown to be the chief climate-change propaganda arm of the United Nations and the environmental left. The IPCC has now received new climate change scenarios from an upstream committee to be used in the IPCC’s upcoming Seventh Assessment Report (AR7). Roger Pielke Jr. reviewed the changes, which are noteworthy due to their scaled-back projections of atmospheric CO2 concentrations and global warming.
The three most extreme scenarios for CO2 forcings have been eliminated: RCP8.5, SSP5-8.5, and SSP3-7.0. These scenarios have become “implausible”, according to this paper, which credits renewable energy and climate policy for the changed outlook. “Implausible” is the right word, but this narrative is a preposterous attempt to save face. The extreme scenarios were never realistic, and that should be obvious to even the climate-change orthodoxy.
Given the IPCC’s track record, it might be surprising that the extreme scenarios were so influential. The most extreme, RCP8.5, was used in over 17,000 papers as the basis of climate change and various damage calculations. It’s not been unusual for documents to go so far as to describe RCP8.5 as “Business as Usual”.
The best argument I’ve heard in favor of the extreme scenarios is that they represented stress tests that could be used to interpolate many less extreme scenarios without the substantial cost of additional model simulations. A key quote is that “It’s easier to interpolate than extrapolate.” That’s fine, though my own experience in running model simulations informs me that the comment cited at the link likely exaggerates the cost of model runs. Furthermore, “interpolating” complex models over decades is not a simple business, or non-controversial for that matter. And perhaps most importantly, it would have been incumbent on the IPCC and other climate authorities to make clear to the press, the public, educators, and policymakers that the most extreme scenario did NOT represent BAU, and were not to be interpreted as plausible outcomes. That critical disclaimer simply fell through the cracks.
Models, Reality, and Data
That such extreme scenarios should prove influential as key inputs to other models speaks to the confusion between empirical evidence and a narrative treated as consensus by the left, including much of the press. It’s bad enough that so many observers unknowingly take model outputs as empirics. That is all too common in discussions of climate change, but these extreme model outputs go well beyond that sort of confusion, and their promotion seems quite intentional.
Challenging “Consensus”
In my last post I discussed Jonathan Cohler’s take-down of so-called “global temperature” measurements, particularly the Global Mean Surface Temperature. As Cohler notes, this metric is no more valid as a representation of physical reality than an infinite array of other calculations. Cohler has made several other noteworthy contributions to the growing canon of climate realism.
Here I wish to discuss another important Cohler paper, this one with coauthor Willie Soon, debunking the widely-held belief that rising atmospheric CO2 concentrations are attributable to human activity, and more specifically the burning of fossil fuels. Below, I try my best to explain the logic and empirics underlying the Cohler-Soon (CS) conclusions in nontechnical language. Any mistakes are mine.
Isotopic Signatures
CS take advantage of the isotopic “signature” of net carbon additions to the atmosphere. This refers to the atomic makeup (number of neutrons) of different carbon sources. They find that the isotopic signature of the aggregate source flow has been quite stable for decades, even centuries based on proxy measures. But fossil fuels have a more extreme isotopic signature than natural carbon sources. These signatures are illustrated in the graphic at the top of this post, taken from a paper by Heather Graven, et al. Thus, CS conclude that the burning of fossil fuels has had little impact on the (trendless) aggregate source signature (NOT the cumulative atmospheric signature on the upper left of the graphic, which has risen). The source signature should have trended more decisively if fossil fuels dominated the rise in atmospheric CO2, especially as human emissions grew over the decades.
CS find that atmospheric carbon tends to dissipate fairly rapidly due to natural processes: 3.5 – 4 years, contrary to frequent assertions of very slow decay (see CS Table 1). It’s what plants breathe, converting it to oxygen; oceans absorb a great deal of carbon as well. Furthermore, human emissions have accounted for only about 4% of gross fluxes of CO2 into the atmosphere each year. CS state that the balance comes from natural sources such as “oceanic processes and … terrestrial respiration.” These include plant decay and geothermal activity. These natural sources have less extreme isotopic signatures than fossil fuel emissions. (I say “extreme” because most of these signatures take negative values.) Based on these facts, CS show that increases in natural fluxes can easily account for the added CO2 that has accumulated since the 1950s.
An Alternative Explanation
The meaning of the Cohler-Soon paper is that to-date, all but the last several years of human emissions of CO2 are still present in the atmosphere. Obviously, this concentration would grow if annual emissions grow. But to-date, the stability of the net source signature suggests that some other carbon source is acting to offset the extreme isotopic signature of CO2 from burning fossil fuels. In fact, that logic suggests that ocean outgassing, geothermal fluxes, plant decay and the soil biosphere can account for the added atmospheric carbon. Those natural sources have less extreme isotopic signatures, especially geothermal, followed by ocean outgassing.
But what caused this increase in natural fluxes? CS maintain that warming temperatures since the end of the Little Ice Age (1300 – 1850) led to the increase in atmospheric carbon from oceanic and biospheric fluxes. The higher temperatures themselves were not driven by CO2 concentrations but by greater solar radiation, changes in cloud cover, ocean cycles, and deep ocean heating. This conclusion is supported by earlier research conducted by Soon and other authors cited in the CS paper.
Failed Models and Predictions
More and more, we see that virtually every assertion made by the climate-crisis orthodoxy lacks evidence that stands up to scrutiny. The earth is not “on fire”. It is greening beautifully. Here’s a helpful timeline of failed, catastrophic climate predictions made since the mid-1960s. There will be many more. One such failed prediction calls for severe storms to increase in frequency and intensity, but that trend is negative. The trend in forest fires is negative as well, as are droughts, despite alarmist predictions. The oft-cited trend in sea levels has been in place since the Little Ice Age, with no recent acceleration. See this page for information on other climate phenomena that run contrary to the alarmist narrative.
Summary
Evidence from isotopic measures of CO2 over recent decades, and proxy measures over several centuries, show that the much-dreaded rise in carbon concentrations had its probable origin in natural sources. Human emissions are too inconsequential relative to natural sources, and carbon dissipates too rapidly in the atmosphere to support the hypothesis of rising carbon concentration based on human activity. Natural sources include geologic and oceanic outgassing, along with decaying matter and soil. These fluxes were stimulated by warmer temperatures brought on by stronger solar radiance, geothermal deep ocean heating, and changes in cloud cover.
So the evidence strongly indicates that higher temperatures induced more atmospheric carbon fluxes, not vice-versa. But how can that be when the models used by the climate science establishment embed assumptions to the contrary? The answer is that they are models based on sketchy empirics, not reality, and the line of causation seemed logical to modelers searching for a culprit. Furthermore, the causal chain upon which the models depend was often politically and financially expedient. While higher carbon concentrations can lead to rising temperatures given radiative forcing, the effect is weak and tapers at higher CO2 concentrations.
The IPCC’s retirement of its extreme climate scenarios represents a significant change. It is not that the extreme model scenarios have “become less likely”. It’s because those scenarios were always farfetched and reality finally caught up with the extremist narrative. This should give us all pause whenever policymakers attempt to sell costly initiatives to address climate change, anthropogenic global warming, climate sustainability, or the alarmist euphemism of the day. We’re not yet free of the exaggerated climate narratives, as this piece regarding the new IPCC scenarios tells us.
At the heart of the climate crisis narrative lies a huge weakness regarding a thing its believers take for granted: whether our measures of global temperature are meaningful, let alone reliable. The problems are both at the level of individual weather stations, their siting, their geographical distribution, and perhaps even more critically, their aggregation into the so-called Global Mean Surface Temperature (GMST).
The Weather Station Network
In the U.S. and worldwide we have about one weather station for every one thousand square miles. However, the geographic distribution of weather stations is highly uneven (see the map of land-based stations above) and is more sparse in rural areas than in urban environments. It’s also very sparse in highly remote and extreme environments.
At best, a temperature reading at a particular weather station might be approximately representative of its surrounding area at that moment. However, temperatures from place-to-place are influenced by many varying features of local geography. That includes altitude, the presence of waterways and bodies of water, other surface features such as rock and greenery, and human land use. Thus, conditions at a given weather station might not be at all descriptive of the surrounding area.
Moreover, there are no well-defined geographic “zones” to which weather stations are assigned. Attempts to do so involve arbitrary and irregular boundaries and drastic variations in size. “Averaging” temperatures across such zones requires a crude attempt to assign weights based on distances and ultimately yields mongrelized statistics. Furthermore, daily temperature averages are based on averages of high and low temperatures at each station. Such an average might only describe the actual temperature at a station for an instant, but regardless of duration, the timing is likely to differ across any two stations. Not only that, but many weather stations do not record “daily” temperatures based on normal calendar days. Thus, temperature averages across stations are calculated across locations, extremes only, and time. And again, inputs of temperatures from the individual stations are not representative of their respective zones.
Deterioration in the quality of weather station sites has been the subject of sharp criticism over the years. There are now a large number of poorly-sited stations, often located in close proximity to paved surfaces, concrete, metals, or exhaust fans. These kinds of features impart an upward bias to the local temperature record. Individually, these are small examples of the well-known urban heat island effect. In the aggregate, it creates a substantial exaggeration in temperatures, accounting for about 50% of the estimated warming trend for the U.S.
According to this study, the upward bias is more severe for poorly-sited stations, and the quality of siting often deteriorates over time as urban growth encroaches on outlying communities. Urban sites tend to warm the most, followed by semi-urban sites, followed by rural sites. Even worse, the study found that the NOAH temperature adjustment process creates a contagion of the warming bias, passing biases from poor sites along to better stations as an artifact. That is, the process adjusts temperatures upward for well-sited stations to more closely match poor sites!
Ocean temperatures present their own challenges. Several different techniques have been used over the years, but the most consistent and reliable ocean temperatures are from so-called ARGO buoys, which have been available only since 2003. Before that, ocean temperatures were taken using buckets dipped into the water from the sides of ships, and from engine water intakes. Unfortunately, error rates on reported observations from ARGO buoys (which involve several factors besides the accuracy of the thermometers themselves, such as transmission errors) are unknown, but they appear to be far outside acceptable limits. Thus, reasonably good sea surface records have only recently contributed to global temperature coverage, and even those are subject to great uncertainty. (Satellite temperature measurements, by the way, are really indirect estimates of temperatures based on radiance and subsequent calibrations.)
Thus, historical temperature records are an amalgam of different measurement instruments at different locations at different times of the day, adding layers of inconsistency to the calculation of temperature averages.
Physically Untethered
I was prompted to write this post after readinga mathematical analysis of the impossibility of aggregating temperature readings across multiple weather stations in any meaningful way. The analysis, by Jonathan Cohler, is a damning indictment of GMST as a concept. It relies on a series of calculations and transformations that are arbitrarily chosen from many unsuitable alternatives. Cohler says that such an “average temperature” calculation is necessarily “untethered” from the various states of nature it attempts to summarize.
Temperature itself is a so-called intensive quantity. That means it is independent of the size of the system it characterizes. If you combine it with an identical twin system, the temperature of the combined whole doesn’t double, unlike measures like mass or volume. The latter are examples of extensive quantities.
Temperatures vary from one spot to another within a given system while in disequilibrium, and of course they vary over the course of any day. However, the validity of a temperature measurement at a particular location and time requires a local state of equilibrium in the immediate vicinity of the measuring instrument. Otherwise, a temperature measurement is would not be a valid descriptor of the condition of the (very local) system.
Faulty Aggregations
With that in mind, imagine the many arbitrary ways we can devise to aggregate temperatures across weather stations for which conditions differ drastically. These are all attempts to calculate a single temperature for a large and geographically uneven system in a continuing state of disequilibrium. And every combination of weather station temperatures represents an artificially combined “system” in a state of disequilibrium. That’s true of any two adjacent weather stations or of all the weather stations on the globe. No one method of doing so can claim validity as a measure of system-wide temperature. This contrasts with extensive quantities, for which well-defined rules of aggregation exist (e.g., summation) regardless of a system’s dynamic condition.
Over time, the temperature records involve a changing number of stations, local environmental conditions, accuracy, and a varying mix of seawater bucket measurements, ship engine water intake measurements, and ARGO floats. These disparities reinforce the impossibility of measuring wide-ranging “average” trends in temperature.
As Cohler demonstrates mathematically, these temperature averages are physically meaningless. He offers a crazy-sounding example of blending two intensive measurements: averaging the PH of your morning coffee with the PH of seawater at a nearby coast. This is very much of a kind with averaging temperatures across weather stations under disparate conditions. Furthermore, as noted above, the steps employed to arrive at the temperature to be used for each station, and the weight each station is assigned in the average, is hardly a unique set of calculations. There is an infinite number of equally invalid aggregations of the same data.
Grand Ambiguity
Cohler is not the first to point out that the concept of a global temperature average is physically meaningless. In 2007, a paper by Christopher Essex, et al was entitled, “Does a Global Temperature Exist?” The abstract states (my brackets):
“Distinct and equally valid [or invalid] statistical rules can and do show opposite trends when applied to the results of computations from physical models and real data in the atmosphere. A given temperature field can be interpreted as both ‘warming’ and ‘cooling’ simultaneously, making the concept of warming in the context of the issue of global warming physically ill-posed.”
This is all the more salient in a world with warming biases at poorly sited weather stations and a strong urban heat island effect.
My Glass House?
Of course, there are other areas in which similar statistical “sins” are common, some of which are also used repeatedly by climate alarmists: ocean water PH, whichCohler explains cannot be averaged across “parcels”. The result is meaningless. If that isn’t enough for you to harbor doubts about the ocean acidification narrative, just read the first few paragraphs of the tweet linked above!
Similar examples occur in the world of economic data. For example, prices are intensive measures, but economists often refer to an aggregate “price level”. Can such a thing truly exist? Simply averaging prices of all goods and services creates a meaningless figure. Each price can be weighted in a variety of ways (e.g., by shares of a fixed or varying “market basket”). There are several prominent alternatives, all of which have strengths and weaknesses, but none has a claim as an accurate measure of “the price level.”
In fact, though economists talk about it constantly, it can be said that “the price level” does not exist as an objective reality, just as there is no “global temperature.” The difference is that economists readily acknowledge this fundamental ambiguity surrounding price aggregation. Some even insist, for example, that only nominal aggregates (e.g., total spending = prices x quantities), rather than inflation in “the price level”, be considered in certain policy domains, though there is more than one reason for that preference. In contrast, climate officialdom, within the likes of such organizations as the IPCC and NOAH, are loath to acknowledge weaknesses in GMST.
Conclusion
There are many reasons to question the climate orthodoxy, which holds that human emissions of carbon dioxide, a trace gas, produce a warming global temperature trend. An issue that’s been largely taken for granted is the integrity of the so-called global temperature, most commonly the GMST. The reality is that it’s impossible to identify a unique method of calculating a global temperature. It’s possible to specify many different aggregations of local temperature readings, but there is no “true” way of measuring global temperature. Another way of putting this is that it’s impossible to define a single global temperature as a physical reality. There is no such thing.
Nevertheless, global temperature is a critical pillar on which climate alarmism rests, and Cohler has published equally damning critiques of several other climate measurements (also see here), such as mean ocean PH, ocean heat content, and human contribution to atmospheric CO2. Climate authorities should acknowledge the inherent weakness of relying on temperature aggregations, and especially any one aggregation. Perhaps they could define several alternatives, as economists have with price indices, acknowledging the impossibility of pinning down a true global temperature.
The real lesson here is that we should approach climate statistics both with skepticism and humility. Even if you must pretend that it exists, any measure of a so-called global temperature and its trend is of highly of uncertain value. This is critical when it comes to assessing climate policy. As Jack Salmon says in a somewhat broader context:
“One of the most striking features of modern climate economics is not consensus, it’s dispersion. Depending on which paper, model, or administration you consult, the economic damages from climate change range from modest to catastrophic.“
Recently I mentioned the many executive orders (EOs) issued by President Trump since his inauguration. He’s on a record-setting pace! Of course, he pushes the envelope because he’s serious about his agenda, Congress is often paralyzed, and because he can. As one X poster puts it, Trump “swings for the fences”. The system allows him to take shots as chief executive, and if you don’t like it you’ll have to wait for the courts to rule on challenges. So far, in cases that have been decided, the Administration’s court record in defending Trump’s EOs would be good for an MLB batting average.
The Circle of Rent Seeking
Like his overall record as president, Trump’s EOs cover the spectrum from very good policy to just horrible. I tend to favor deregulatory actions, but a recent Trump EO bearing on corporate Environmental, Social, and Governance (ESG) scores and DEI practices is a pro-market exception to typical regulatory actions. That’s basically the view expressed by Phil Gramm and Jeb Hensarling of the American Enterprise Institute. The ESG EO addresses potential fraud and conflicts of interest in the promotion of “socially responsible” shareholder initiatives and investing.
I’ve expressed my distain for corporate ESG initiatives in the past (seehere and here). The quest to earn a high ESG score is a distraction from a firm’s core mission and often a misuse of resources. Higher ESGs are associated with government subsidies, which closes the circle on the politicization of “sustainable” investing. Plumping up ESG helps firms garner more subsidies and greater subsidies help firms boost their ESG scores. These victories might be more pyrrhic for shareholders as management enlists the firm’s assets into service for government industrial policies that are often misguided.
Seedbed For Fraud
As for protecting investors from the fallout, one can argue that abuses related to ESGs belong to a class of problems best left to the market via caveat emptor. Investors might wish to earn pecuniary returns or they might wish to earn non-pecuniary returns. However, they might not always recognize the possibility of tradeoffs between the two, or the possibility that they are being scammed outright.
Unfortunately, financial decisions involve complexities that are often beyond the ken of the investing public. Their dealings with financial advisors obviously involve information and knowledge asymmetries, which underly the need for fiduciary laws and standards. ESG investing has constituted a kind of fad that has both attracted the naive and was always ripe for abuse by overeager or unethical advisors and other industry players.
Proxy advisors have been heavily involved in counseling public companies on ESG proposals brought before shareholders for votes. At the same time, these proxy advisors often engage in selling ESG metrics, which can create conflicts of interest. In particular, the EO in question seems to target two foreign-owned proxy advisors, who effectively dominate the space.
Investor Protection
The EO in question seeks protect American investors from politicized investment advice and shareholder proposals. That might sound like standard Trumpese for “I want to make my opposition illegal along with anything I don’t like”. However, there are good reasons to support this EO. I’ll get to those below, but first some quick details.
The EO instructs the SEC to review and consider revising rules, guidance and other materials relating to ESG and DEI. Scrutiny of shareholder proxy advisor recommendations is given particular emphasis. There are provisions targeting potential antitrust violations in collaborations between investment and proxy advisors. Also, there are provisions aimed at protecting pension and retirement plans from violations of fiduciary duties and obligations.
It’s hard to argue against standards of fiduciary duty. They ought to be politically neutral by their very nature. Unfortunately, the fascination with ESG metrics has made it easier to dispense poor investment advice, even for those purported to have expertise in the area. This is of greater import given that a significant share of investors have been led to believe that signals of corporate virtue are associated with superior pecuniary returns. It should be obvious that diversion of corporate resources to “social” pursuits must be scrutinized by shareholders and stock analysts. Even more troublesome are efforts that undermine productivity in the name of broad political or social objectives.
Not Objective Measures
ESG’s are by no means standardized. There are a great many vendors of ESG metrics, and they frequently disagree as to the merit of particular companies in terms of social responsibility.
Measuring the social value of particular initiatives or policies can be highly subjective, and weighted aggregations of those measurements into E, S, and G components, and combined ESG metrics, can be highly arbitrary. It’s not an exaggeration to say that the social value of certain key elements are sometimes fictitious, such as the carbon credits so often used as “offsets” by firms whose pollution is unavoidable to one extent or another. The purchase of those credits is a performative exercise that has earned the name “greenwashing”. But it’s seldom a wash. This kind of activity is a wasteful distraction and sometimes downright harmful: so-called deforestation credits might just as well be assigned a negative social value.
ESGs have also tended to reward firms adhering to DEI hiring and promotion policies. Merit takes a back seat. While diverse perspectives can add value in business contexts, HR decisions based on race, gender, or other superficial classifications are unlikely to serve shareholder pecuniary interests.
ESG Performance
Evidence on the performance of ESG funds is checkered at best. This is noted by Gramm and Hensarling, who reference an article by Sanjai Bhagat’s in the Harvard Business Review (also see this study). Bhagat reported that not only are returns on ESG funds inferior, but they fail to deliver enhanced non-pecuniary outcomes. Moreover, ESG funds often carry higher fees to investors. One study found that the willingness to pay these higher fees is driven by financial illiteracy.
A few studies seem to contradict Bhagat’s assertions, but at best the evidence is mixed. An April 2025 paper by two Dutch authors found that only changes in the E component (environmental), as opposed to changes in S and G, were positively correlated with stock returns. Those positive abnormal returns were driven by institutional investors who, despite their presumptive expertise, might be just as cowed as certain individual investors by the appearance of social virtue.
As a reality check, note that one can pick and choose among ESG vendor scores, the stock “universe”, sample periods, and estimation techniques to find positive or negative correlations between ESGs and stock returns.
As I mentioned above, the process of assigning ESG values is highly arbitrary in any case. It’s possible to engineer ESG scores in ways that essentially reward firms with high earnings for minor gestures of ostensible social value, even while ignoring less convenient consequences of a firm’s activity. Thus, the scores can be used to buttress valuations associated with high earnings while maintaining the pretense that the score is strictly about social virtue.
Conclusion
I’d be the first to defend the right of consumers to deploy their savings to political, social, or economic purposes of their choosing. However, they should do so with their eyes wide open. It would be of great benefit if the ESG community would agree to a set of measurement standards. When seeking advice from an advisor or in reading analyst reports, investors should have confidence that the information comes from sources who respect the duties of a fiduciary. In the case of ESG funds or in selecting stocks based on ESGs, investors should be aware that their pecuniary interests might be compromised.
Furthermore, analysts and firms who are in the business of selling ESG ratings should be wholly independent of proxy advisors, investment advisors, and ESG funds to avoid conflicts of interest. Unfortunately, these simple, common-sense guidelines have been neglected. As a result, I support the thrust of Trump’s EO on ESGs to reinforce the fiduciary duties of investment and proxy advisors. It would be even better if Congress could meet this challenge via legislation.
I voted for Trump because I considered him to be far preferable to Kamala Harris across a range of issues. I still feel that way, but I’m appalled at a number of actions he’s taken and/or proposed in the 14 months since he took office. As a candidate, I gave Trump a “grade point average” of about 2.68, a solid C+. Here, I’ll grade him on most of the same categories, but I’ve made a few changes to the categories based on developments since his inauguration. My perspective here is generally domestic non-intervention and small government.
Yes, I realize this is tldr; I’m sure I elaborated more than necessary, but you can skip around and scroll to sections in which you might have greater interest. Here’s a list of topics:
Role of Government
Regulation
Border Policy
Antitrust
Foreign Policy
Trade
Taxes
Inflation
Federal Reserve Independence
Federal Spending and the Deficit
Entitlement Reform
Government Waste
Health and Health Care
Abortion
Housing
Energy
First Amendment Rights
Second Amendment Rights
DEI and Its Evil Financial Twin, ESG
Technology
Voting Rights
Education
Role of Government: It’s probably unfair to treat this as a separate category because it might double count specifics mentioned later, but Trump has demonstrated an unfortunate proclivity for wielding government power over private affairs when it suits him politically. On this point, “The Conspicuous Fist of Trump’s State Corporatism”, is a good read. Trump’s actions demonstrate the awful ways in which populism is often a close cousin to socialism. An example is Trump’s economic micro-management and abrogation of property rights in attacking share buybacks. Trump boasts of his efforts to strengthen the American economy by committing public resources to investments in private enterprises, and by “doing deals” with foreign governments to invest in the U.S. When it comes to limited government, candidate Trump’s C is now President Trump’s D.
Regulation: Despite the kinds of intrusions cited above, the Trump Administration has, at the same time, aggressively pursued deregulation of private activity. The goal is to achieve a 10-to-1 ratio of rule rollbacks to new regulatory rules. One can and should assess regulatory measures one-by-one, but there are plenty of rules that wouldn’t pass a reasonable cost-benefit test. On the whole the regulatory state has grown unwieldy and imposes significant costs on producers, and ultimately taxpayers and consumers, often with little compensatory benefit. I applaud the effort to untangle the regulatory state. My grade for Trump here remains an A.
Border Policy: Despite my preference for non-intervention, I support strong border enforcement along with expanded legal immigration.
Illegal entry has plummeted under Trump, a welcome development. Uncontrolled immigration entails a loss of sovereignty and is a poor fiscal proposition. Those with deeper criminal records, from either before or after entry, deserve no concessions. Strict vetting is also necessary to prevent incursions by potential terror threats.
While illegal entry is a crime, otherwise innocent illegals should be treated kindly. For example, rewards can be offered for voluntary deportation, an approach used extensively by the Trump Administration. There are difficult issues such as birthright citizenship, the constitutionality of which has been questioned on textual grounds, and the practicality of which can be shaky, even for children of parents who enter the U.S. legally. Either way, it seems clear that the promise of birthright citizenship should not serve as an incentive for illegal entry.
The Administration has certainly fumbled immigration enforcement in some instances, with cases of improperly detained individuals. Furthermore, very little has been done to advance the cause of increased legal immigration. On this topic I give Trump an overall B-.
Antitrust: This is a case of excessive government meddling with a big dose of favoritism thrown in. Early on, the Trump Administration chose to follow in the footsteps of Biden-era antitrust enforcement with a bias toward penalizing successful businesses on the pretext of “protecting” consumers.
Even worse, the Trump Administration has used the threat of antitrust as a cudgel in pursuit of a variety of objectives that are purely political. For example, in a recent executive order (EO), Trump threatened antitrust action against companies who invest in *too many* single-family homes, a counterproductive prohibition with hoped-for appeal to populist instincts. Then, under Trump, there have been missives from the FTC to tech companies about their failure to provide “balanced” news coverage, a prerogative protected by the First Amendment.
Trump has also interfered with Netflix’s now aborted acquisition of Warner Bros., in favor of a rival offer from Paramount. Trump also engineered the coercive extraction of a U.S. government “Golden Share” in approving the merger of U.S. Steel and Nippon Steel, which Trump claims gives him “total control”, in part by controlling the number of board seats. And he basically extorted a 15% cut for the government for approving a deal allowing Nvidea and AMD to sell the older H20 chip to China.
Trump’s approach to antitrust is very much entangled with the Administration’s uninhibited embrace of industrial policy and public control over private activity. He shares a fantasy common to interventionists that he can leverage the coercive power of government to create just the outcomes he would like.
The grade here is a D, which I think is generous.
Foreign Policy: I’ll try to keep this category separate from trade and tariff issues, though they are intertwined. Trump’s approach to foreign policy is nothing if not bold, and it’s been a mixed bag in terms of success. In the western hemisphere we have the so-called “Donroe Doctrine”, Trump’s effort to establish U.S. hemispheric leadership. So far: we gained a more effective partnership with Panama over the canal and diminished China’s control; decapitated the Maduro regime in Venezuela, asserting control over its oil shipments and undercutting the flow of narcotics through the country; brought the Cuban communist regime to near collapse by choking off its oil imports (but at the cost of greater human suffering in Cuba); partnered with Mexico in eliminating the head of a major drug cartel; and developed closer ties with several conservative regimes in Central and South America.
I’m troubled by the deadly force used against vessels said to be transporting drugs. We might have great intelligence on smuggling operations, but there must be less deadly ways to interdict.
For better or worse, Trump has trolled Canadian leadership in an effort to provoke dissent and gain influence there with respect to trade and security issues. His provocative stance on Greenland is primarily motivated by concerns over security in the Arctic.
Trump’s action against the repressive Iranian theocracy, its support of terror, and its nuclear ambitions has been a military success. Unfortunately, it has come at the cost of some American lives, at least a few civilian casualties in Iran, and a considerable economic cost. We can only hope for quick resolution and a transition to a more liberal regime for the people of Iran. However, Trump was patient to a fault with the mullahs, offering them an off-ramp during repeated rounds of negotiations. They refused to take it.
Of course, Trump is also pro-Israel and has rallied a coalition of nations who might contribute to a revitalized Gaza. I give Trump huge props for his support of Israel and his disgust with anti-Semitism in general.
Trump’s involvement in negotiations between Ukraine and Russia have been unsuccessful. It’s fair to wonder whether he’s cutting Putin way too much slack, as Putin has no intention of relenting. China remains a major threat to U.S. interests and our allies, but many of Trump’s foreign policy initiatives have served to undermine CCP interests.
Trump unique approach has alienated some of our traditional European allies, though he has had success in influencing policy abroad. In Venezuela, it’s worrisome that Trump acts as if he’s cultivating a relationship with Maduro’s replacements, who are probably no better than Maduro except for their eagerness to cowtow to Trump. Well, maybe, maybe not! Also troubling is the collateral damage suffered by the people of Cuba. There are signs of a willingness among Cuban leaders to negotiate with Trump, though hopes for a friendly successor regime might be foolish.
On the whole, I’ll give Trump a B on foreign policy. It’s bold, but he’s had some real successes.
Trade: I gave Trump an F on trade policy as a candidate. He’s more than justified that grade as president. He is a complete dolt when it comes to the benefits of foreign trade, the meaning of a trade deficit, the costs inflicted by tariffs, their complete inadequacy as a replacement for the income tax, and their counterproductive effect on foreign investment in the U.S. His “emergency” tariffs constituted a huge tax increase on the American people, but those were ruled unconstitutional by the Supreme Court. His latest ploy is to impose punitive tariffs under the guise of a balance of payments emergency, but the balance of payments is zero! This too will be struck down in the courts.
Some might argue that Trump’s other foreign policy achievements would not have been possible without the threat of tariffs, but the fact is Trump imposed the tariffs anyway. Yup, it’s an F.
Taxes: In terms of budget effects, the increased tariff revenue (which might not last at present levels) is much more than offset by tax provisions in the One Big Beautiful Bill Act (OBBBA) passed into law last summer. It makes permanent many of the reductions in the Tax Cuts and Jobs Act of 2017 that had been ready to expire. The standard deduction is increased and more limits are placed on itemization. The Act also creates targeted (and temporary) deductions for tips, overtime, auto loans, and seniors, which is inefficient because it treats various forms of income differently, leading to incentives for unproductive reallocations. Those changes also smack of political pandering.
The OBBBA makes permanent some tax incentives for business, such as immediate expensing of short-term asset purchases and domestic R&D investment. It also provides a temporary 100 percent deduction for certain structures and phases out tax credits for green energy production (bravo!).
To the extent that the tax package includes some pro-growth elements, I applaud it. Tax reductions generally are a good thing because they reduce distortions, but Trump has managed to introduce several distortionary elements just the same. I won’t dock Trump for deficit effects here because the deficit is fundamentally a spending problem, not a tax problem. I gave him a C+ on taxes as a candidate, but I’ll boost him to a B- for his first year.
Inflation: Trump doesn’t have real control over inflation as economists define it, but he’s managed to aggravate some price increases just the same. Unfortunately, he makes repeated claims that “prices have fallen” under his leadership, which of course is false. Egg prices perhaps, and oil prices (er… not this month). Of course, in general prices are up, including import prices. Inflation measures have been fairly steady over the past year, but remain stubbornly higher than the Federal Reserve’s target. I give Trump a grade on this topic only because he deserves a penalty for his false boasts. It’s a C, the same as candidate Trump.
Federal Reserve Independence: Trump has relentlessly badgered Jerome Powell and the Fed to somehow engineer lower interest rates. Of course, many key interest rates are market driven and outside the Fed’s direct control. Trump has gone so far as to bring lawfare to bear against Powell, accusing him of misleading Congress regarding cost overruns on the renovation of the Fed’s offices in DC. Of course, it’s not unusual for a president to jawbone the Fed, but Trump has been absurdly aggressive at a time when reducing the Fed’s rate targets would quite possibly backfire. At least Trump’s selection of the next Fed Chairman, Kevin Warsh, was more reasonable than another top candidate who would probably have been a mere punching bag. For this, I’ll lift his grade slightly, from an F to a D-.
Federal Spending and the Deficit: I discuss a few components of spending under other headings below. Beyond those points, Trump has taken every opportunity to find creative uses for taxpayer money. He has proposed a “tariff dividend” for all households funded by the revenue from import taxes. (Refunds of tariff revenue to “payers” are still in question.) At this point, the better alternative is to put extra revenue toward paying down the federal debt. The same goes for any revenue earned from the many “deals” Trump is counting on. Pay down the debt and earn an immediate, certain, and lasting return, rather than installing the government as part owner of otherwise private enterprises having uncertain returns.
Apart from that and the folly of establishing a sovereign wealth fund while the public debt is burgeoning, Trump has made no progress whatsoever on deficit reduction. Granted, he can’t count on strong legislative support despite slight majorities in both chambers of Congress.
The tax cuts in the OBBBA obviously don’t help the cause of deficit reduction. In fairness, rebuilding the military is a major priority. However, interests costs on the debt will keep rising as will discretionary non-defense outlays. At least the East-Wing Ballroom, the Arc de Trump (!), and the Kennedy Center renovation all appear to be privately funded.
Trump deserves a D here. Some of his priorities are terrible, and I can’t cut him any slack based on trends in discretionary spending.
Entitlement Reform: Trump has been silent on reforms to Social Security’s “Old Age and Survivors” programs and Medicare, except to promise no cuts in benefits under his watch. Kick the can! However, the administration has considered cuts in other entitlements, such as Social Security Disability Insurance, Medicaid and Supplemental Nutrition Assistance (SNAP). These programs have been riddled with fraud, so I applaud steps to clean them up. Nevertheless, any progress made here will still be dwarfed by the insolvency of the Retirement and Medicare programs, which Trump considers a third rail for potential reformers. I gave him an F as a candidate, but his anti-fraud efforts help him salvage a C-.
Government Waste: DOGE was short-lived as originally constituted, its execution was clumsy, and the blow-up in Trump’s relationship with Elon Musk was an embarrassment. However, DOGE was a force for stanching the flow of taxpayer dollars through politicized NGOs. The budget savings were relatively small, but the defunded programs were often egregious varieties of government waste. Subsequently, DOGE personnel had an outsized influence on downsizing the federal bureaucracy and targeting waste across various agencies. In addition, the efforts of one-time DOGE workers were put to good use in identifying entitlement fraud, which could and should result in budget savings. Trump gets a B+ on this one.
Health and Health Care: I’ll give Trump credit here for pursuing a more consumer-oriented approach to health care reform, though at least one of his initiatives is counterproductive.
His initial steps took the form of EOs reducing subsidies paid on ACA marketplace policies, ending remaining penalties for violating the ACA’s individual mandate, approving short-term coverages free of certain ACA restrictions, cutting Medicaid expansion funding, and granting more flexibility for states in defining “essential” healthcare benefits. All of these are basically good steps.
Trump issued an ill-conceived EO calling for “Most-Favored Nation” (MFN) prescription drug pricing, which should reduce Americans’ prescription costs but will dramatically undercut life-saving drug research. Hate the pharmaceutical companies all you want, but they must earn a reasonable profit to risk the massive development costs of new miracle drugs, of which they’ve brought many to market. Price controls always create more problems than they solve.
In early 2026 Trump introduced his “Great Healthcare Plan” (GHP). It would codify MFN drug pricing, fund cost-sharing reductions for ACA plans, encourage price transparency, and redirect payments to consumers and away from insurers to facilitate choice and competition. Also launched was the TrumpRx.gov platform featuring MFN pricing. Ironically, the goal here is to improve access to prescription drugs. Good luck!
Under Robert F. Kennedy, Jr., Trump’s HHS Secretary, the “Make America Healthy Again” agenda has emphasized a healthy diet and exercise, including noteworthy changes in the famous food triangle hierarchy. I can’t argue with those. However, RFK Jr. has upended research under HHS, and those actions were rash in a number cases. He wants to address chronic diseases but I’m skeptical of some of his causal claims. I also have mixed reactions to his changed guidance on vaccines. There are reports that the White House has not been comfortable with all of RFK’s pronouncements and is eager to inject more oversight.
I have varied reactions to Trump’s efforts in the health care arena. MFN price capping is a good way to destroy the advantages Americans enjoy in terms of access to innovative drugs, even if they come at a steep cost. RFK Jr. is a wild card, to be fair. Otherwise, while the GHP should help to improve healthcare affordability, it neglects other critical reforms such as ending the disparate tax treatment of health care premiums and deregulating providers. Still, Trump’s grade improved here, from a D+ as a candidate to a B- thus far in his term.
Abortion: No change here. Trump has consistently supported the right to life. He gets an A.
Housing: Build Baby Build! But aside from harping on the Fed to lower interest rates, Trump hasn’t done much to encourage housing supply.
His EO banning institutional investors from owning “too many” single-family homes won’t help affordability because so few homes are owned by large investors. But to the extent that they are, the EO will increase rents and discourage new housing supply. This is another misguided foray into central economic planning.
While I think a 50-year mortgage should be legal, it’s something I believe potential homebuyers should avoid unless they want to risk stubbornly low equity in their homes stretching into retirement. Trump shouldn’t talk this up too much.
Trump has supported the “ROAD to Housing” bill, which has garnered bipartisan support. It would codify the restrictions on ownership of single-family housing by institutional investors and restrict construction of “rent-to-own” housing by such investors. One couldn’t invent a less effective way to encourage supply and promote “affordability”. But the bill would also subsidize demand, which will increase pressure on housing prices even as the bill aims to assist particular groups (e.g., tax credits for first-time homebuyers). Despite all those downsides, the bill actually includes a few steps to boost housing supply, such as making some federal lands available for development, regulatory reform, and tax incentives for builders.
Trump has also discussed changes to government sponsored enterprises (GSEs, Fannie Mae and Freddie Mac), which purchase new mortgages from lenders, including possible privatization. He might be licking his chops for the $300 billion the GSEs owe the federal government, which could be put toward various “deals” he might like to cut. If privatization were to end the explicit government guarantee for mortgage-backed securities issued by the GSEs, mortgage interest rates would rise and it could be quite disruptive for banks.
Housing policy is another mixed bag for Trump, but I’ll give him a B on the strength of his deregulatory effort.
Energy: Drill baby drill! Despite the current disruption to oil shipments through the straight of Hormuz and the spike in oil prices, I deem Trump’s energy policies a success thus far. Largely through deregulation, Trump has opened up the spigots on domestic oil production. He has also realigned energy priorities, eliminating subsidies and mandates for intermittent renewable energy sources in favor of encouraging fossil fuels, hydroelectric, and especially a new emphasis on nuclear power. Some of these steps represent unabashed central planning, so I can’t give Trump an A on energy policy,. However, the preceding green-energy regime was central planning on steroids with the unintended consequence of instability in the power grid. I would greatly prefer a policy of complete neutrality with respect to energy sources, but at least Trump is not cowed by global warming hysteria.
And Trump is considering a temporary suspension of the Jones Act due to the energy crunch brought on by the war in Iran. That would be great except that the waiver should be permanent. The move would lower energy (and other) costs to U.S. consumers and minimize supply disruptions by allowing energy (and other goods) to flow more freely between U.S. ports.
His grade on energy policy is a B.
First Amendment Rights: Trump has not been the defender of free speech that I had hoped. On this, I gave him an A- as a candidate, but his Administration has been belligerent in attacking speech. He (and his FCC Chairman) threaten media outlets with license revocation, his Attorney General says “we will target you” for anything DOJ attorneys might define as hate speech, and Trump has called certain speech he dislikes “illegal”. I also have qualms about an EO issued last year by Trump targeting “campaigns of … radicalization”, which might, in practice, bring any sort of opposition speech under scrutiny. And there are other potentially troublesome provisions for protected speech. Trump’s pure intent might be to stop violent radicalism, which is fine in spirit but hard to bring off without mass surveillance and violations of rights. I therefore downgrade Trump to a C on free speech.
Second Amendment Rights: Trump has not been quite as consistent on gun rights as he was as a candidate. He took a number of actions to reduce burdens and restrictions on gun rights, but in other cases he let restrictions stand, including arrests for gun possession in Washington DC by federal agents and a possible proposal to restrict the gun rights of transgendered individuals. All-in-all, I’ll reduce Trump’s A on gun rights to a B+.
DEI and Its Evil Financial Twin, ESG: There is no question that Trump has done much to cut through the stranglehold that DEI doctrine had imposed on social and economic life. He issued EOs to end DEI practices in the federal government. He also threatened major universities with funding freezes and anti-discrimation actions, an approach that has met with some success. Trump’s words and actions on DEI have reverberated through the private sector as well. He has encouraged individuals who believe they’ve suffered discrimination based on DEI to file lawsuits. The thrust of the Administration’s agenda on DEI and regulatory changes has served to undermine the use of ESG measures. These are intended to draw investors to companies purporting to foster environmental and social goals, which can be at odds with creating value for shareholders. Trump has earned his A in this category.
Technology: As in other policy domains, the record here is marred by misguided industrial policies. That includes the recent snafu over the Department of Defense’s allegation of “supply chain risk” posed by Anthropic. DoD wants carte blanche access to all aspects of any AI model it adopts, including uses in autonomous weapons systems and mass public surveillance. Anthropic said it would not accept that without guardrails, so an apparently infuriated Pete Hegseth moved to designate the company a supply chain risk, an outright punishment that would obviously damage Anthropic’s economic prospects. Yet almost immediately, DoD agreed to an arrangement with OpenAI with guardrails similar to those desired by Anthropic. Now, Trump, who seems to have Hegseth’s back, is readying an EO on the topic… so we shall see. But it’s a mess. Anthropic has filed suit.
And yet Trump has generally been supportive of AI development, signing an order to prevent states from imposing a patchwork of varying, complex regulations. The White House has issued an ”AI Action Plan” to encourage AI exports, minimizing federal regulatory burdens, and “upholding free speech” on “unbiased” frontier models. Let’s hope “unbiased” has a truly neutral definition in this case. Trump has signed a series of EOs related to AI research and deployment, which are linked here.
Post-inauguration, Trump dove right into another socialist joint venture known as Stargate to build data center infrastructure. The rationale for the government’s direct involvement is national security. Of course, that’s the Administration’s rough and ready excuse for almost any kind of intervention.
Trump has helped promote the crypto industry, supporting legislation (the CLARITY Act and the GENIUS Act) enabling more widespread use of stablecoins. He even supports the payment of returns on stablecoins, a development that is unpopular with banks. Trump has also acted to promote cybersecurity and harden infrastructure against malicious actors. More recently, he initiated a program to test eVTOL technologies (electronic vertical takeoff and landing), which are expected to revolutionize local and regional transportation in coming years.
The best I can give Trump on technology is a B-, given his penchant for government control. The Anthropic controversy is a real black eye.
Voting Rights: The Trump-backed SAVE America Act would require an ID proving citizenship to vote in federal elections. It’s stalled in the Senate, seven votes short of the 60 needed to send it to Trump’s desk. GOP senators are unwilling to force a talking filibuster, let alone to use the so-called “nuclear option” to force a simple-majority vote. There is still a possibility of including a voter ID requirement in a budget reconciliation bill if anyone can convince the Senate Parliamentarian that it would have budget impacts. For his part, Trump says he’ll refuse to sign any other legislation until the SAVE Act crosses his desk, though he’s also threatened to issue an EO mandating voter ID should the Senate fail to pass the bill. The constitutionality of such an order would be challenged, of course, but for his determination on the issue, I’ll give him an A+.
Education: This is a quick addition to the list. After inserting the photo of Trump at the top, I realized that I’d completely forgotten to add education as a performance category. Trump’s effort to dismantle the wasteful and unproductive Department of Education is to be applauded. He’s also been an unwavering supporter of school choice. I’ll give him an A here.
I have to stop! That’s 22 categories and a “grade point average” of 2.55 if the categories are equally weighted. It’s a little worse than Trump’s GPA as a candidate (2.67). He could have improved his grades dramatically without his bent for economic intervention, but I’d have to vote for him again given the alternative.
Kevin Warsh has been nominated by President Trump as the next Chairman of the Federal Reserve Board. He’d step into the role in May if confirmed by the Senate. Warsh has served on the Board before, from 2006-2011. During that tenure, he was basically opposed to quantitative easing and expansion of the Fed’s balance sheet, though he voted for QE1 in 2010 in deference to then-Chairman Ben Bernanke, while offering a dissenting opinion.
A Chairman Warsh would have allies some at the Fed, but whatever direction he might prefer for policy, it’s not clear that he can or would swing policy decisions. The Board of Governors has seven members, not all of whom would ally with Warsh, while the Federal Open Market Committee (FOMC), the main policy-setting arm of the Fed, has 12 voting members. And the influential Fed staff might offer resistance to Warsh’s views. Nevertheless, it’s worth asking how his views would take shape as Fed policy if they held sway.
Warsh has said the Fed’s balance sheet should shrink and that the Fed should reduce its target rate for the federal funds rate. Of course, the latter aligns with Trump’s exhortations. Sharply lower rates are desired by the Administration as a tonic for consumers and businesses. Furthermore, reducing the federal government’s interest costs on the public debt would bring a meaningful reduction in the deficit, or at least give Trump room for new spending initiatives.
Some might wonder whether shrinking the Fed’s balance sheet — selling securities to the public — is consistent with an effort to reduce rates. After all, selling securities on the open market by the Fed is usually associated with higher rates and tighter monetary policy. When the Fed’s balance sheet shrinks, we call it quantitative tightening. And yet Warsh calls for lower rates.
Whether you agree with either of the Warsh objectives, their combination can at least be reconciled. A sharp reduction or prohibition on interest paid by the Fed to banks on their reserves (IOR) would go hand-in-hand with other steps by the Fed to reduce short-term interest rates. Eliminating or reducing the rate earned on reserves would create an incentive for banks to purchase the assets that Warsh would have the Fed divest from its balance sheet. That would also have to be accompanied by the reestablishment of minimum reserve requirements for banks.
Of course, bank incentives matter only to the extent that regulations don’t stand in the way. Currently, bank regulations penalize large banks for investing in Treasuries, despite minimal risk. So-called Supplementary Leverage Ratio (SLR) rules require large banks to hold from 3% up to 6% capital against all assets on their balance sheets. In addition, long-term Treasury securities held by banks can trigger flags for rate-risk exposure, and mark-to-market rules might lead to adverse fluctuations in bank regulatory capital.
Warsh has been a critic of expansive bank regulation by the Fed. It’s likely that he would support Vice Chairwoman Michelle Bowman’s push for deregulation, and would be in the same corner on that point as Treasury Secretary Scott Bessent. New rules would take time to promulgate and implement, but surely Warsh recognizes that shrinking the Fed’s $6.5 trillion portfolio would have to be a protracted affair in any case. In fact, an effort to reduce the Fed’s balance sheet in 2019 was halted after liquidity became a concern in the repurchase market.
For perspective on the $6.5 trillion portfolio, private U.S. commercial banks currently hold about $25 trillion in assets, but total bank reserves at the Fed are almost $3 trillion, including reserves held by foreign banks. This limits the extent to which the Fed’s balance sheet can be drawn down via uptake by commercial banks.
A potential switch by the Fed from ensuring “ample reserves” to a system of “scarce reserves” sets off alarm bells among many Fed watchers and within the Fed itself. Resistance to the change is based in part on the need for adequate “backstops” to ensure the safety of the banking system under scarce reserves. In this connection, there always were backstops under scarce reserves, including a well-functioning market for overnight loans of reserves between banks (federal funds) as well as the Fed’s own Discount Window, which it operates as lender of last resort. Most importantly, a steady and reliable policy course would minimize economic and financial disruptions and therefore the need for extraordinary measures. Beyond that, in times of volatility or financial stress it’s necessary to take a longer perspective on asset valuation, rather than relying too heavily on short-term market fluctuations, before leaning into “too big to fail” solutions. In fact, Warsh has said the following:
“The Fed, as first-responder, must strongly resist the temptation to be the ultimate rescuer.
And this:
“The Federal Reserve is not a repair shop for broken fiscal, trade or regulatory policies.“
Would this approach, steadily shrinking the Fed’s balance sheet while scaling back IOR, succeed in reducing key interest rates? It could reduce some consumer and business loan rates that are indexed to the fed funds rate or to the prime rate. Long-term rates are another story, as they are governed by fundamentals like expectations of economic growth and inflation. But beyond the evolution of the balance sheet, the rate of IOR, the fed funds rate, and bank reserves, there are measures of greater interest to the full thrust of monetary policy: the rate of growth of the money supply relative to nominal aggregates like GDP.
Warsh has been described as a “inflation hawk”, and has described himself as a “student of Milton Friedman”. That should assuage any fears that a “Warsh Fed” would be inclined to monetary activism for economic or political reasons.
What Trump might want and what Warsh, as Fed Chairman, is willing or able to do are two different things. Trump has loudly called for an immediate cut in the fed funds rate of 100 basis points or more, which is not going to happen. Such a large cut in the target rate (and IOR) would alarm markets, particularly without firmly establishing the Fed’s intentions for both its inflation (or other) target and the transition to a new reserve/balance sheet regime. In fact, any future policy actions should be predicated on inflation and other economic data.
But who knows? Warsh has said that the proliferation of AI will engender massive gains in productivity, which would be a deflationary force. We can only hope! Perhaps that would provide all the rationale Warsh needs for expansionary monetary policy… a smaller balance sheet with rate cuts and non-inflationary money growth.
There have been comments from Warsh and Treasury Secretary Scott Bessent that the Fed can reach some kind of new “accord” with the Treasury with respect to the Fed’s balance sheet and debt issuance. It’s not clear what this might entail, but it could be a simple matter of clearly outlining plans to level-set market expectations. The Fed has reduced the average maturity of its Treasury debt holdings. Perhaps Bessent can persuade Warsh and the Fed to lengthen maturities as the Fed’s portfolio runs off. But there are other avenues for a possible accord, such as guides for action on the provision of liquidity by the Fed, regulatory matters, and bounds around interventions that might influence debt issuance.
Here are a few bullet points to summarize the Warsh policy scenario I outlined above:
Shrink the Fed’s balance sheet
End the ample reserves regime
Reduce or eliminate interest on bank reserves
Deregulate bank balance sheets
Guide rates lower and provide monetary accommodation for productivity growth
That’s a lot for a new Fed Chair to bring together. Events might conspire to prevent some of those steps, but that’s stab at a Warsh roadmap for monetary policy.
I’m an AI enthusiast, and while I have econometric experience and some knowledge of machine learning techniques, I’m really just a user — I really lack deep technical expertise in the area of AI. However, I use it frequently for research related to my hobbies and to navigate the kinds of practical issues we all encounter day-to-day. With one good question, AI can transform what used to require a series of groping web searches into a much more efficient process and informative result. In small ways like this and in much greater ways, AI will bring dramatically improved levels of productivity and prosperity to the human race.
Still, the fear that AI will be catastrophic for human workers is widely accepted. Some claim it’s already happening in the workplace, but the evidence is thin (and see here and here). While it’s certain that some workers will be displaced from their jobs by AI, ultimately new opportunities (and some old ones) will be available.
I’ve written several posts (here, here, here, and here) in which I asserted that a pair of phenomena would ensure continuing employment opportunities for humans in the presence of AI: an ongoing scarcity of resources relative to human wants, and the principle of comparative advantage. Unfortunately, the case I’ve made for the latter was flawed in one critical way: reciprocal comparative advantages across different factors of production are not guaranteed. In trade relationships, trading partners have reciprocal cost advantages with respect to the goods they exchange, and I extended the same principle to factors of production in different sectors. Unfortunately, that analogy with trade does not always hold up, in part because the owners of productive inputs don’t fully engage in direct trade with one another.
Thus, so-called reciprocity of opportunity costs cannot guarantee future employment for humans in a world with AI-augmented capital. Nevertheless, there is a strong case that reciprocity of comparative advantages will exist, whether labor and capital are (less than perfect) complements or substitutes. This is likely to hold up even though human labor and AI-augmented capital could well become more substitutable in the future.
Below, I’ll start by reviewing the principles of scarcity, opportunity costs, and input selection. Then I’ll turn to a couple of other rationales for a more sanguine outlook for human jobs in a world with widely dispersed AI in production. Finally, I’ll provide more detail on whether reciprocal input opportunity costs are likely to exist in a world with AI-augmented capital, and the implications for continued human employment.
Scarcity and Advantages
Scarcity must exist for a resource to carry a positive price. That price is itself a measure of the resource’s degree of scarcity as determined by both demand and supply. And ultimately an input’s price reflects its opportunity cost, or the reward foregone on its next-best use.
Labor and capital are both scarce inputs. Successful integration of AI into the capital stock will make capital more productive, but it will not eliminate the fundamental scarcity of capital. There will always be more use cases than available capital, and particular uses will always have positive opportunity costs.
If capital is more productive than labor in a particular use, then capital has an absolute advantage over labor in that line of production. If capital and labor are perfect substitutes in producing good X, then capital can be substituted for labor at a constant rate, say 1 unit of capital for every 2 units of labor, in a straight line without any change in output.
One might expect the producer in this scenario to choose to employ only capital in production. That’s the general argument put forward by AI pessimists. They appeal to a presumed, future absolute advantage of AI (or AI combined with robotics) in each and every line of production. In fact, the pessimists treat the AI robots of the future as perfect substitutes for labor. That’s not a foregone conclusion, however, and even if it were, absolute advantages are not reliable guides to economic decision-making.
Physical tradeoffs in a line of production are one thing, but opportunity costs are another, as they depend on rewards in other lines of production. In the example above, if a unit of capital costs slightly less than two units of labor, then it would indeed be rational to employ all capital and zero labor in producing good X. Then, capital has not just an absolute advantage in X, but also a sufficient cost advantage over labor (or else labor would be more highly valued elsewhere). In this example, the labor share of income from producing X is zero. The capital share is 100%.
Income Shares
The simple case just described is the same as the one examined by Brian Albrecht in his recent analysis of “Capital In the 22nd Century”, an essay by Philip Trammell and Dwarkesh Patel. The controversial conclusion in the latter essay is that capital taxation will be necessary in a world of strong AI, because labor’s share of income will approach zero.
Albrecht is rightfully skeptical. He examines the case of capital and labor as perfect substitutes, as above, and the “corner solution” with all capital and no labor in production.
Albrecht notes that empirical estimates show that capital and labor are not even close to perfect substitutes. In fact, on an economy-wide basis, capital and labor have a fairly high degree of complementarity. But this varies across sectors, and Albrecht acknowledges that substitutability might increase in a world of strong AI.
Albrecht covers a second avenue through which AI-augmented capital could displace labor: rapid growth in the capital stock fueled by stubbornly high returns to capital. While Albrecht’s main interest is in whether capital taxation will one day be necessary, his analysis is obviously a useful reference for thinking about whether labor will be completely displaced by AI-augmented capital.
Again, capital is a scarce resource. For it to grow unbounded in AI-augmented forms, its real yield (and marginal product) must always and forever resist diminishing returns while also exceeding rates of time preference. It also must stay ahead of depreciation on an ever-expanding stock of existing capital. Albrecht is of the opinion that AI-augmented capital might be especially prone to rapid obsolescence. For that matter, it remains to be seen whether the many moving parts of humanoid robots will be highly vulnerable to wear and tear in the field. Perhaps the use of AI in materials research and robotics design can ease those physical constraints.
There are other obstacles to complete AI dominance in the labor market. Institutions of almost all kinds will always face AI deployment risks. On this point, an interesting piece is “Persuasion of Humans Is the Bottleneck”. The author, Erik Schiskin, says that in addition to investment in physical capital:
“AI deployment is capital-intensive in a different way: admissibility—what institutions can rely on, defend, insure, audit, and appeal without taking unbounded tail risk.“
Of course, this too increases the cost of AI deployment.
A “One-Good” Analysis Is Inadequate
Albrecht essentially confines his analysis of inputs and incomes shares to a world in which thee is only one kind of final output, and yet he makes the following assertion:
“Remember this is a model of the whole economy, so that would mean there’s not a single thing produced that humans have a comparative advantage.“
That kind of aggregation is not possible in a world with comparative advantages, however. A mental model with only one good cannot describe a world with opportunity costs. Capital and labor are both scarce resources. Their alternate uses cannot be buried within a single aggregation without appealing to the “idle state” as an alternative use.
With more than one good, the opportunity cost of using an addition unit of capital to produce good X is what must be foregone when that unit of capital is not deployed to its next-best use producing some other good.
And to return to our earlier example, if capital is the exclusive input to the production of Good X, that’s because 1) capital is perfectly substitutable for labor in that line of production; 2) capital is more productive than labor in producing good X; and 3) capital’s relative cost for producing good X is sufficiently low to favor its use.
Factor Intensities
Now I’ll revisit my earlier rationale that for labor’s continuing role in a world with AI-augmented capital. I began to have doubts abouthowinput substitutability might play out as AI is deployed (see other views here and here, as well as Albrecht’s post). So I enlisted the assistance of two AI tools, Grok and ChatGPT, to help identify relevant economic literature bearing on the durability of the “reciprocity” phenomenon given a technical shock. There were differences in the conclusions of the two AI tools when certain embedded assumptions were overlooked or not initially made plain. Considerable push-back against these analyses by yours truly helped to align the conclusions. I’ll be skipping over lots of gory details, but I’d welcome any and all feedback from readers with insight into the issues, or with deeper knowledge of this type of economic research.
Reciprocal input opportunity costs (and comparative advantages) depend on parameters that help determine factor intensity and income shares. A paper by Ronald W. Jones in 1965 helped delineate conditions that preserve the relative rankings of factor intensities across sectors in a closed economy. Those conditions can be extended to the context of reciprocal input opportunity costs. I’ll briefly discuss those conditions in the next couple of sections.
For now, it’s adequate to say that when capital’s comparative advantage in one sector is offset to some degree by a reciprocal comparative advantage for labor in another, we need not conclude that human labor will become obsolete given a positive shock to the productivity of capital. Again, however, in earlier posts I mistakenly asserted that this kind of reciprocity was a more general phenomenon. It is not, and I should have known that. That said, the specifics of the conditions are of interest in the context of AI-augmented capital.
Non-Reciprocity
First, let’s cover cases that are the least conducive to reciprocal opportunity costs: when capital and labor are perfect substitutes in the production of all goods, and when they are perfect complements in the production of all goods. While there are many cases in which inputs are used in fixed proportions in the short run, or where one input can easily be substituted for another in a particular task, it’s still safe to say we don’t generally live in either of those worlds. Nevertheless, they are instructive to consider as extreme cases.
The case of perfect substitutes was discussed above in connection with Albrecht’s post. Then cost minimization yields corner solutions involving 100% capital and zero labor for both goods if capital is everywhere more productive (relative to its cost) than labor. There is no reciprocity of input opportunity costs across goods except by coincidence, and labor will be unemployed.
The other case certain to have non-reciprocal opportunity costs (except by coincidence) is when capital and labor are perfect complements. Then, the rigidity of resource pairings lead to indeterminate input prices and an inability to absorb unemployed resources. However, note that if perfect complementarity were to persist under strong AI, as unlikely as that seems, it would not lead to a capital share of 100%.
A Paradox of Substitutability
Now I turn to more plausible ranges of substitutabilty. There’s a notion that capital with AI enhancements will become more substitutable for labor than it has been historically. And if that’s the case, there’s a fear that humans will be out of work and produce a zero labor share of income. This same line of thinking holds that future prospects for human employment and labor income are better if capital and labor remain somewhat complementary.
That framing of the future of work and its dependence on complementarity vs. substitutability is fairly intuitive. Paradoxically, however, a higher degree of substitutability might not have any impact on human comparative advantages, or might even strengthen them, as long as the elasticity of substitution is not highly asymmetric across sectors.
The Ronald Jones paper referenced above shows that under certain conditions, factor intensities for different goods will retain their relative rankings after a shock to factor prices or technology. By implication, comparative advantages will be preserved as well. So if capital has a greater intensity in producing X than in producing Y, that ranking must preserved after a shock if capital and labor are to retain their reciprocal comparative advantages. Jones shows this is satisfied when the inputs in both sectors are equally substitutable, or when changes in substitutability across sectors are equal. If those changes are not greatly different, then reversals in factor intensity are unlikely and reciprocity is usually preserved. Therefore, if augmenting capital with AI increases the elasticity of substitutability between capital and labor broadly, there is a good chance that many reciprocal comparative advantages will be preserved.
Another general guide implied by the Jones paper is that factor intensities and reciprocal comparative advantages are more likely to be preserved when production technologies differ, input proportions are stable, and differences in substitutability are similar or differ only moderately.
Empirically, elasticities of substitution between capital and labor vary across industries but are typically well within a range of complementarity (0.3 to 0.7). Starting from these positions, and given increases in substitutability via AI-augmented capital, factor proportions aren’t likely to change drastically, and rankings of capital intensity aren’t likely to be altered greatly, thus preserving comparative advantages for most sectors.
Restatingthe Last Section
Starting from a world in which inputs have reciprocal comparative advantages (and reciprocal opportunity costs), a technological advance like the augmentation of capital via AI might or might not preserve reciprocity. The return on capital will increase, and widespread capital deepening is likely to drive up the rental rate of a unit of capital relative to its higher marginal product. If capital intensities increase in all sectors, but relative rankings of capital intensities are preserved, then labor will retain comparative advantages despite the possible absolute advantages of AI-augmented capital. Labor’s share of income will certainly not fall to zero.
If the substitutability of capital and labor increase, ongoing reciprocity can be preserved if the change in substitutability does not differ greatly across sectors. This is true even for large, but broad, increases in substitutability. However, should large increases in substitutability be concentrated to some sectors but not others, reciprocity could fail more broadly. If greater substitutability implies greater dispersion in substitutabilities, then reciprocity is likely to be less stable.
Of course, regardless of the considerations above, there are certain to disruptions in the labor market. Classes of workers will be forced to leverage AI themselves, find new occupations, or reprice their services. Nevertheless, once the dynamics have played out, labor will still have a significant role in production.
Recapping the Whole Post
Here are a few things we know:
Capital will remain scarce, even more so if its return reaches impressive heights via AI augmentation. Another way of saying this is that interest rates would have to rise in order to induce saving. Depreciation and obsolescence of capital will reinforce that scarcity, and there are now and always will be too many valued uses for capital to become a free good.
Capital and labor are not perfect substitutes in most tasks and probably won’t be, even given strong AI-augmentation.
Capital and labor are not perfect complements, though they have been complementary historically. Their complementarity might well be moderated by AI.
Besides capital scarcity, there will be a continuing series of bottlenecks to AI deployment, some of which will demand human involvement.
We start our transition to a world of AI-augmented capital with different inputs having comparative advantages in producing some goods and not others. In general, at the outset, there is a reciprocity of input comparative advantages and opportunity costs across sectors, much as reciprocal opportunity costs exist in cross-country trade relationships.
A technological shock like the introduction of strong AI will alter these relationships. However, as long as factor intensities in different sectors maintain their rank ordering, reciprocal opportunity costs will still exist.
If substitutability increases with the introduction of AI-augmented capital, reciprocal opportunity costs will be preserved as long as the changes in the degree of substitutability do not differ greatly across sectors.
My earlier contention that reciprocal opportunity costs were the rule was incorrect. However, it’s safe to say that reciprocity will persist to one degree or another, even if more weakly, as the transition to AI goes forward. That means labor will still have a role in production, despite many areas in which AI-augmented capital will have an absolute advantage. And we haven’t even discussed preferences for “the human touch” and the likelihood that AI will spawn new opportunities for human labor as yet unimagined.
This topic flared up in 2025, with legislation proposing to end the Federal Reserve’s payment of interest on bank reserves (IOR). The bills have not yet advanced in Congress, however. As a preliminary on IOR and its broader implications, consider two hypotheticals:
First, imagine banks that take deposits, make loans, and invest in assets like government securities (i.e., Treasury debt). Banks are required to hold some percentage of reserves against their deposits at the central bank (the Fed), but the reserves earn nothing.
Now consider a world in which the Fed pays banks a risk-free interest rate on reserves. Banks will opt to hold plentiful reserves and relatively less in Treasuries. But in this scenario, the Fed itself holds large amounts of Treasuries and other securities, earns interest, and in turn pays interest to banks on their reserves.
The first scenario held sway in the U.S. until 2008, when Congress authorized the Fed to pay IOR. Since that time, we’ve had the second scenario: the IOR monetary order.
Socialized Risk
The central bank can basically print money, so there is no danger that banks won’t be paid IOR, despite some risk inherent in assets held by the Fed in its portfolio. While the rate paid on reserves can change, and banks are paid IOR every 14 days, they do not face the rate risk (and a modicum of default risk) inherent in holding Treasuries and mortgage securities, which have varying maturities. Instead, the Fed and ultimately taxpayers shoulder that risk, despite the Fed’s assurances that any portfolio losses and negative net interest income are economically irrelevant. These risks have been socialized, so we now share them.
This means that an essential function of the banking system, assessing and rationally pricing risks associated with certain assets, has been nationalized. It is a suspension of the market mechanism and an invitation to misallocated capital. Why bother to critically assess the risks inherent in assets if the Fed is happy to take them off your hands, possibly at a small premium, and then pay you a risk-free return on your cash to boot.
Bank Subsidies
IOR is a subsidy to banks. They get a return with zero risk, while taxpayers provide a funding bridge for any losses on the Fed’s holdings of securities on its balance sheet or any shortfall in the Fed’s net interest income. Banks, however, can’t lose money on their ample reserves.
The subsidy may come at a greater cost to some banks than others. This regime has been accompanied by significantly more regulation of bank balance sheets, such as capital and liquidity requirements (Basel III and Dodd-Frank). Not only is IOR a significant step toward nationalizing banks, but the attendant regulatory regime tends to favor large banks.
On the other hand, zero IOR with a positive reserve requirement amounts to a tax on banks, which is ultimately paid by bank customers. Allowing banks to hold zero reserves is out of the question, so we could view the implicit reserve-requirement tax as a cost of achieving some monetary stability and promoting safer depository institutions.
Quantitative Easing
Again, the advent of IOR created an incentive for banks to hold more reserves and relatively less in Treasuries and other assets (even some loans). Rather than “scarce reserves”, banks were encouraged by IOR to hold “ample reserves”. Of course, this is thought to promote stability and a safer banking system, but as Scott Sumner notes, it represents a contractionary policy owing to the increase in the demand for base money (reserves) by banks.
The Fed took up the slack in the debt markets, buying mortgage-backed securities and Treasuries for its own portfolio in large amounts. That kind of expansion in the Fed’s balance sheet is called quantitative easing (QE). which adds to the money supply as the Fed pays for the assets.
QE helped to neutralize the contractionary effect of IOR. And QE itself can be neutralized by other measures, including regulations governing bank capital and liquidity levels.
Fed Balance Sheet Policies
QE can’t go on forever… or can it? Perhaps no more than expanding federal deficits can go on forever! The Fed’s balance sheet topped out in 2022 at about $9 trillion. It stood at just over $6.5 trillion in November 2025.
Quantitative tightening (QT) occurs when the Fed sells assets or allows run-off in its portfolio as securities mature. Nevertheless, the Fed’s mere act of holding large amounts of debt securities (whether accompanied by QE, QT, or stasis) is essentially part of the ample reserves/IOR monetary regime: without it, the demand for debt securities would be undercut (because banks get a sweeter deal from the Fed, and so disintermediation occurs).
In terms of monetary stimulus, QE was more or less offset during the financial crisis leading into the Great Recession via higher demand for bank reserves (IOR) and stricter banking regulation. Higher capital requirements were justified as necessary to stabilize the financial system, but critics like Brian Wesbury stress that the real destabilizing culprit was mark-to-market valuation requirements.
During the Covid pandemic, however, aggressive QE was intended to stabilize the economy and was not neutralized, so the Fed’s balance sheet and the money supply expanded dramatically. A surge in inflation followed.
Rates and Monetary Policy
The IOR regime severs the connection between overnight rates and monetary policy, while artificially fixing the price of reserves. There is little interbank borrowing of reserves under this “ample reserves” policy. But if there is little or no volume, what’s the true level of the Fed funds rate? Some critics (like Wesbury) claim it’s basically made up by the Fed! In any case, there is no longer any real connection between the fed funds rate and the tenor of monetary policy.
Instead, the rate paid to banks on reserves essentially sets a floor on short-term interest rates. And whenever the Fed seeks to tighten policy via IOR rate actions, it faces a potential loss on its interest spread. That represents a conflict of interest for Fed policymaking.
Sumner dislikes the IOR arrangement because, he say, it reinforces the false notion that interest rates are key to understanding monetary policy. For example, higher short-term rates are not always consistent with lower inflation. Sumner prefers controlling the monetary base as a means of targeting the level of nominal GDP, allowing interest rates to signal reserve scarcity. All of that is out of the question as long as the Fed is manipulating the IOR rate.
The Fed As Treasury Lapdog
With IOR and ample reserves, the Fed’s management of a huge portfolio of securities puts it right in the middle of the debt market across a range of maturities. As implied above, that distorts pricing and creates tension between fiscal policy and “independent” monetary policy. Such tension is especially troubling given ongoing, massive federal deficits and increasing Administration pressure on the Fed to reduce rates.
Of course, when the Fed engages in QE, or actively turns over and replaces its holdings of maturing Treasuries with new ones, it is monetizing deficits and creating inflationary pressure. It’s one kind of money printing, the mechanism by which an inflation tax is traditionally understood to reduce the real value of federal debt.
The IOR monetary regime is not the first time the Fed has intervened in the debt markets at longer maturities. In 1961, the Fed ran “Operation Twist”, selling short-term Treasuries and buying long-term Treasuries in an effort to reduce long-term rates and stimulate economic activity. However, the operation did not result in an increase in the Fed’s balance sheet holdings and cannot be interpreted as debt monetization.
Fed Adventurism
The Fed earned positive net interest income from 2008-2023, enabling it to turn over profits to the Treasury. This had a negative effect on federal deficits. However, some contend that the Fed’s net interest income over those years fostered mission creep. Wesbury notes that the Fed dabbled in “… research on climate change, lead water pipes and all kinds of other issues like ‘inequality’ and ‘racism.’” These topics are far afield of the essential functions of a central bank, monetary authority, or bank regulator. One can hope that keeping the Fed on a tight budgetary leash by ending the IOR monetary regime would limit this kind of adventurism.
A Contrary View
John Cochrane insists that IOR is a “lovely innovation”. In fact, he wonders whether the opposition to IOR is grounded in nostalgic, Trumpian hankering for zero interest rates. Cochrane also asserts that IOR is “usually” costless because longer-term rates on the Fed’s portfolio tend to exceed the short-term rate earned on reserves. That’s not true at the moment, of course, and the value of securities in the Fed’s portfolio tanked when interest rates rose. The Fed treats the shortfall in net interest as an increment to a “deferred asset”, but the negative profit, in the interim, must be met by taxpayers (who would normally benefit from the Fed’s profit) or printing money. The Fed shoulders ongoing interest-rate risk, freeing banks of the same to the extent that they hold reserves. Again, this subsidy has a real cost.
I’m surprised that Cochrane doesn’t see the strong potential for monetary lapdoggery under the IOR regime. Sure, the Fed can always print money and load up on new issues of Treasury debt. But IOR and an ongoing “quantitative” portfolio create an institutional bias toward supporting fiscal incontinence.
I’m also surprised that Cochrane would characterize an attempt to end IOR as easier monetary policy. Such a change would be accompanied by an unwinding of the Fed’s mammoth portfolio (QT). That might or might not mean tighter policy, on balance. Such an unwinding would be neutralized by lower demand for bank reserves and a lighter regulatory touch, and it should probably be phased in over several years.
Conclusion
Norbert Michel summarizes the problems created by IOR (the chart at the top of this post is from Michel). Here is a series of bullet points from his December testimony before the Senate Homeland Security and Governmental Affairs Committee (no quote marks below, as I paraphrase his elaborations):
The economic cost of the Fed’s losses is high. Periodic or even systemic failures to turn profits over to the Treasury means more debt, taxes, or inflation.
The IOR framework creates a conflict of interest with the Fed’s mandate to stabilize prices. The IOR rate set by the Fed has an impact on its profitability, which can be inconsistent with sound monetary policy actions.
The IOR system facilitates government support for the private financial sector. Banks get a risk-free return and the Fed acquiesces to bearing rate risk.
More accessible money spigot. The Fed can buy and hold Treasury debt, helping to fund burgeoning deficits, while paying banks to hold the extra cash that creates.
The money spigot enables wasteful expansion of government. Unfortunately, far too many partisans are under the delusion that more government is the solution to every problem, rather than the root cause of so much dysfunction. And of course advocates of so-called Modern Monetary Theory are all for printing the money needed to bring about the “warmth of collectivism”.
In advanced civilizations the period loosely called Alexandrian is usually associated with flexible morals, perfunctory religion, populist standards and cosmopolitan tastes, feminism, exotic cults, and the rapid turnover of high and low fads---in short, a falling away (which is all that decadence means) from the strictness of traditional rules, embodied in character and inforced from within. -- Jacques Barzun


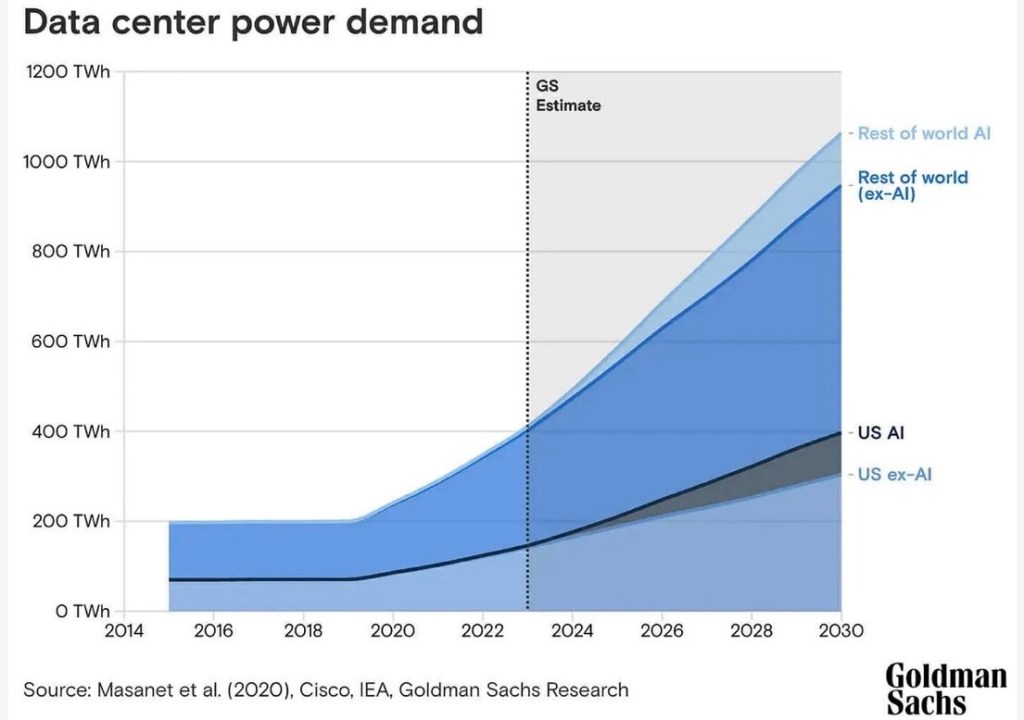

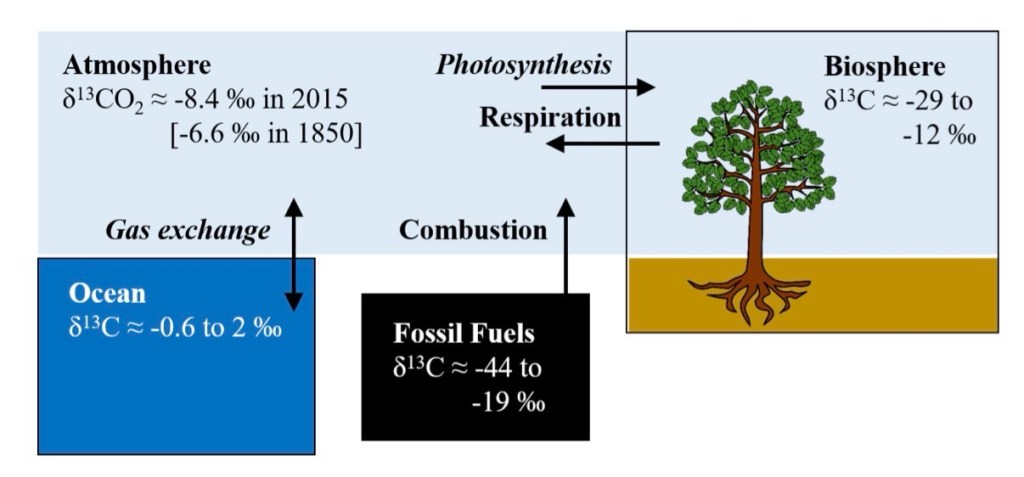


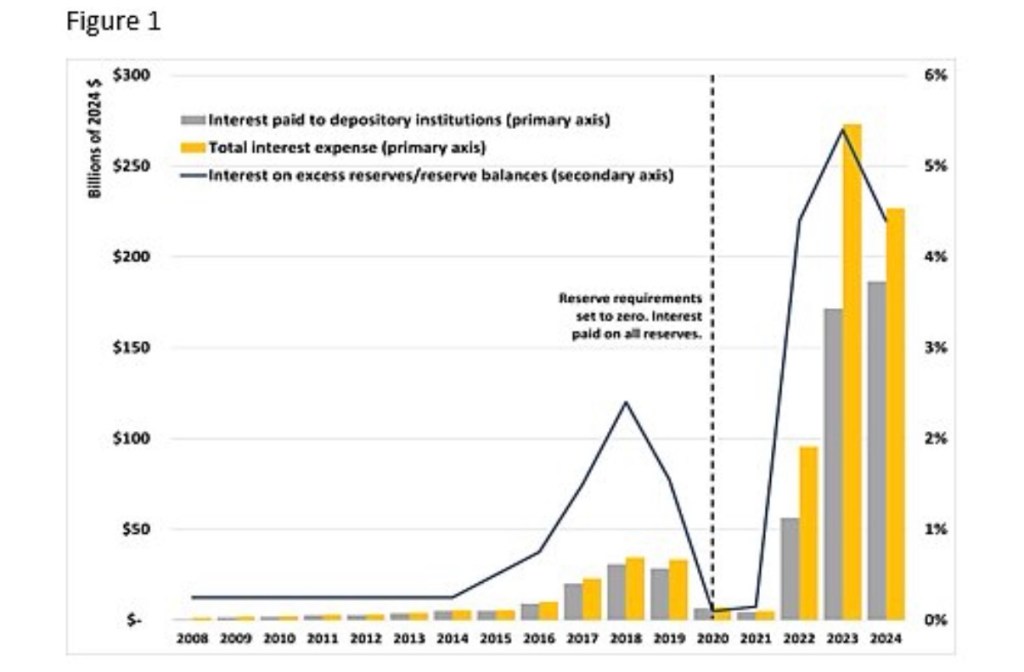
