
Tags
Anthropogenic Global Warming, Bio-Decay, Carbon Isotopes, Climate Change, Cloud Cover, Drought, Forest Fires, Fossil fuels, Geothermal Activity, Global Greening, Global Temperature, Heather Graven, International Panel on Climate Change, IPCC, Jonathan Cohler, Little Ice Age, Ocean PH, Plant Respiration, RCP8.5, Roger Pielke Jr., Sea Levels, Severe Storms, Solar Radiance, United Nations, Willie Soon
Evidence is piling up that claims of anthropogenic global warming (AGW) and an incipient climate apocalypse have constituted vast exaggerations if not outright falsehoods. And for several years it’s been hard to miss indications that the social mood has shifted away from climate alarmism. That’s true inside and outside the climate science community, where so-called “consensus” has given way to growing skepticism and dissent.
Backing Away From Crazy Town
The most prominent shift in the climate “vibe” involves the Intergovernmental Panel on Climate Change (IPCC), which has grown to be the chief climate-change propaganda arm of the United Nations and the environmental left. The IPCC has now received new climate change scenarios from an upstream committee to be used in the IPCC’s upcoming Seventh Assessment Report (AR7). Roger Pielke Jr. reviewed the changes, which are noteworthy due to their scaled-back projections of atmospheric CO2 concentrations and global warming.
The three most extreme scenarios for CO2 forcings have been eliminated: RCP8.5, SSP5-8.5, and SSP3-7.0. These scenarios have become “implausible”, according to this paper, which credits renewable energy and climate policy for the changed outlook. “Implausible” is the right word, but this narrative is a preposterous attempt to save face. The extreme scenarios were never realistic, and that should be obvious to even the climate-change orthodoxy.
Given the IPCC’s track record, it might be surprising that the extreme scenarios were so influential. The most extreme, RCP8.5, was used in over 17,000 papers as the basis of climate change and various damage calculations. It’s not been unusual for documents to go so far as to describe RCP8.5 as “Business as Usual”.
The best argument I’ve heard in favor of the extreme scenarios is that they represented stress tests that could be used to interpolate many less extreme scenarios without the substantial cost of additional model simulations. A key quote is that “It’s easier to interpolate than extrapolate.” That’s fine, though my own experience in running model simulations informs me that the comment cited at the link likely exaggerates the cost of model runs. Furthermore, “interpolating” complex models over decades is not a simple business, or non-controversial for that matter. And perhaps most importantly, it would have been incumbent on the IPCC and other climate authorities to make clear to the press, the public, educators, and policymakers that the most extreme scenario did NOT represent BAU, and were not to be interpreted as plausible outcomes. That critical disclaimer simply fell through the cracks.
Models, Reality, and Data
That such extreme scenarios should prove influential as key inputs to other models speaks to the confusion between empirical evidence and a narrative treated as consensus by the left, including much of the press. It’s bad enough that so many observers unknowingly take model outputs as empirics. That is all too common in discussions of climate change, but these extreme model outputs go well beyond that sort of confusion, and their promotion seems quite intentional.
Challenging “Consensus”
In my last post I discussed Jonathan Cohler’s take-down of so-called “global temperature” measurements, particularly the Global Mean Surface Temperature. As Cohler notes, this metric is no more valid as a representation of physical reality than an infinite array of other calculations. Cohler has made several other noteworthy contributions to the growing canon of climate realism.
Here I wish to discuss another important Cohler paper, this one with coauthor Willie Soon, debunking the widely-held belief that rising atmospheric CO2 concentrations are attributable to human activity, and more specifically the burning of fossil fuels. Below, I try my best to explain the logic and empirics underlying the Cohler-Soon (CS) conclusions in nontechnical language. Any mistakes are mine.
Isotopic Signatures
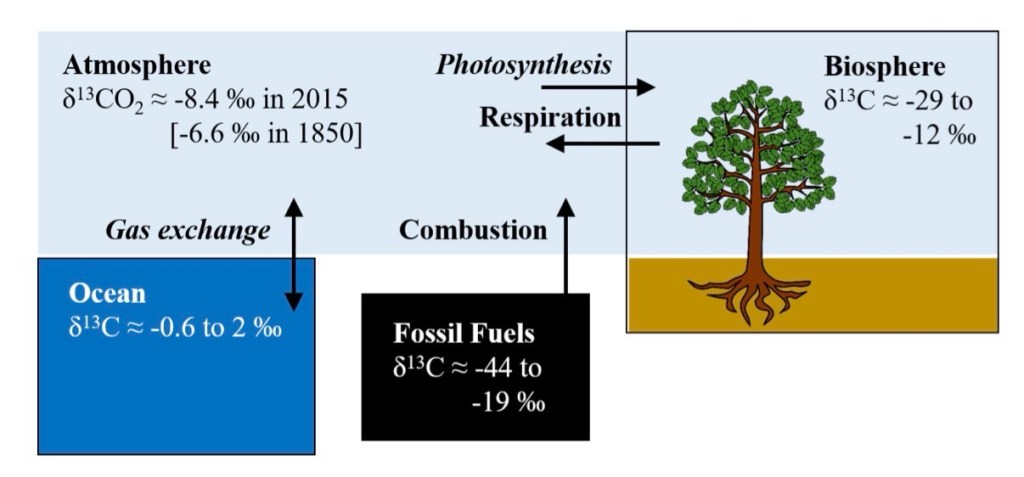
CS take advantage of the isotopic “signature” of net carbon additions to the atmosphere. This refers to the atomic makeup (number of neutrons) of different carbon sources. They find that the isotopic signature of the aggregate source flow has been quite stable for decades, even centuries based on proxy measures. But fossil fuels have a more extreme isotopic signature than natural carbon sources. These signatures are illustrated in the graphic at the top of this post, taken from a paper by Heather Graven, et al. Thus, CS conclude that the burning of fossil fuels has had little impact on the (trendless) aggregate source signature (NOT the cumulative atmospheric signature on the upper left of the graphic, which has risen). The source signature should have trended more decisively if fossil fuels dominated the rise in atmospheric CO2, especially as human emissions grew over the decades.
CS find that atmospheric carbon tends to dissipate fairly rapidly due to natural processes: 3.5 – 4 years, contrary to frequent assertions of very slow decay (see CS Table 1). It’s what plants breathe, converting it to oxygen; oceans absorb a great deal of carbon as well. Furthermore, human emissions have accounted for only about 4% of gross fluxes of CO2 into the atmosphere each year. CS state that the balance comes from natural sources such as “oceanic processes and … terrestrial respiration.” These include plant decay and geothermal activity. These natural sources have less extreme isotopic signatures than fossil fuel emissions. (I say “extreme” because most of these signatures take negative values.) Based on these facts, CS show that increases in natural fluxes can easily account for the added CO2 that has accumulated since the 1950s.
An Alternative Explanation
The meaning of the Cohler-Soon paper is that to-date, all but the last several years of human emissions of CO2 are still present in the atmosphere. Obviously, this concentration would grow if annual emissions grow. But to-date, the stability of the net source signature suggests that some other carbon source is acting to offset the extreme isotopic signature of CO2 from burning fossil fuels. In fact, that logic suggests that ocean outgassing, geothermal fluxes, plant decay and the soil biosphere can account for the added atmospheric carbon. Those natural sources have less extreme isotopic signatures, especially geothermal, followed by ocean outgassing.
But what caused this increase in natural fluxes? CS maintain that warming temperatures since the end of the Little Ice Age (1300 – 1850) led to the increase in atmospheric carbon from oceanic and biospheric fluxes. The higher temperatures themselves were not driven by CO2 concentrations but by greater solar radiation, changes in cloud cover, ocean cycles, and deep ocean heating. This conclusion is supported by earlier research conducted by Soon and other authors cited in the CS paper.
Failed Models and Predictions
More and more, we see that virtually every assertion made by the climate-crisis orthodoxy lacks evidence that stands up to scrutiny. The earth is not “on fire”. It is greening beautifully. Here’s a helpful timeline of failed, catastrophic climate predictions made since the mid-1960s. There will be many more. One such failed prediction calls for severe storms to increase in frequency and intensity, but that trend is negative. The trend in forest fires is negative as well, as are droughts, despite alarmist predictions. The oft-cited trend in sea levels has been in place since the Little Ice Age, with no recent acceleration. See this page for information on other climate phenomena that run contrary to the alarmist narrative.
Summary
Evidence from isotopic measures of CO2 over recent decades, and proxy measures over several centuries, show that the much-dreaded rise in carbon concentrations had its probable origin in natural sources. Human emissions are too inconsequential relative to natural sources, and carbon dissipates too rapidly in the atmosphere to support the hypothesis of rising carbon concentration based on human activity. Natural sources include geologic and oceanic outgassing, along with decaying matter and soil. These fluxes were stimulated by warmer temperatures brought on by stronger solar radiance, geothermal deep ocean heating, and changes in cloud cover.
So the evidence strongly indicates that higher temperatures induced more atmospheric carbon fluxes, not vice-versa. But how can that be when the models used by the climate science establishment embed assumptions to the contrary? The answer is that they are models based on sketchy empirics, not reality, and the line of causation seemed logical to modelers searching for a culprit. Furthermore, the causal chain upon which the models depend was often politically and financially expedient. While higher carbon concentrations can lead to rising temperatures given radiative forcing, the effect is weak and tapers at higher CO2 concentrations.
The IPCC’s retirement of its extreme climate scenarios represents a significant change. It is not that the extreme model scenarios have “become less likely”. It’s because those scenarios were always farfetched and reality finally caught up with the extremist narrative. This should give us all pause whenever policymakers attempt to sell costly initiatives to address climate change, anthropogenic global warming, climate sustainability, or the alarmist euphemism of the day. We’re not yet free of the exaggerated climate narratives, as this piece regarding the new IPCC scenarios tells us.
