• About

Sacred Cow Chips

Sacred Cow Chips

Tag Archives: Little Ice Age

Isotopes Point To Natural CO2 Origins

21 Thursday May 2026

Posted by Nuetzel in Climate science, Global Warming

≈ Leave a comment

Tags

Anthropogenic Global Warming, Bio-Decay, Carbon Isotopes, Climate Change, Cloud Cover, Drought, Forest Fires, Fossil fuels, Geothermal Activity, Global Greening, Global Temperature, Heather Graven, International Panel on Climate Change, IPCC, Jonathan Cohler, Little Ice Age, Ocean PH, Plant Respiration, RCP8.5, Roger Pielke Jr., Sea Levels, Severe Storms, Solar Radiance, United Nations, Willie Soon
Evidence is piling up that claims of anthropogenic global warming (AGW) and an incipient climate apocalypse have constituted vast exaggerations if not outright falsehoods. And for several years it’s been hard to miss indications that the social mood has shifted away from climate alarmism. That’s true inside and outside the climate science community, where so-called “consensus” has given way to growing skepticism and dissent.

Backing Away From Crazy Town

The most prominent shift in the climate “vibe” involves the Intergovernmental Panel on Climate Change (IPCC), which has grown to be the chief climate-change propaganda arm of the United Nations and the environmental left. The IPCC has now received new climate change scenarios from an upstream committee to be used in the IPCC’s upcoming Seventh Assessment Report (AR7). Roger Pielke Jr. reviewed the changes, which are noteworthy due to their scaled-back projections of atmospheric CO2 concentrations and global warming.

The three most extreme scenarios for CO2 forcings have been eliminated: RCP8.5, SSP5-8.5, and SSP3-7.0. These scenarios have become “implausible”, according to this paper, which credits renewable energy and climate policy for the changed outlook. “Implausible” is the right word, but this narrative is a preposterous attempt to save face. The extreme scenarios were never realistic, and that should be obvious to even the climate-change orthodoxy.

Given the IPCC’s track record, it might be surprising that the extreme scenarios were so influential. The most extreme, RCP8.5, was used in over 17,000 papers as the basis of climate change and various damage calculations. It’s not been unusual for documents to go so far as to describe RCP8.5 as “Business as Usual”.

The best argument I’ve heard in favor of the extreme scenarios is that they represented stress tests that could be used to interpolate many less extreme scenarios without the substantial cost of additional model simulations. A key quote is that “It’s easier to interpolate than extrapolate.” That’s fine, though my own experience in running model simulations informs me that the comment cited at the link likely exaggerates the cost of model runs. Furthermore, “interpolating” complex models over decades is not a simple business, or non-controversial for that matter. And perhaps most importantly, it would have been incumbent on the IPCC and other climate authorities to make clear to the press, the public, educators, and policymakers that the most extreme scenario did NOT represent BAU, and were not to be interpreted as plausible outcomes. That critical disclaimer simply fell through the cracks.

Models, Reality, and Data

That such extreme scenarios should prove influential as key inputs to other models speaks to the confusion between empirical evidence and a narrative treated as consensus by the left, including much of the press. It’s bad enough that so many observers unknowingly take model outputs as empirics. That is all too common in discussions of climate change, but these extreme model outputs go well beyond that sort of confusion, and their promotion seems quite intentional.

Challenging “Consensus”

In my last post I discussed Jonathan Cohler’s take-down of so-called “global temperature” measurements, particularly the Global Mean Surface Temperature. As Cohler notes, this metric is no more valid as a representation of physical reality than an infinite array of other calculations. Cohler has made several other noteworthy contributions to the growing canon of climate realism.

Here I wish to discuss another important Cohler paper, this one with coauthor Willie Soon, debunking the widely-held belief that rising atmospheric CO2 concentrations are attributable to human activity, and more specifically the burning of fossil fuels. Below, I try my best to explain the logic and empirics underlying the Cohler-Soon (CS) conclusions in nontechnical language. Any mistakes are mine.

Isotopic Signatures

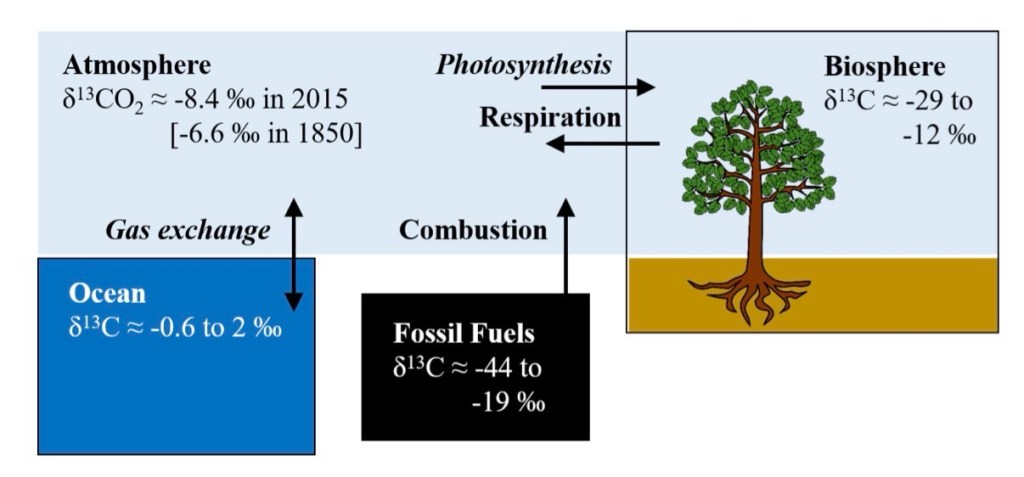
CS take advantage of the isotopic “signature” of net carbon additions to the atmosphere. This refers to the atomic makeup (number of neutrons) of different carbon sources. They find that the isotopic signature of the aggregate source flow has been quite stable for decades, even centuries based on proxy measures. But fossil fuels have a more extreme isotopic signature than natural carbon sources. These signatures are illustrated in the graphic at the top of this post, taken from a paper by Heather Graven, et al. Thus, CS conclude that the burning of fossil fuels has had little impact on the (trendless) aggregate source signature (NOT the cumulative atmospheric signature on the upper left of the graphic, which has risen). The source signature should have trended more decisively if fossil fuels dominated the rise in atmospheric CO2, especially as human emissions grew over the decades.

CS find that atmospheric carbon tends to dissipate fairly rapidly due to natural processes: 3.5 – 4 years, contrary to frequent assertions of very slow decay (see CS Table 1). It’s what plants breathe, converting it to oxygen; oceans absorb a great deal of carbon as well. Furthermore, human emissions have accounted for only about 4% of gross fluxes of CO2 into the atmosphere each year. CS state that the balance comes from natural sources such as “oceanic processes and … terrestrial respiration.” These include plant decay and geothermal activity. These natural sources have less extreme isotopic signatures than fossil fuel emissions. (I say “extreme” because most of these signatures take negative values.) Based on these facts, CS show that increases in natural fluxes can easily account for the added CO2 that has accumulated since the 1950s.

An Alternative Explanation

The meaning of the Cohler-Soon paper is that to-date, all but the last several years of human emissions of CO2 are still present in the atmosphere. Obviously, this concentration would grow if annual emissions grow. But to-date, the stability of the net source signature suggests that some other carbon source is acting to offset the extreme isotopic signature of CO2 from burning fossil fuels. In fact, that logic suggests that ocean outgassing, geothermal fluxes, plant decay and the soil biosphere can account for the added atmospheric carbon. Those natural sources have less extreme isotopic signatures, especially geothermal, followed by ocean outgassing.

But what caused this increase in natural fluxes? CS maintain that warming temperatures since the end of the Little Ice Age (1300 – 1850) led to the increase in atmospheric carbon from oceanic and biospheric fluxes. The higher temperatures themselves were not driven by CO2 concentrations but by greater solar radiation, changes in cloud cover, ocean cycles, and deep ocean heating. This conclusion is supported by earlier research conducted by Soon and other authors cited in the CS paper.

Failed Models and Predictions

More and more, we see that virtually every assertion made by the climate-crisis orthodoxy lacks evidence that stands up to scrutiny. The earth is not “on fire”. It is greening beautifully. Here’s a helpful timeline of failed, catastrophic climate predictions made since the mid-1960s. There will be many more. One such failed prediction calls for severe storms to increase in frequency and intensity, but that trend is negative. The trend in forest fires is negative as well, as are droughts, despite alarmist predictions. The oft-cited trend in sea levels has been in place since the Little Ice Age, with no recent acceleration. See this page for information on other climate phenomena that run contrary to the alarmist narrative.

Summary

Evidence from isotopic measures of CO2 over recent decades, and proxy measures over several centuries, show that the much-dreaded rise in carbon concentrations had its probable origin in natural sources. Human emissions are too inconsequential relative to natural sources, and carbon dissipates too rapidly in the atmosphere to support the hypothesis of rising carbon concentration based on human activity. Natural sources include geologic and oceanic outgassing, along with decaying matter and soil. These fluxes were stimulated by warmer temperatures brought on by stronger solar radiance, geothermal deep ocean heating, and changes in cloud cover.

So the evidence strongly indicates that higher temperatures induced more atmospheric carbon fluxes, not vice-versa. But how can that be when the models used by the climate science establishment embed assumptions to the contrary? The answer is that they are models based on sketchy empirics, not reality, and the line of causation seemed logical to modelers searching for a culprit. Furthermore, the causal chain upon which the models depend was often politically and financially expedient. While higher carbon concentrations can lead to rising temperatures given radiative forcing, the effect is weak and tapers at higher CO2 concentrations.

The IPCC’s retirement of its extreme climate scenarios represents a significant change. It is not that the extreme model scenarios have “become less likely”. It’s because those scenarios were always farfetched and reality finally caught up with the extremist narrative. This should give us all pause whenever policymakers attempt to sell costly initiatives to address climate change, anthropogenic global warming, climate sustainability, or the alarmist euphemism of the day. We’re not yet free of the exaggerated climate narratives, as this piece regarding the new IPCC scenarios tells us.
Warm, Contented Civilizations

26 Sunday Jun 2016

Posted by Nuetzel in Global Warming, Human Welfare

≈ 1 Comment

Tags

AGW, Andy May, Carbon Concentration, Human Civilization, Ice Core Data, Little Ice Age, Minoan Warm Period, Perihelion, Roman Warm Period, Temperature Proxy, Viking Civilization, Watt's Up With That?

image

Human civilizations have experienced many of their worst trials during periods of cooling and cold temperatures over the past 8,000 – 10,000 years. These were episodes associated with droughts as well. Conversely, civilizations have tended to prosper during warm, wet periods. These associations between human progress and the natural environment are discussed in a pair of articles by Andy May: “Climate and Human Civilization Over the Past 18,000 Years“, and  “Climate and Human Civilization for the Past 4,000 Years“. The articles are part climate science, part history, and part anthropology, with many fascinating details.

May presents large charts that can be downloaded, and they are especially interesting to ponder. He uses historical temperature proxies from Antarctica and Greenland to construct the charts, along with more recent data on measured surface temperatures in Greenland. According to May, the proxies are highly correlated with other proxy data from less extreme latitudes. Several important takeaways are the following:

  1. Warm periods in the historical record are associated with wet conditions, and cold periods are associated with dry conditions. This is intuitive, as warm air holds more moisture than cold air.
  2. There are estimates of temperatures going back more than 800 million years; apparent cyclical regularities in temperatures have lasted as long 150 million years. Cycles within cycles are evident: a 100,000 year cycle is prominent as well as a 25,000 year cycle (see #4 below).
  3. Today’s temperatures are not as high as those prevailing during about 200 years of the so-called Roman Warm Period, or during a span of similar length in the so-called Minoan Warm Period, about 3,300 years ago. Today’s temperatures are much lower than estimates for much of the earth’s pre-human history.
  4. The southern hemisphere has more volatile temperatures than the northern hemisphere due to the tilt of the earth’s axis at perihelion in January, when the earth is closest to the sun. That means the southern hemisphere tends to have warmer summers and colder winters. That will reverse over the next 10,000 years, and then it will reverse again. There is more land mass in the north, however, so it’s not clear that less extreme weather in the north helps explain the hugely lopsided distribution of development and population in that hemisphere.
  5. Recent increases in sea levels have been small relative to the years following the Little Ice Age. Projected increases over the next 50 years are of a magnitude that should be easily manageable for most coastal areas.
  6. Atmospheric carbon concentration seems to lag major increases in temperatures by about 800 years, raising a question of causality. Today’s carbon concentration is low relative to earlier epochs; it has been increasing for thousands of years, clearly independent of human activity, and is now near 400,000 year highs.
  7. Civilizations have blossomed with warm temperatures and they have collapsed or hit extended periods of retarded progress with declines in temperatures. Human agriculture was born as temperatures rose out of the depths of a glacial period about 10,000-12,000 years ago. Rome flourished during a warm cycle and collapsed as it waned. The Vikings settled in Greenland and Newfoundland during the Medieval Warm Period and were eliminated by the Little Ice Age. May cites a number of other examples of temperature cycles bringing on major shifts in the course of human progress. There are many possible explanations for the decline of past civilizations, but extremely low temperatures, droughts, and lengthy periods of weather inhospitable to agriculture have been important.

The fashion today is to insist that only dramatic changes in our use of energy can avert a global warming catastrophe. It is not clear that any effort by humans to manipulate global temperatures can overcome the natural forces that are always driving temperature change. For that matter, it is not clear that carbon dioxide is a bad thing, or that diverting vast quantities of resources to reduce it would be wise. CO2 is certainly not a pollutant in the normal sense of the word. Here is an excerpt from May’s conclusion in his “4,000 years” article, which speaks volumes:

“First, there is no perfect temperature. Man, even in pre-industrial times, adapted to a variety of temperatures and he has always done better in warm times and worse in cold times. Second, why would anyone want to go back to the pre-industrial climate? The Washington Post says the goal of the Paris Climate Conference was get the world to agree to limit global warming to less than two degrees above pre-industrial temperatures. Pre-industrial times? That’s the Little Ice Age, when it snowed in July, a time of endless war, famine and plague. According to the Greenland ice core proxy data, temperatures 180 years ago were nearly the coldest seen since the end of the last glacial period 10,000 years ago! Why measure our success in combating anthropogenic warming, if there is any such thing, from such an unusually cold time?“

The Broken-Climate Canard

19 Thursday May 2016

Posted by Nuetzel in Global Warming

≈ Leave a comment

Tags

AGW, Al Gore, Anthropomorphic Global Warming, Climate Alarmism, Climate Causality, Climate Change, CO2, Coyote Blog, Draught Severity, Hurricane Katrina, Little Ice Age, Measurement Technology Bias, Publication Bias, Tornadic Activity, Warren Meyer, Weather or Climate Change

MovieDisaster

In the imagination of the climate alarmist, almost everything portends an approaching catastrophe. A hurricane? Tornado? Draught? Warm spell? Cold spell? Blizzard? Bad harvest? To their way of thinking, these are all signs that CO2 is damaging the climate. Obviously, these are weather events that imply nothing in the absence of corroborating evidence, though you wouldn’t know it from listening to the precaution pols. Warren Meyer at Coyote Blog has posted another in his series of essays on this topic, this time called “Are We Already Seeing Climate Change?” He provides links to the earlier installments — all interesting. In this installment, he covers five topics under the heading “Manufacturing A Sense that the Climate Is Broken”, which I think would have made a better title for his post. I’ll try to summarize the five points briefly, but do read the whole thing:

Publication Bias:  This quote speaks for itself: “Every single tail-of-the-distribution weather event from around the world is breathlessly reported, leaving the impression among viewers that more such events are occurring, even when there is in fact no such trend. Further, since weather events can drive media ratings, there is an incentive to make them seem scarier.”

Claiming a Trend From One Data Point: This is the kind of error to which I alluded in the first paragraph. Think of Al Gore’s reaction to Hurricane Katrina. The charts offered by Meyer in this section are very nice. There is no upward trend in any of the following: hurricane energy; severe tornadic activity; the incidence of draughts or draught severity; heat waves; extremely hot days; and there is no abatement in the upward trend in crop yields. In fact, there is no trend in high temperature records in the U.S. The upward trend in average surface temperatures in the U.S. is entirely due to warmer nighttime temperatures.

Measurement Technology Bias: We now have the technology to measure various aspects of the climate from space. We can track polar ice extent with much more precision. Doppler radar technology and weather chasers have helped to identify more small tornados than we’d have known of 50 years ago. But when events seem noteworthy to alarmists, they draw extreme conclusions. To their great chagrin, these phenomena are often products of our enhanced ability to measure things.

What Is Normal?: This is related to measurement bias. Our detailed records on surface temperatures go back about 150 years, which is an extremely short slice of history. Temperature proxies from earlier eras, such as ice cores and fossilized tree rings, tell us that the recent past is not all that unusual. Moreover, we also know that glacier melting and sea level increases have been happening for much longer than the buildup of CO2. Those trends began near the end of the “Little Age Age”, around 1800. And there is evidence that these types of developments have happened before. Alarmists, however, assume that what we’ve witnessed in the recent past is unprecedented.

Collapsing Causality in a Complex System To a Single Variable:  “With all the vast complexity of the climate, are we really to believe that every unusual weather event is caused by a 0.013 percentage point change (270 ppm to 400 ppm) in the concentration of one atmospheric gas?” Not likely! Here Meyer helps put the recent temperature trends in perspective: they are tiny relative to their annual variation, which occurs both across seasons and within days.

The public seems to regard the co-called climate catastrophe with more skepticism today than perhaps ten years ago. Not only do the facts contradict the dire predictions of carbon-forcing climate models and alarmist scare stories, but people also recognize that the costs of attempting to avoid a global warming trend are massive and, well, probably not worth it. Moreover, they rightly suspect unworthy political motives in the alarmist community. If some carbon-induced warming is an eventuality, and that’s an “if”, it might well prove to be beneficial for people and the planet. Relax!


Follow Sacred Cow Chips on WordPress.com

Recent Posts

  • Isotopes Point To Natural CO2 Origins
  • Is “Global Temperature” a Fiction?
  • ESG Contortions: Virtue, Returns, and Politics
  • Grading Trump II, So Far
  • A Warsh Policy Scenario At the Federal Reserve

Archives

  • May 2026
  • April 2026
  • March 2026
  • February 2026
  • January 2026
  • December 2025
  • November 2025
  • October 2025
  • September 2025
  • August 2025
  • July 2025
  • June 2025
  • May 2025
  • April 2025
  • March 2025
  • February 2025
  • January 2025
  • December 2024
  • November 2024
  • October 2024
  • September 2024
  • August 2024
  • July 2024
  • June 2024
  • May 2024
  • April 2024
  • March 2024
  • February 2024
  • January 2024
  • December 2023
  • November 2023
  • August 2023
  • July 2023
  • June 2023
  • May 2023
  • April 2023
  • March 2023
  • February 2023
  • January 2023
  • December 2022
  • November 2022
  • October 2022
  • September 2022
  • August 2022
  • July 2022
  • June 2022
  • May 2022
  • April 2022
  • March 2022
  • February 2022
  • January 2022
  • December 2021
  • November 2021
  • October 2021
  • September 2021
  • August 2021
  • July 2021
  • June 2021
  • May 2021
  • April 2021
  • March 2021
  • February 2021
  • January 2021
  • December 2020
  • November 2020
  • October 2020
  • September 2020
  • August 2020
  • July 2020
  • June 2020
  • May 2020
  • April 2020
  • March 2020
  • February 2020
  • January 2020
  • December 2019
  • November 2019
  • October 2019
  • September 2019
  • August 2019
  • July 2019
  • June 2019
  • May 2019
  • April 2019
  • March 2019
  • February 2019
  • January 2019
  • December 2018
  • November 2018
  • October 2018
  • September 2018
  • August 2018
  • July 2018
  • June 2018
  • May 2018
  • April 2018
  • March 2018
  • February 2018
  • January 2018
  • December 2017
  • November 2017
  • October 2017
  • September 2017
  • August 2017
  • July 2017
  • June 2017
  • May 2017
  • April 2017
  • March 2017
  • February 2017
  • January 2017
  • December 2016
  • November 2016
  • October 2016
  • September 2016
  • August 2016
  • July 2016
  • June 2016
  • May 2016
  • April 2016
  • March 2016
  • February 2016
  • January 2016
  • December 2015
  • November 2015
  • October 2015
  • September 2015
  • August 2015
  • July 2015
  • June 2015
  • May 2015
  • April 2015
  • March 2015
  • February 2015
  • January 2015
  • December 2014
  • November 2014
  • October 2014
  • September 2014
  • August 2014
  • July 2014
  • June 2014
  • May 2014
  • April 2014
  • March 2014

Blogs I Follow

  • Passive Income Kickstart
  • OnlyFinance.net
  • TLC Cholesterol
  • Nintil
  • kendunning.net
  • DCWhispers.com
  • Hoong-Wai in the UK
  • Marginal REVOLUTION
  • Stlouis
  • Watts Up With That?
  • American Elephants
  • The View from Alexandria
  • The Gymnasium
  • A Force for Good
  • Notes On Liberty
  • troymo
  • SUNDAY BLOG Stephanie Sievers
  • Miss Lou Acquiring Lore
  • Your Well Wisher Program
  • Objectivism In Depth
  • RobotEnomics
  • Orderstatistic
  • Paradigm Library
  • Scattered Showers and Quicksand
  • Jam Review

Blog at WordPress.com.

Passive Income Kickstart

OnlyFinance.net

TLC Cholesterol

Nintil

To estimate, compare, distinguish, discuss, and trace to its principal sources everything

kendunning.net

The Future is Ours to Create

DCWhispers.com

Hoong-Wai in the UK

A Commonwealth immigrant's perspective on the UK's public arena.

Marginal REVOLUTION

Small Steps Toward A Much Better World

Stlouis

Watts Up With That?

The world's most viewed site on global warming and climate change

American Elephants

Defending Life, Liberty and the Pursuit of Happiness

The View from Alexandria

In advanced civilizations the period loosely called Alexandrian is usually associated with flexible morals, perfunctory religion, populist standards and cosmopolitan tastes, feminism, exotic cults, and the rapid turnover of high and low fads---in short, a falling away (which is all that decadence means) from the strictness of traditional rules, embodied in character and inforced from within. -- Jacques Barzun

The Gymnasium

A place for reason, politics, economics, and faith steeped in the classical liberal tradition

A Force for Good

How economics, morality, and markets combine

Notes On Liberty

Spontaneous thoughts on a humble creed

troymo

SUNDAY BLOG Stephanie Sievers

Escaping the everyday life with photographs from my travels

Miss Lou Acquiring Lore

Gallery of Life...

Your Well Wisher Program

Attempt to solve commonly known problems…

Objectivism In Depth

Exploring Ayn Rand's revolutionary philosophy.

RobotEnomics

(A)n (I)ntelligent Future

Orderstatistic

Economics, chess and anything else on my mind.

Paradigm Library

OODA Looping

Scattered Showers and Quicksand

Musings on science, investing, finance, economics, politics, and probably fly fishing.

Jam Review

"If you get confused, listen to the music play."

  • Subscribe Subscribed
    • Sacred Cow Chips
    • Join 128 other subscribers
    • Already have a WordPress.com account? Log in now.
    • Sacred Cow Chips
    • Subscribe Subscribed
    • Sign up
    • Log in
    • Report this content
    • View site in Reader
    • Manage subscriptions
    • Collapse this bar

Loading Comments...