
Tags
Affordability, Consumer Surplus, Don Boudreaux, Human Progress, Income Statistics, John D. Rockefeller, Marian Tupy, Martin Feldstein, Measures of Economic Welfare, Middle Class Stagnation, Non-Wage Benefits, Quality Adjustment, Wage Stagnation
A steady refrain among pundits is that the American middle class can’t get ahead. The standard of living of average Americans has stagnated over the past 30 years, according to this view. It’s bolstered by government measures of average wage growth relative to consumer prices. But Martin Feldstein describes the flaws in constructing these measures; he says they may have led to an understatement of real income growth of more than 2% per year! Here is a link to Feldstein’s piece in the Wall Street Journal: “We’re Richer Than We Realize“. (If the link doesn’t work, an ungated link can be found on the WSJ Facebook page, posted at 10:30 a.m. on Saturday, Sept. 9th.)
Here are some of Feldstein’s observations:
“If there is no increase in the cost of production, the government concludes that there has been no increase in quality. And if the manufacturer reports an increase in the cost of production, the government assumes that the value of the product to consumers has increased in the same proportion.
That’s a very narrow—and incorrect—way to measure quality change. In reality companies improve products in ways that don’t cost more to produce and may even cost less. That’s been true over the years for familiar products like television sets and audio speakers. The government therefore doesn’t really measure the value to consumers of the improved product, only the cost of the increased inputs. The same approach, based on measuring the cost of inputs rather than the value of output, is also used for services.
The official estimates of quality change are therefore mislabeled and misinterpreted. When it comes to quality change, what is called the growth of real output is really the growth of real inputs. The result is a major underestimation of the increase in real output and in the growth of real incomes that occurs through quality improvements.
The other source of underestimation of growth is the failure to capture the benefit of new goods and services. Here’s how the current procedure works: When a new product is developed and sold to the public, its market value enters into nominal gross domestic product. But there is no attempt to take into account the full value to consumers created by the new product per se.“
It goes well beyond that, however, as great swaths of consumer value are completely ignored by government statistics:
“A basic government rule of GDP measurement is to count only goods and services that are sold in the market. Services like Google and Facebook are therefore excluded from GDP even though they are of substantial value to households. The increasing importance of such free services implies a further understatement of real income growth.“
Some of these criticisms are unfair to the extent that income statistics correspond to what consumers can purchase in terms of market value. That is a fundamentally different concept than the total value consumers assign to goods and services (market value plus consumer surplus). Nevertheless, there are efforts to adjust for quality in these statistics, but they fall far short of their objective. Also, GDP and income statistics purport to be measures of economic welfare, though it’s well known that they fall short of that ideal. It might be more fair to say that that official income statistics are reliable in tracking short-term changes in well being, but not so much over long periods of time.
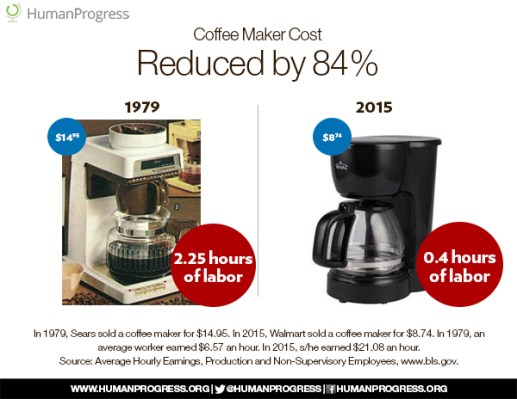
The graphic at the top of this post is taken from Marian L. Tupy’s “Cost of Living and Wage Stagnation in the United States, 1979-2015“, on the CATO Institute‘s web site:
“… many, perhaps most, big-ticket items used by a typical American family on a daily basis have decreased in price. Over at Human Progress, we have been comparing the prices of common household items as advertised in the 1979 Sears catalog and prices of common household items as sold by Walmart in 2015.
We have divided the 1979 nominal prices by 1979 average nominal hourly wages and 2015 nominal prices by 2015 average nominal hourly wages, to calculate the “time cost” of common household items in each year (i.e., the number of hours the average American would have to work to earn enough money to purchase various household items at the nominal prices). Thus, the ‘time cost’ of a 13 Cu. Ft. refrigerator fell by 52 percent in terms of the hours of work required at the average hourly nominal wage, etc.“
Tupy’s post also covers the huge increases in non-wage benefits enjoyed by many workers over the past several decades, which are not captured in average wage statistics.
It’s clear that standard measures of income growth are distorted by the failure to properly account for changes in the quality of goods and services at our disposal. The narrative of middle class stagnation is flawed in that respect. As Don Boudreaux has said, most ordinary Americans are richer today than John D. Rockefeller was a century ago. The availability and quality of goods and many services today, affordable to ordinary Americans, are vastly superior to what Rockefeller had then or could even imagine. And many of those advancements occurred since the 1970s.

Pingback: Climbing Up: Economic Mobility In the U.S. | Sacred Cow Chips