
Fake poverty statistics are a popular tool among America’s critics, both internal and external. Warren Meyer has a great post on these misleading metrics, which seem to be presented with the utmost sincerity by their proponents. Or are they?
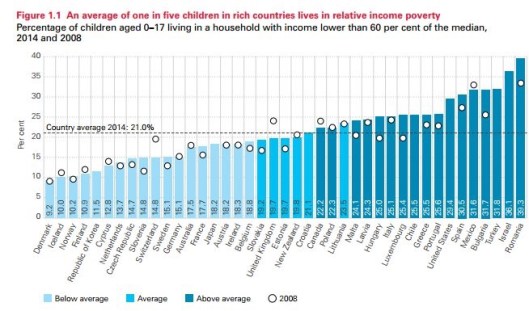
A mis-step in these calculations is in taking relativism to absurd lengths: Relative median incomes are of interest across countries, of course, or at any fixed percentile. But how about comparisons of incomes relative to median income across countries? As Meyer ably explains, that kind of comparison is not only meaningless but actually misleading. The chart at the top of this post is an example of what he means, taken from statistics published by the World Economic Forum (WEF):
“Relative child poverty is a metric based on the country’s median income — how many kids live in families with income that is X% of the median.
If you click on the source [WEF], the headline presents this as ‘These rich countries have high levels of child poverty.’ The implication is that the US has more child poverty than Latvia or Poland or Cyprus or Korea and only slightly less child poverty than Mexico and Turkey. But does it really mean this? No. This chart is a measure of income equality, NOT the absolute well-being of children.
Many of the countries ahead of the US are there not because their poor are well off, but because their median income is so much lower than ours. In fact, you will notice the lack of African and Asian countries in this. I will bet a lot of money that certain countries in Africa and Asia everyone knows to be dirt poor would beat out the US in this, thus making the bankruptcy of this metric obvious.
Take Denmark in the #1 spot. It looks like 20% more kids in the US live in poverty than in Denmark. But per the OECD, the US has a median income 41% higher than Denmark. So what it really means is the US has 20% more kids living under an income bar that is set 41% higher. How can this possibly have any meaning whatsoever, except to someone who wants to make the US look bad?”
So the metric seems designed to take advantage of the compression of incomes in poor countries to make them look better than they really are in terms of child poverty.
This is not an isolated example. Meyer offers other examples of distorted poverty statistics that would show 0% relative poverty if everyone earned exactly $1 per year! He also cites Census Bureau statistics showing roughly constant levels of poverty in the U.S. over 60 years while ignoring the impact of taxes and transfer payments. Correcting that “oversight” results in substantial declines in poverty.
Meyer closes with a postscript reminding us of the ongoing human progress in overcoming penury:
“Well, in 1820, 94 percent of the world’s population lived in extreme poverty (less than $1.90 per day adjusted for purchasing power). In 1990 this figure was 34.8 percent, and in 2015, just 9.6 percent. … In the last quarter century, more than 1.25 billion people escaped extreme poverty – that equates to over 138,000 people … being lifted out of poverty every day.
The credit goes to free market capitalism.

Pingback: What’s To Like About Income Inequality? | Sacred Cow Chips
Pingback: The Factual TRUTH about “Inequality!” – American Reveille