Tags
Campaign Spending, Carbon Footprint, central planning, Climate Risk, Compliance Costs, Cronyism, Debt Monetization, dependency, Diversity, Do-Somethingism, External Costs, Fiscal Illusion, Limited government, Malinvestment, monopoly, Price Controls, Public goods, Redistribution, Regulatory Capture, rent seeking, Wetlands, Willingness To Pay
I’m really grateful to have the midterm elections behind us. Well, except for the runoff Senate race in Georgia, the cockeyed ranked-choice Senate race in Alaska, and a few stray House races that remain unsettled after almost two weeks. I’m tired of campaign ads, including the junk mail and pestering “unknown” callers — undoubtedly campaign reps or polling organizations.
It’s astonishing how much money is donated and spent by political campaigns. This year’s elections saw total campaign spending (all levels) hit $16.7 billion, a record for a mid-term. The recent growth in campaign spending for federal offices has been dramatic, as the chart below shows:
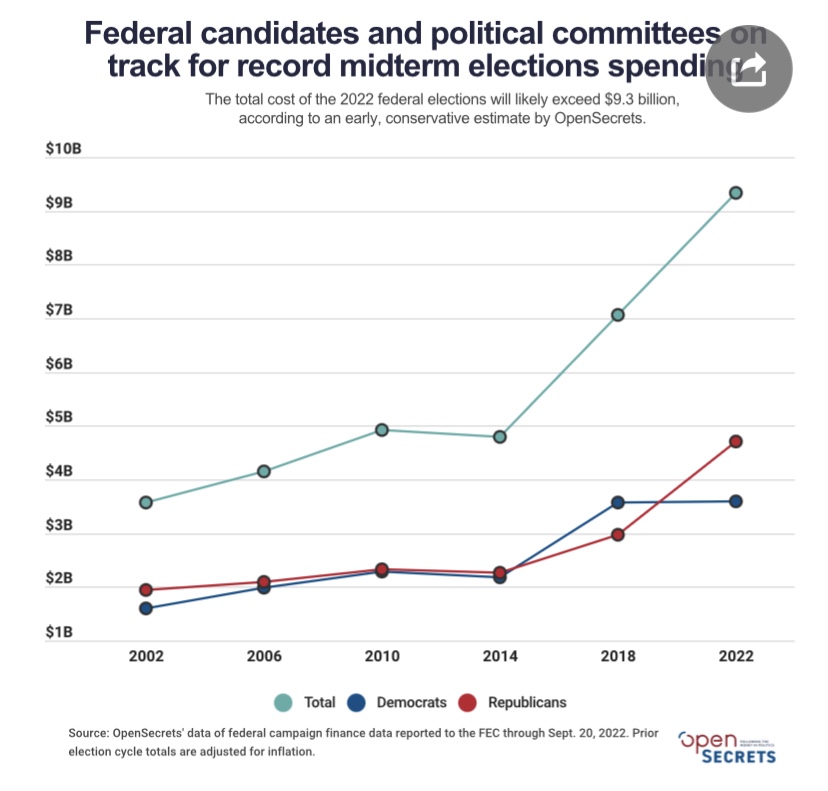
Do you think spending of a few hundred million dollars on a Senate campaign is crazy? Me too, though I don’t advocate for legal limits on campaign spending because, for better or worse, that issue is entangled with free speech rights. Campaigns are zero-sum events, but presumably a big donor thinks a success carries some asymmetric reward…. A success rate of better than 50% across several campaigns probably buys much more…. And donors can throw money at sure political bets that are probably worth a great deal…. Many donors spread their largess across both parties, perhaps as a form of “protection”. But it all seems so distasteful, and it’s surely a source of waste in the aggregate.
My reservations about profligate campaign spending include the fact that it is a symptom of big government. Donors obviously believe they are buying something that government, in one way or another, makes possible for them. The greater the scope of government activity, the more numerous are opportunities for rent seeking — private gains through manipulation of public actors. This is the playground of fascists!
There are people who believe that placing things in the hands of government is an obvious solution to the excesses of “greed”. However, politicians and government employees are every bit as self-interested and “greedy” as actors in the private sector. And they can do much more damage: government actors legally exercise coercive power, they are not subject in any way to external market discipline, and they often lack any form of accountability. They are not compelled to respect consumer sovereignty, and they make correspondingly little contribution to the nation’s productivity and welfare.
Actors in the private sector, on the other hand, face strong incentives to engage in optimizing behavior: they must please customers and strive to improve performance to stay ahead of their competition. That is, unless they are seduced by what power they might have to seek rents through public sector activism.
A people who grant a wide scope of government will always suffer consequences they should expect, but they often proceed in abject ignorance. So here is my rant, a brief rundown on some of the things naive statists should expect to get for their votes. Of course, this is a short list — it could be much longer:
- Opportunities for graft as bureaucrats administer the spending of others’ money and manipulate economic activity via central planning.
- A ballooning and increasingly complex tax code seemingly designed to benefit attorneys, the accounting profession, and certainly some taxpayers, but at the expense of most taxpayers.
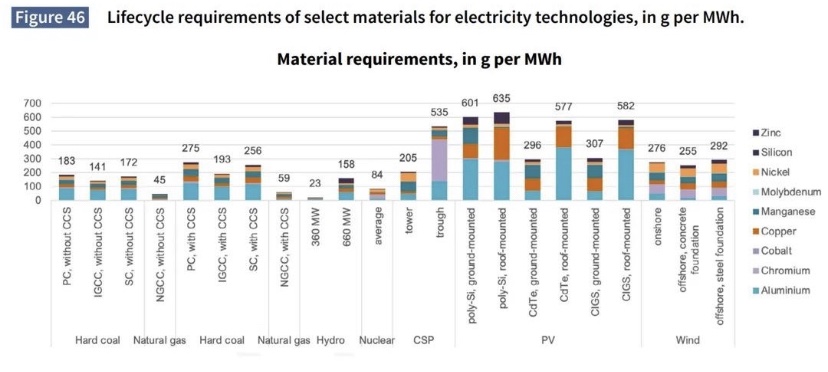
- Subsidies granted to producers and technologies that are often either unnecessary or uneconomic (and see here), leading to malinvestment of capital. This is often a consequence of the rent seeking and cronyism that goes hand-in-hand with government dominance and ham-handed central planning.
- Redistribution of existing wealth, a zero- or even negative-sum activity from an economic perspective, is prioritized over growth.
- Redistribution beyond a reasonable safety net for those unable to work and without resources is a prescription for unnecessary dependency, and it very often constitutes a surreptitious political buy-off.
- Budgetary language under which “budget cuts” mean reductions in the growth of spending.
- Large categories of spending, known in the U.S. as non-discretionary entitlements, that are essentially off limits to lawmakers within the normal budget appropriations process.
- “Fiscal illusion” is exploited by politicians and statists to hide the cost of government expansion.
- The strained refrain that too many private activities impose external costs is stretched to the point at which government authorities externalize internalities via coercive taxes, regulation, or legal actions.
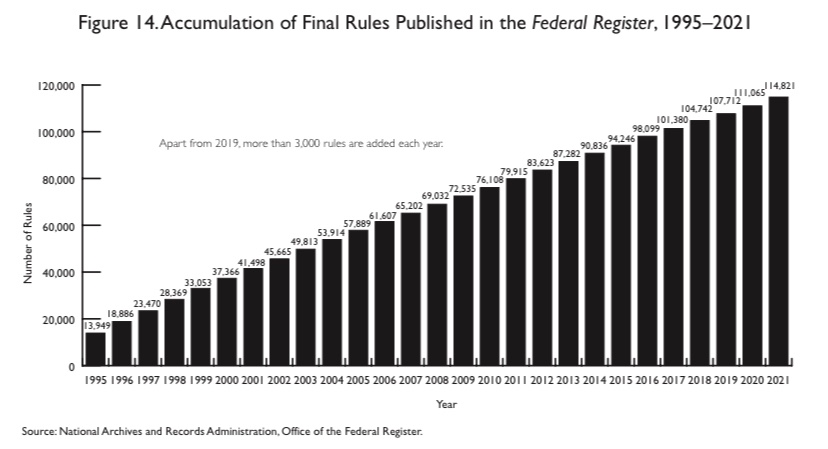
- Massive growth in regulation (see chart at top) extending to puddles classified as wetlands (EPA), the ”disparate impacts” of private hiring practices (EEOC), carbon footprints of your company and its suppliers (EPA, Fed, SEC), outrageous energy efficiency standards (DOE), and a multiplicity of other intrusions.
- Growth in the costs of regulatory compliance.
- A nearly complete lack of responsiveness to market prices, leading to misallocation of resources — waste.
- Lack of value metrics for government activities to gauge the public’s “willingness to pay”.
- Monopoly encouraged by regulatory capture and legal / compliance cost barriers to competition. Again, cronyism.
- Monopoly granted by other mechanisms such as import restrictions and licensure requirements. Again, cronyism.
- Ruination of key industries as government control takes it’s grip.
- Shortages induced by price controls.
- Inflation and diminished buying power stoked by monetized deficits, which is a long tradition in financing excessive government.
- Malinvestment of private capital created by monetary excess and surplus liquidity.
- That malinvestment of private capital creates macroeconomic instability. The poorly deployed capital must be written off and/or reallocated to productive uses at great cost.
- Funding for bizarre activities folded into larger budget appropriations, like holograms of dead comedians, hamster fighting experiments, and an IHOP for a DC neighborhood.
- A gigantic public sector workforce in whose interest is a large and growing government sector, and who believe that government shutdowns are the end of the world.
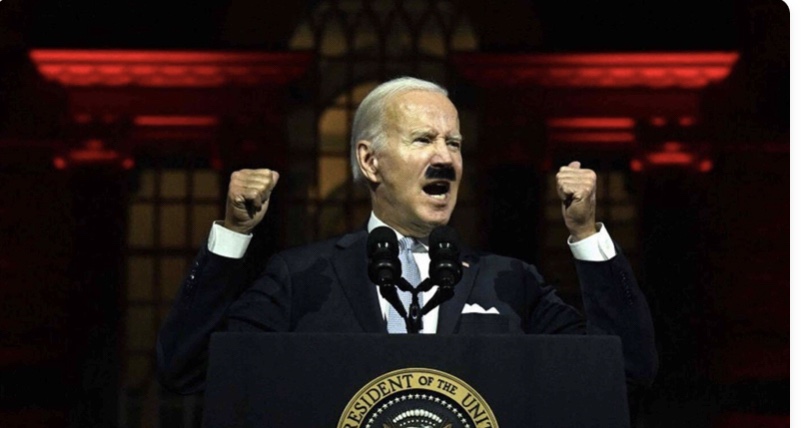
- Attempts to achieve central control of information available to the public, and the quashing of dissent, even in a world with advanced private information technology. See the story of Hunter Biden’s laptop. This extends to control of scientific narratives to ensure support for certain government programs.
- Central funding brings central pursestrings and control. This phenomenon is evident today in local governance, education, and science. This is another way in which big government fosters dependency.
- Mission creep as increasing areas of economic activity are redefined as “public” in nature.
- Law and tax enforcement, security, and investigative agencies pressed into service to defend established government interests and to compromise opposition.
I’ve barely scratched the surface! Many of the items above occur under big government precisely because various factions of the public demand responses to perceived problems or “injustices”, despite the broader harms interventions may bring. The press is partly responsible for this tendency, being largely ignorant and lacking the patience for private solutions and market processes. And obviously, those kinds of demands are a reason government gets big to begin with. In the past, I’ve referred to these knee-jerk demands as “do somethingism”, and politicians are usually too eager to play along. The squeaky wheel gets the oil.
I mentioned cronyism several times in the list. The very existence of broad public administration and spending invites the clamoring of obsequious cronies. They come forward to offer their services, do large and small “favors”, make policy suggestions, contribute to lawmakers, and to offer handsomely remunerative post-government employment opportunities. Of course, certaIn private parties also recognize the potential opportunities for market dominance when regulators come calling. We have here a perversion of the healthy economic incentives normally faced by private actors, and these are dynamics that gives rise to a fascist state.
It’s true, of course, that there are areas in which government action is justified, if not necessary. These include pure public goods such as national defense, as well as public safety, law enforcement, and a legal system for prosecuting crimes and adjudicating disputes. So a certain level of state capacity is a good thing. Nevertheless, as the list suggests, even these traditional roles for government are ripe for unhealthy mission creep and ultimately abuse by cronies.
The overriding issue motivating my voting patterns is the belief in limited government. Both major political parties in the U.S. violate this criterion, or at least carve out exceptions when it suits them. I usually identify the Democrat Party with statism, and there is no question that democrats rely far too heavily on government solutions and intervention in private markets. The GOP, on the other hand, often fails to recognize the statism inherent in it’s own public boondoggles, cronyism, and legislated morality. In the end, the best guide for voting would be a political candidate’s adherence to the constitutional principles of limited government and individual liberty, and whether they seem to understand those principles. Unfortunately, that is often too difficult to discern.