• About

Sacred Cow Chips

Sacred Cow Chips

Tag Archives: Watt’s Up With That?

Climate Change, Hurricanes and Noisy Statistics

22 Friday Sep 2017

Posted by Nuetzel in Global Warming

≈ Leave a comment

Tags

AGW, Atlantic Multi-Decadal Oscillation, Climate Change, Cool the Past, East Anglia University, El Nino, Fabius Maximus, global warming, Hurricane Harvey, Hurricane Irma, Hurricane Maria, Michael Mann, NOAA, Roger Pielke Sr, Roy Spencer, Ryan Maue, Sea Surface Temperatures, Signal-to-Noise, Statistical Noise, Storm Intensity, Watt's Up With That?

IMG_4919

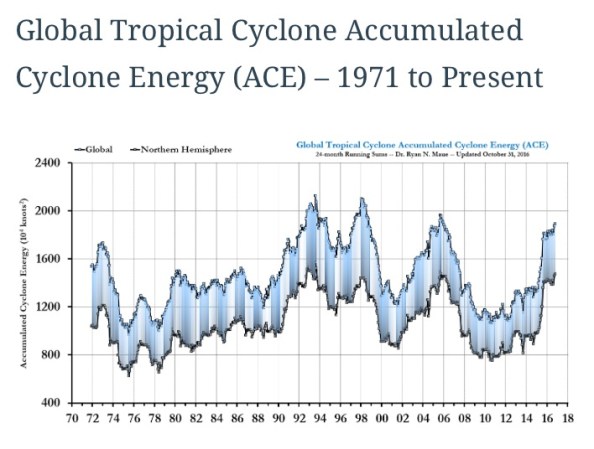
The nasty spate of hurricanes this year has been a catch-up of sorts following a decade of subdued activity. In fact, global hurricane activity has been flat to declining in frequency since 1970. Until the recent increase, hurricane activity had been trending down in terms of 24-month cumulative energy since the 1990s, as the chart above shows. The historical data on the number of U.S. landfalls extends back to 1900, and it has had a negative trend as well. Nevertheless, we hear from climate alarmists that Hurricanes Harvey and Irma, which ended a drought of record length in U.S hurricane landfalls, and now presumably Maria, were a consequence of anthropomorphic global warming (AGW), er… climate change.

The implication is that increases in the atmospheric concentration of CO2 led to these hurricanes or their high intensity. Apparently, the paucity of hurricane activity over the previous ten years can be waved off as a fluke. A further implication of the alarmist view is that the longer negative trends in hurricane frequency and energy can be ignored in the context of any relation to CO2 concentration. But how so? One confounding factor I’ve seen mentioned blames El Nino warming in the Pacific, and a consequent increase in Atlantic wind shear, for the long lull in activity after 2005. That has a ring of plausibility, but a closer look reveals that actual El Nino activity during those years was hardly impressive, with the exception of 2015-16.

More historical data can be seen in the charts on the tropical cyclone page on the Watts Up With That? blog. (The charts in question start about two-thirds of the way down the page.) Hurricane expert Ryan Maue compiled a number of these charts, including the one above. He authored an editorial in the Wall Street Journal this week bemoaning the climate-change hype surrounding Harvey and Irma (if the link doesn’t work, it is available at the WSJ’s Opinion page on Facebook, posted on 9/17). Maue believes that both the climate science community and the media share in the blame for that hype. But he also says the following:

“Although a clear scientific consensus has emerged over the past decade that climate change influences hurricanes in the long run, its effect upon any individual storm is unclear.“

Maue provides a link to this NOAA web site offering cautious support for the proposition that there is a link between global warming and hurricane intensity, though the data it cites ends about ten years ago, so it does not capture the recent lull. Also, some of the information it provides is based on modeled global temperatures and hurricane activity through 2100. As is well-known by now, or should be, long-term climate forecasts based on carbon forcings are notoriously inaccurate, and NOAA admits that the association between those predicted temperatures and future hurricanes is tenuous:

“It is premature to conclude that human activities–and particularly greenhouse gas emissions that cause global warming–have already had a detectable impact on Atlantic hurricane or global tropical cyclone activity.“

Perhaps the idea that there is consensus regarding the relationship between climate change and hurricanes is more of a stretch than Maue and NOAA let on. Here is a summary of 30 peer-reviewed studies showing no connection to either hurricane frequency or intensity. Most of these studies are more recent than the end of the data record cited by NOAA. And in fact, many of these studies find support for a negative link between global temperatures and hurricane activity.

One of the prominent alarmists in the climate research community is Penn State’s Michael Mann, who has famously claimed that hurricanes are more frequent now than at any time in the past 1,000 years. He based his conclusions on highly speculative hurricane “proxies” identified in layers of sediment. Mann’s claims and research technique have been called into questioned by other climate scientists, who have arrived at contrary results in their own research. Lest anyone forget, Mann was implicated in a  data manipulation fraud related to the East Anglia climate scandal. Though cleared by a group of tenured professors at his own university, there are a number of climate scientists who believe Mann violated scientific standards.

The claim that global warming will cause hurricanes to become increasingly intense relies on elevated sea surface temperatures. This year, temperatures in the Gulf of Mexico are elevated and are said to have had a role in strengthening Harvey as it approached the Gulf Coast. Texas, however, has experienced as many landfalls of major hurricanes with cooler Gulf waters as with warmer waters. And Irma strengthened in a part of the Atlantic without such warm temperatures. Instead, minimal wind shear was implicated as a factor contributing to Irma’s strength.

In general, Atlantic temperatures have been relatively warm since the late 1990s, a fact that most scientists would at least partially attribute to the “Atlantic multi-decadal oscillation“, a regular cycle in water temperatures that repeats with a period of multiple decades. Potentially adding to that temperature increase is a controversial change in NOAA’s calibration of sea surface temperatures, as an increasing share of those readings are taken from buoys rather than ship-board measurement. There is some suspicion that NOAA’s adjustments “cool the past” more than is justified, a suspicion that was heightened by allegations from one whistle-blowing NOAA scientist early this year. Then, there is the contention that the sea surface temperature makes little difference if it is matched by an increase in air temperature.

Overall, NOAA says the combination of frequency and intensity of tropical cyclones will increase by 2%-11% over the rest of this century. As Roy Spencer notes, that is not a terribly alarming figure given the risks people have always willingly accepted by living in coastal areas. In any case, the range is based on models of climate behavior that are of questionable reliability. And like past temperature predictions produced by carbon-forcing climate models, it is likely to be a gross overestimate. Here is Roger Pielke, Sr., who is quoted in this wide-ranging post on hurricanes and climate at the Fabius Maximus web site:

“Model projections of hurricane frequency and intensity are based on climate models. However, none have shown skill at predicting past (as hindcasts) variations in hurricane activity (or long term change in their behavior) over years, decades, and longer periods. Thus, their claim of how they will change in the future remains, at most, a hypothesis (i.e. speculation). When NOAA, IPCC and others communicate to the media and public, to be scientifically honest, they should mention this.”

Despite the spike in activity this year, strong hurricanes are intermittent and fairly rare. Establishing reliable statistical connections with other forces is difficult with emergent events like hurricanes. Moreover, the degree of error in measuring global or regional temperature itself is much larger than is generally acknowledged, and the global warming “signal” is very weak. As we say in the statistical analysis business, noisy data are compatible with diverse hypotheses. The relationship between hurricanes and climate change is a prime example.

The Taxing Logic of Carbon Cost Guesswork

11 Saturday Mar 2017

Posted by Nuetzel in Environment, Taxes, Uncategorized

≈ 1 Comment

Tags

Anthopomorphic, Carbon Dividend, Carbon Tax, Climate Leadership Council, Corrective Taxation, External costs and benefits, Fossil fuels, Greg Mankiw, Martin Feldstein, Paul Driessen, Roger Besdek, Ronald Bailey, Ted Halstead, Universal Basic Inome, Watt's Up With That?

An article by three prominent economists* in the New York Times this week summarized the Climate Leadership Council’s Conservative Case for Climate Action“. The “four pillars” of this climate plan include (1) a revenue-neutral tax on carbon emissions, which are used to fund… (2) quarterly “carbon dividend” payments to all Americans; (3) border tax adjustments to account for carbon emissions and carbon taxes abroad; (4) eliminating all other regulations on emissions of carbon. The “Case” is thus a shift from traditional environmental regulation to a policy based on tax incentives, then wrapped around a redistributive universal income mechanism.

I’ll dispense with the latter “feature” by referencing my recent post on the universal basic income: bad idea! The economists advocate for the carbon dividend sincerely, but also perhaps as a political inducement to the left and confused centrists.

The Limits of Our Knowledge

The most interesting aspect of the “Case” is how it demonstrates uncertainty around the wisdom of carbon restrictions of any kind: traditional regulations, market-oriented trading, or tax incentives. Those all involve assumptions about the extent to which carbon emissions should be restricted, and it’s not clear that any one form of restriction is more ham-handed than another. Traditional regulation may restrict output in various ways. For example, standards on fuel efficiency are an indirect way of restricting output. A carbon market, with private trading in assigned “rights” to emit carbon, is more economically efficient in the sense that a tradeoff is involved for any decision having carbon implications at the margin. However, the establishment of a carbon market ultimately means that a limit must be imposed on the total quantity of rights available for trading.

A carbon tax imputes a cost of carbon emissions to society. It also imposes tradeoffs, so it is similar to carbon trading in being more economically efficient than traditional regulation. A producer can attempt to adjust a production process such that it emits less carbon, and the incidence of the tax falls partly on final consumers, who adjust the carbon intensity of their behavior accordingly. For our purposes here, a tax is more illuminating in the sense that we can assess inputs to the cost imputation. Even a cursory examination shows that the cost estimate can vary widely given reasonable differences in the inputs. So, in a sense, a tax helps to reveal the weakness of the case against carbon and the carbon-based rationale for allowing a coercive environmental authority to sclerose the arteries of the market system.

The three economists propose an initial tax of $40 per metric ton of emitted carbon. The basis for that figure is the so-called “social cost of carbon” (SCC), a theoretical construct that is not readily measured. Economists have long subscribed to the theory of social costs, or negative externalities, and to the legitimacy of government action to force cost causers to internalize social costs via corrective taxation. However, the wisdom of allowing the state to intrude upon markets in this way depends on our ability to actually measure specific external costs.

Fatuous Forecasts

The SCC is based on the presumed long-run costs of an incremental ton of carbon in the environment. I do not use the word “presumed” lightly. The $40 estimate subsumes a variety of speculative assumptions about the climate’s response to carbon emissions, the future economic impact of that response, and the rate at which society should be willing to trade those future costs against present costs. The figure only counts costs, without considering the huge potential benefits of warming, should it actually occur.

Ronald Bailey at Reason illustrates the many controversies surrounding the calculation of the SCC. He notes the tremendous uncertainty surrounding an Obama Administration estimate of $36 a ton in 2007 dollars. It used an outdated climate sensitivity figure much higher than more recent estimates, which would bring the calculated SCC down to just $16.

A discount rate of 3% was applied to projected future carbon costs to produce an SCC in present value terms. The idea is that today’s “collective” would be indifferent between paying this cost today and suffering the burden of future costs inflicted by carbon emissions. This presumes that 3% is the expected return society can earn for the future by investing resources today. Unfortunately, the SCC is tremendously sensitive to the discount rate. Together with the more realistic estimate of climate sensitivity, a discount rate of 7% (the Office of Management and Budget’s regulatory guidance) would actually make the SCC negative!

Another U.S. regulatory standard, according to Bailey, is that calculations of social cost are confined to costs borne domestically. However, the SCC attempts to encompass global costs, inflating the estimate by a factor of 4 to 14 times. The justification for the global calculation is apparent righteousness in owning up to the costs we cause as a nation, and also for the example it sets for other countries in crafting their own carbon policies. Unfortunately, it also magnifies the great uncertainties inherent in this messy calculation.

Lack of Evidence

This guest essay on the Watts Up With That? web site by Paul Driessen and Roger Bezdek takes a less gracious view of the SCC than Bailey, if that is possible. As they note, in addition to climate sensitivity, the SCC must come to grips with the challenge of measuring the economic damage caused by each degree of warming. This includes factors far into the future that simply cannot be projected with any confidence. We are expected to place faith in distant cost estimates of heat-related deaths, widespread crop failures, severe storm damage, coastal flooding, and many other calamities that are little more than scare stories. For example, the widely reported connection between atmospheric carbon concentration and severe weather is demonstrably false, as are reports that Pacific islands have been swallowed by the sea due to global warming.

Ignoring the Benefits

The SCC makes no allowance for the real benefits of burning fossil fuels, which have been a powerful engine of economic growth and still hold the potential to lift the underdeveloped world out of poverty and environmental  distress. The benefits of carbon also include fewer cold-related deaths, higher agricultural output, and a greener environment. It isn’t surprising that these benefits are ignored in the SCC calculation, as any recognition of that promise would undermine the narrative that fossil fuels are unambiguously evil. Indeed, an effort to calculate only the net costs of carbon emissions would likely expose the entire exercise as a sham.

The “four pillars” of the Climate Leadership Council‘s case for climate action rest upon an incredibly flimsy foundation. Like anthropomorphic climate change itself, appropriate measurement of a social cost of carbon is an unsettled issue. Its magnitude is far too uncertain to use as a tool of public policy: as either a tax or a rationale for carbon regulation of any kind. And let’s face it, taxation and regulation are coercive acts that better be undertaken with respect for the distortions they create. In this case, it’s not even clear that carbon emissions should be treated as an external cost in many applications, as opposed to an external benefit. So much for the corrective wisdom of authorities. The government is not well-equipped to centrally plan the economy, let alone the environment.

  • The three economists are Martin Feldstein, Ted Halstead and Greg Mankiw.

The Progressive Underclass

09 Friday Sep 2016

Posted by Nuetzel in Poverty, Welfare State

≈ 2 Comments

Tags

Andrew Lundeen, Ban the Box, Bernie Sanders, Brian Doherty, CATO Institute, Climate Change Policy, Daniel Mitchell, Donald Trump, Earned Income Tax Credit, Kurt Williamsen, Land-Use Regulation, Leigh Franke, Protectionism, Redistribution, San Francisco, Scott Beyer, TANF, The Federalist Papers, The Tax Foundation, The Urban Institute, Vanessa Brown Colder, Watt's Up With That?

filling-out-forms

The underclass has not fared well under government policies enacted in explicit efforts to improve its members’ well being. If there is any one point on which I agree with Donald Trump, it is his recent assertion that “progressive” policies have been disastrous for minorities. Indeed, there is evidence that many public programs have been abject failures, even in terms of achieving basic goals. Some programs have managed to improve the immediate lot of the impoverished, but they have done so without freeing the beneficiaries of long-term dependency,  and perhaps have encouraged it. An underlying question is whether there is something endemic to these public initiatives that guarantees failure.

Arguments that public programs have such weaknesses are often based on the negative incentives they create, either for the intended beneficiaries (certain anti-poverty programs) or for employers who might otherwise work with them (absent minimum or “living” wages or regulatory obstacles). Then, of course, there are public services that are effectively monopolized (public schools) because they are “too important” to leave in the hands of private enterprise, with little recognition of the shoddy performance that is typical of institutions operating free of competitive pressure. And government action such as environmental policy often has a regressive impact, costing the poor a far greater share of income than the rich, and causing direct job losses in certain targeted industries.

A post from The Federalist Papers on “The Top 5 Ways Liberal Policies Hurt The Poor” is instructive. In addition to the welfare incentive trap, it highlights the failure of public schools to serve the educational needs of the poor, the minimum wage as a system of marginalization, urban gun control as a sacrifice of defenseless victims, and the extension of rights to illegal immigrants at the expense of U.S. citizens, especially low-skilled workers.

A fine essay by Kurt Williamsen entitled “Do Progressive Policies Hurt Black Americans?” focuses on three general areas of failure: public education, the workplace and welfare. He notes that certain educational innovations have met with success, yet are ridiculed by the progressive left because they promote competition.  He cites the dismal consequences for blacks of various labor and employment laws: “prevailing wage rates, the minimum wage, union bargaining power, occupational and business licensing laws, and affirmative action laws to comply with federal and state contracting requirements“. Even more astonishing is that the original motive for some of these policies, such as minimum wages and prevailing wage laws, was to keep unskilled blacks from competing with white union labor. They still work that way. Williamsen also discusses the fact that the welfare state has essentially left low-income blacks running in place, rather than lifting them out of dependency. Unfortunately, those programs have also inflicted large social costs, such as the disintegration of family in the black community:

“Welfare programs had an insidious effect on black culture — more so than white culture — because of the way they were designed. With dramatically more blacks than whites being in poverty and with less future prospects when the War on Poverty got started, young black women often had children out of wedlock, beginning a cycle of enduring poverty and welfare wherein they relied on welfare as a main source of income, as did their children. Welfare provided more money for young women with fatherless children, on average, than the same young women could have made if they were employed. If a woman became married, she would lose benefits, making it beneficial for her to either just hook up with men or cohabitate, rather than marry.“

Redistributionist policies have long been criticized for creating incentive problems among recipients of aid. Some of those problems have been corrected with the Earned Income Tax Credit, which operates as something of a negative income tax, and Temporary Assistance for Needy Families (TANF), which incorporates work requirements. However, as Vanessa Brown Colder at the CATO Institute points out, there is a need for further reforms to the many underperforming programs.

Like any large government program, redistribution also damages incentives for those who must pay the tab, generally those at higher income levels. High taxes ultimately discourage investment in capital and in new businesses that could improve the employment and income prospects of low-income segments. Here is Andrew Lundeen at The Tax Foundation:

“When fewer people are willing to invest, two things happen. First, the capital stock (i.e. the amount of computers, factories, equipment) shrinks over time, which makes workers less productive and decreases future wages.“

Redistributionists do their intended beneficiaries no favor by advocating for steeply progressive tax structures, which simply discourage investment in productive risk capital, impairing growth in labor income. This chart from Dan Mitchell shows a cross-country comparison of capital per worker and labor compensation. Not surprisingly, the relationship is quite strong. The lesson is that we should do everything we can to improve investment incentives. Punitive taxes on those who earn capital income is counterproductive.

Mitchell emphasizes a few other statist obstacles to empowering the disadvantaged here, including a brief discussion of how land-use regulations harm the poor. He quotes Leigh Franke of The Urban Institute:

“Restrictive land-use regulations, including zoning laws, are partially to blame for the stagnant growth… Land-use regulations may be intended to protect the environment or people’s health and safety, and even to enhance the supply of affordable housing, but in excess, they restrict housing supply, drive up home prices, and limit mobility. …More and more zoning restrictions meant less construction, fewer permits, and a restricted housing supply that drove up prices even further. …cities often have stringent zoning laws, a restricted housing supply, and high prices, making it nearly impossible for lower-income residents and newcomers, who would likely benefit most from the opportunities available, to find affordable housing.“

On the topics of local housing, labor laws, services, and regulatory burdens, Scott Beyer covers the maladies of that most progressive of cities, San Francisco. The city’s policies have helped create one of the nation’s most expensive housing markets  and have made the city’s distribution of income highly unequal. It is no coincidence that the politics of most of our declining cities are dominated by the progressive left.

Here is another fascinating example of negative unintended consequences arising from intervention on behalf of a disadvantaged group: so-called “Ban the Box” (BTB) initiatives. These laws prevent employers from inquiring about a job applicant’s  crime record, at least until late in the hiring process. Mitchell recently cited a study finding that BTB laws are associated with a reduction in employment opportunities for minorities. This disparate impact might be the result of more subtle screening by employers, demonstrating a reluctance to interview individuals belonging to groups with high crime rates. Apparently, employers are willing to give minorities a better chance when information on crime history is disclosed up-front.

Deleterious forms of intervention may vary from one disadvantaged group to another. For example, Native Americans have long been handicapped by federal control of their lands and their natural resources. Regulation of activity taking place on reservations is particularly burdensome, including a rule under which title to land must:

“… be passed in equal shares to multiple heirs. After several generations, these lands have become so fractionated that there are often hundreds of owners per parcel. Managing these fractionated lands is nearly impossible, and much of the land remains idle.“

Progressives often vouch for interventionism on the belief that thpse policies are ethically beyond question, such as climate change regulation. Of course, the science of whether anthropomorphic climate change is serious enough to warrant drastic and costly action is far from settled. The existence of high costs is deemed virtually irrelevant by proponents of activist environmental laws. Those costs fall heavily on the poor by raising the cost of energy-intensive necessities and by raising business costs, in turn diminishing employment opportunities. This is more pronounced from a global perspective than it is for the U.S., as emphasized in “Protect the poor – from climate change policies“, at the Watts Up With That? blog.

The world’s poor secure massive benefits from trade, but progressive policies often seek to inhibit trade based on misguided notions of “fairness” to workers in low-wage countries. And trade restrictions tend to benefit relatively high-wage workers by shielding them from competitive pressure. Brian Doherty in Reason talks about the nationalism of the Bernie Sanders brand, and how it undermines the poor. Donald Trump’s trade agenda has roughly the same implications. Protectionism should be rejected by the under-privileged, as it increases the prices they pay and ultimately reduces employment opportunities.

Certainly progressives always hope to assist the disadvantaged, but their policies have created a permanent dependent class. The simple lessons are these: working, producing and hiring must be rewarded at the margin, not penalized; interfering with wages and prices is counterproductive; all forms of regulation are costly; programs must be neutral in their impact on personal decisions; and property rights must be secure. Historically, economic freedom has lifted humanity from the grips of poverty. In virtually every instance, government micro-management has done the opposite. Unfortunately, it is difficult for progressives to overcome their reflexive tendency to “do something” about the poor by invoking the ever-klutzy power of the state.

Warm, Contented Civilizations

26 Sunday Jun 2016

Posted by Nuetzel in Global Warming, Human Welfare

≈ 1 Comment

Tags

AGW, Andy May, Carbon Concentration, Human Civilization, Ice Core Data, Little Ice Age, Minoan Warm Period, Perihelion, Roman Warm Period, Temperature Proxy, Viking Civilization, Watt's Up With That?

image

Human civilizations have experienced many of their worst trials during periods of cooling and cold temperatures over the past 8,000 – 10,000 years. These were episodes associated with droughts as well. Conversely, civilizations have tended to prosper during warm, wet periods. These associations between human progress and the natural environment are discussed in a pair of articles by Andy May: “Climate and Human Civilization Over the Past 18,000 Years“, and  “Climate and Human Civilization for the Past 4,000 Years“. The articles are part climate science, part history, and part anthropology, with many fascinating details.

May presents large charts that can be downloaded, and they are especially interesting to ponder. He uses historical temperature proxies from Antarctica and Greenland to construct the charts, along with more recent data on measured surface temperatures in Greenland. According to May, the proxies are highly correlated with other proxy data from less extreme latitudes. Several important takeaways are the following:

  1. Warm periods in the historical record are associated with wet conditions, and cold periods are associated with dry conditions. This is intuitive, as warm air holds more moisture than cold air.
  2. There are estimates of temperatures going back more than 800 million years; apparent cyclical regularities in temperatures have lasted as long 150 million years. Cycles within cycles are evident: a 100,000 year cycle is prominent as well as a 25,000 year cycle (see #4 below).
  3. Today’s temperatures are not as high as those prevailing during about 200 years of the so-called Roman Warm Period, or during a span of similar length in the so-called Minoan Warm Period, about 3,300 years ago. Today’s temperatures are much lower than estimates for much of the earth’s pre-human history.
  4. The southern hemisphere has more volatile temperatures than the northern hemisphere due to the tilt of the earth’s axis at perihelion in January, when the earth is closest to the sun. That means the southern hemisphere tends to have warmer summers and colder winters. That will reverse over the next 10,000 years, and then it will reverse again. There is more land mass in the north, however, so it’s not clear that less extreme weather in the north helps explain the hugely lopsided distribution of development and population in that hemisphere.
  5. Recent increases in sea levels have been small relative to the years following the Little Ice Age. Projected increases over the next 50 years are of a magnitude that should be easily manageable for most coastal areas.
  6. Atmospheric carbon concentration seems to lag major increases in temperatures by about 800 years, raising a question of causality. Today’s carbon concentration is low relative to earlier epochs; it has been increasing for thousands of years, clearly independent of human activity, and is now near 400,000 year highs.
  7. Civilizations have blossomed with warm temperatures and they have collapsed or hit extended periods of retarded progress with declines in temperatures. Human agriculture was born as temperatures rose out of the depths of a glacial period about 10,000-12,000 years ago. Rome flourished during a warm cycle and collapsed as it waned. The Vikings settled in Greenland and Newfoundland during the Medieval Warm Period and were eliminated by the Little Ice Age. May cites a number of other examples of temperature cycles bringing on major shifts in the course of human progress. There are many possible explanations for the decline of past civilizations, but extremely low temperatures, droughts, and lengthy periods of weather inhospitable to agriculture have been important.

The fashion today is to insist that only dramatic changes in our use of energy can avert a global warming catastrophe. It is not clear that any effort by humans to manipulate global temperatures can overcome the natural forces that are always driving temperature change. For that matter, it is not clear that carbon dioxide is a bad thing, or that diverting vast quantities of resources to reduce it would be wise. CO2 is certainly not a pollutant in the normal sense of the word. Here is an excerpt from May’s conclusion in his “4,000 years” article, which speaks volumes:

“First, there is no perfect temperature. Man, even in pre-industrial times, adapted to a variety of temperatures and he has always done better in warm times and worse in cold times. Second, why would anyone want to go back to the pre-industrial climate? The Washington Post says the goal of the Paris Climate Conference was get the world to agree to limit global warming to less than two degrees above pre-industrial temperatures. Pre-industrial times? That’s the Little Ice Age, when it snowed in July, a time of endless war, famine and plague. According to the Greenland ice core proxy data, temperatures 180 years ago were nearly the coldest seen since the end of the last glacial period 10,000 years ago! Why measure our success in combating anthropogenic warming, if there is any such thing, from such an unusually cold time?“

Fitting Data To Models At NOAA

08 Monday Jun 2015

Posted by Nuetzel in Global Warming

≈ 6 Comments

Tags

AGW, Anthony WAtts, Anthropomorphic Global Warming, buoy vs ship temperatures, Carl Beisner, Global Mean Temperature, Global Warming Hiatus, Judith Curry, National Oceanic and Atmospheric Administration, NOAA, Ross McKitrick, Temperature adjustments, Watt's Up With That?

Dilbert Made Up Numbers

If the facts don’t suit your agenda, change them! The 18-year “hiatus” in global warming, which has made a shambles of climate model predictions, is now said to have been based on “incorrect data”, according to researchers at National Oceanic and Atmospheric Administration (NOAA). Translation: they have created new data “adjustments” that tell a story more consistent with their preferred narrative, namely, that man-made carbon emissions are forcing global temperatures upward, more or less steadily. The New York Times’ report on the research took a fairly uncritical tone, despite immediate cautions and rebuttals from a number of authorities. On balance, the NOAA claims seem rather laughable.

Ross McKitrick has an excellent discussion of the NOAA adjustments on the Watts Up With That? blog (WUWT). His post reinforces the difficulty of aggregating temperature data in a meaningful way. A given thermometer in a fixed location can yield drifting temperatures over time due to changes in the surrounding environment, such as urbanization. In addition, weather stations are dispersed in irregular ways with extremely uneven coverage, and even worse, they have come and gone over time. There are gaps in the data that must be filled. There might be international differences in reporting practices as well. Sea surface temperature measurement is subject to even greater uncertainty. They can be broadly classified into temperatures collected on buoys and those collected by ships, and the latter have been taken in a variety of ways, from samples collected in various kinds of buckets, hull sensors, engine room intakes, and deck temperatures. The satellite readings, which are a recent development, are accurate in tracking changes, but the levels must be calibrated to other data. Here’s McKitrick on the measurements taken on ships:

“… in about half the cases people did not record which method was used to take the sample (Hirahari et al. 2014). In some cases they noted that, for example, ERI readings were obtained but they not indicate the depth. Or they might not record the height of the ship when the MAT reading is taken.“

The upshot is that calculating a global mean temperature is a statistical exercise fraught with uncertainty. A calculated mean at any point in time is an estimate of a conceptual value. The estimate is one of many possible estimates around the “true” value. Given the measurement difficulties, any meaningful confidence interval for the true mean would likely be so broad as to render inconsequential the much-discussed temperature trends of the past 50 years.

McKitrick emphasizes the three major changes made by NOAA, all having to do with sea surface temperatures:

  1. NOAA has decided to apply an upward adjustment to bring buoy temperature records into line with ship temperatures. This is curious, because most researchers have concluded that the ship temperatures are subject to greater bias. Also, the frequency of buoy records has been rising as a share of total sea temperature readings.
  2. NOAA added extra weight to the buoy readings, a decision which was unexplained.
  3. They applied a relatively large downward adjustment to temperatures collected by ships during 1998-2000.

Even the difference between the temperatures measured by ships and buoys (0.12 degrees Celsius), taken at face value, has a confidence interval (95%?) that is about 29 times as large as the difference. That adjustments such as those above are made with a straight face is nothing short of preposterous.

A number of other researchers have weighed in on the NOAA adjustments. Carl Beisner summarizes some of this work. He quotes McKitrick as well as Judith Curry:

“I think that uncertainties in global surface temperature anomalies is [sic] substantially understated. The surface temperature data sets that I have confidence in are the UK group and also Berkeley Earth. This short paper in Science is not adequate to explain and explore the very large changes that have been made to the NOAA data set. The global surface temperature datasets are clearly a moving target.“

There are a number of other posts this week on WUWT regarding the NOAA adjustments. Some of the experts, like Judith Curry, emphasize the new disparities created by NOAA’s adjustments with other well-regarded temperature series. It will be interesting to see how these differences are debated. Let’s hope that the discussion is driven wholly by science and not politics, but I fear that the latter will have a major impact on the debate. It has already.

The Stench of Green Desperation

23 Saturday May 2015

Posted by Nuetzel in Global Warming

≈ 1 Comment

Tags

AGW, Forbes, Carbon Emissions, Watt's Up With That?, Sea Ice Extent, Antarctic ice extent, Palmyra, ISIS, Global warming middle east, Polar bear population, Christopher Monckton, NASA satellite data, Coast Guard Academy, Obama Commencement Speech

jimmy_and _barack

“Devastating release of carbon emissions has ancient Syrian city of Palmyra now under ISIS control“.

Tongue in cheek, of course, from Twitchy. But maybe not so much: in his commencement address to graduates of the Coast Guard Academy this week, President Obama took the laughable positions that global warming was a) contributing to unrest in the middle east; and b) is an immediate threat to U.S. national security. He bases this immediacy on climate models that have been not just wrong, but extremely wrong, as well as a series of related distortions. These are rebutted one-by-one in “Does the ‘leader’ of the free world really know so little about climate?” by Christopher Monckton.

Global warming activists are so fond of their scare stories that they just can’t stop, despite a long track record of predictive lousiness. But their sins extend beyond bad predictions to bad data itself. One scare story has the world’s sea-ice extent shrinking drastically, especially in the Arctic. Now, NASA has come clean on this point: updated data from the agency shows that sea ice has not contracted over the past 35 years, it has actually increased somewhat. The data is charted here. From the Forbes link:

“Updated data from NASA satellite instruments reveal the Earth’s polar ice caps have not receded at all since the satellite instruments began measuring the ice caps in 1979. Since the end of 2012, moreover, total polar ice extent has largely remained above the post-1979 average.“

To this day I see posts suggesting that the polar ice caps in a fast melt and that polar bears are increasingly endangered. Both assertions are simply not true. The global polar bear population has recovered from the lows of 50 years ago and is stable. Most regional populations are stable, some are in decline, and some are growing.

Another claim is that that Antarctic ice is melting. In fact, the ice extent around Antarctica is at record levels. There is massive volcanic activity under an area in western Antarctica, where some ice loss has been recorded. That is hardly proof of a man-made carbon-induced effect. Along with the fictitious ice melt, alarming predictions of increased sea levels are often heard. But sea level increases in the past 100 years are minuscule relative to more distant historical episodes.

President Obama is casting about for a legacy other than failure. His signature health care plan is in jeopardy on several fronts, his foreign policy is bumbling (even to a non-interventionist), his economic legacy is weak at best, his legacy of cronyism is legend, and his legacy of debt is gargantuan. As to Obama’s record on the environment, he just might be a slave to defunct climate researchers.

Record Hot Baloney

18 Sunday Jan 2015

Posted by Nuetzel in Global Warming

≈ 3 Comments

Tags

Bob Tisdale, Cartoons By Josh, Climate fraud, El Nino, global warming, NASA, NOAA, Temperature Adjustment, Temperature records, Wall Street Journal, Watt's Up With That?

warmist_year_evah_scr

It’s easy to make big headlines that serve a policy agenda when you can control the process generating “scientific” data. Here’s the latest in an ongoing fraud perpetrated by NASA, NOAA and a few other organizations. The disinformation is happily scooped up and reported by the unsuspecting news media, in this case The Wall Street Journal. The headline says that 2014 was the warmest year on record back to 1980, but there are several important respects in which the report from NASA and NOAA is misleading.

The surface temperature records maintained by NASA and NOAA (and others) utilize the same source data (despite NASA’s claim that the two series are “independent”), but they are heavily adjusted by the respective agencies. We can all probably agree that more recent temperature measurements (the raw data) are more reliable due to the availability of better and more numerous instruments (particularly for ocean surface temperatures). However, combining recent measurements with older data in a way that assures comparability is difficult over more than a few decades. Weather stations come, go, and relocate, environmental conditions around stations change with urbanization and airport expansions, and new measurement techniques are introduced.

Constructing a consistent temperature series over 130+ years at the world or regional level is therefore subject to much controversy. Here is a page with links to several good posts of the problems inherent in these efforts. Data is “infilled” and sometimes deleted, and statistical techniques are often applied in an effort to achieve consistency over time. However, it is curious that the NASA and NOAA adjustments over time seem to pivot around the levels of the 1950s and 1960s, as if to suggest that the temperatures measured in those decades are the most reliable part of the series. Take a look at the “gifs”in this post, which show temperatures before and after adjustments. An apparent consequence of the NASA / NOAA statistical techniques, which may seem even more curious to the casual observer, is that new observations can influence the entire temperature series. That is, adding 2014 temperatures to the series may lead to fresh downward adjustments to 1936 temperatures, if it suits the agencies. By the way, 1936 was a very warm year, but according to these agencies, it’s been getting less warm.

Another fascinating aspect of the report on 2014 temperatures is the obvious attempt to propagandize. This Bob Tisdale post sheds light on three serious omissions in the report and the related effort to “spin” the findings for the press:

1)  The range of uncertainty cited by NOAA in background documents indicates that the small margin (0.04 deg C for NOAA, 0.02 deg C by NASA) by which the reported 2014 global temperature exceeds the previous high is within the confidence interval around the previous high. By their own standard, it was “more unlikely than likely”that the 2014 temperature was the warmest on record, but that is not what the agencies report in their “Highlights.”

2) The report states that “This is the first time since 1990 the high temperature record was broken in the absence of El Niño conditions at any time during the year in the central and eastern equatorial Pacific Ocean….” Yet there were El Nino conditions elsewhere in the Pacific in 2014.

3) “NOAA failed to discuss the actual causes of the elevated global sea surface temperatures in 2014, while making it appear that there was a general warming of the surfaces of the global oceans.”

Tisdale notes elsewhere that the tiny margins of “record warmth” reported by NASA and NOAA contribute to a growing disparity between reported “actual temperatures” and those projected by climate warming models. The “Warmist” community will view the NASA / NOAA findings favorably, as the new “record high” supports their narrative,” providing new fodder for the agenda to end the use of fossil fuels and to regulate activities deemed “unsustainable.” Unfortunately, the misleading reports are likely to seem credible to the general public, which is largely ignorant of the agencies’ rampant manipulation of temperature data.

Hat Tip: Watts Up With That? and cartoonist Josh!

Alluring Apocalypse Keeps Failing To Materialize

31 Wednesday Dec 2014

Posted by Nuetzel in Uncategorized

≈ 3 Comments

Tags

AGW, CATO Institute, Climate Change, Heat Tolerance, Human Adaptation, Indur M. Goklany, IPPC, Sea Ice Extent, Sea Level Changes, Severe Weather, Watt's Up With That?, WHO

6HM3_bad_predictions

Past predictions issued by the global warming community have been spectacularly bad. So bad that “climate change” has replaced “global warming” as the preferred label among adherents. The modelers have constructed something of a false reality, often confusing model predictions with actual data in their “findings”, but faithful followers do not grasp the fiction of that modeled world. Climate models incorporating carbon forcing effects have a poor track record, consistently over-predicting temperatures. Predictions of more severe weather have also failed to pan out. To the contrary, severe weather events such as hurricanes and severe tornadoes have been in a quiet period.

The exaggerated claims extend to such topics as sea-level changes, ocean temperatures, sea ice extent, and a variety of other issues. Some recent warnings are particularly outrageous: A recent study published by the World Health Organization (WHO) claims that anthropomorphic global warming (AGW) will kill 5 million people over the two decades beginning in 2030. It is discussed here at the CATO blog, which quotes a rebuttal by Indur M. Goklany:

“Firstly, [the WHO study] uses climate model results that have been shown to run at least three times hotter than empirical reality (0.15◦C vs 0.04◦C per decade, respectively), despite using 27% lower greenhouse gas forcing.

Secondly, it ignores the fact that people and societies are not potted plants; that they will actually take steps to reduce, if not nullify, real or perceived threats to their life, limb and well-being. …

Finally, the WHO report assumes, erroneously, if the IPCC’s Fifth Assessment Report is to be believed, that carbon dioxide levels above 369 ppm – today we are at 400ppm and may hit 650ppm if the scenario used by the WHO is valid – will have no effect on crop yields.”

So, not only does the WHO study exaggerate risks, but when it comes to human survival, it’s policy prescriptions may have the wrong sign! That is, a warmer climate is more likely to result in improved crop yields, nutrition, and human welfare.

CATO provides further evidence of humanity’s ability to adapt from a recent study of heat stress mortality in the U.S. The CATO author states:

“… the U.S. population has, ‘become more resilient to heat over time’—in this case from 1987 to 2005—led by the country’s astute senior citizens. This discovery, coupled with many other similar findings from all across the world (Idso et al., 2014), adds yet another nail in the coffin of failed IPCC projections of increased heat related mortality in response to the so-called unprecedented warming of the past few decades.”

A so-called “Friday Funny” post from Watt’s Up With That (also linked at the first CATO post above) provides a wonderful compendium of “Over a Century’s Worth of Eco-Climate Predictions and Disinformation,” containing such jewels as the following quotes:

“David Brower, a founder of the Sierra Club: ‘Childbearing should be a punishable crime against society, unless the parents hold a government license. …’

Presidential candidate Barack Obama, January 2008: ‘Under my plan of a cap-and-trade system, electricity rates would necessarily skyrocket. Coal powered plants, you know, natural gas, you name it, whatever the plants were, whatever the industry was, they would have to retrofit their operations. That will cost money. They will pass that money on to consumers.’

Chicago Tribune August 9, 1923: ‘Scientist says Arctic ice will wipe out Canada.’

Kenneth E.F. Watt in ‘Earth Day,’ 1970: ‘If present trends continue, the world will be … eleven degrees colder by the year 2000. This is about twice what it would take to put us in an ice age.’

Michael Oppenheimer in ‘Dead Heat’, 1990: ‘(By) 1995, the greenhouse effect would be desolating the heartlands of North America and Eurasia with horrific drought, causing crop failures and food riots… (By 1996) The Platte River of Nebraska would be dry, while a continent-wide black blizzard of prairie topsoil will stop traffic on interstates, strip paint from houses and shut down computers…’”

Many other bone-headed predictions appear at the link. Sacred Cow Chips has a few previous posts on the topic of AGW.

Needless to say, the media and many pundits love a disaster scenario. The climate warmists seem to understand this and are eager to offer a steady flow of propaganda for the media to offer to the public. They encourage acceptance of an energy poor world and ultimately greater poverty and human suffering. They also encourage an acceptance of state authority and coercive force as the ultimate guarantor of human survival, despite the tenuous evidence of climate risk and a long track record of government failure in addressing social problems.

Follow Sacred Cow Chips on WordPress.com

Recent Posts

  • Conformity and Suppression: How Science Is Not “Done”
  • Grow Or Collapse: Stasis Is Not a Long-Term Option
  • Cassandras Feel An Urgent Need To Crush Your Lifestyle
  • Containing An Online Viper Pit of Antisemites
  • My Christmas With Stagger Lee and Billy DeLyon

Archives

  • January 2023
  • December 2022
  • November 2022
  • October 2022
  • September 2022
  • August 2022
  • July 2022
  • June 2022
  • May 2022
  • April 2022
  • March 2022
  • February 2022
  • January 2022
  • December 2021
  • November 2021
  • October 2021
  • September 2021
  • August 2021
  • July 2021
  • June 2021
  • May 2021
  • April 2021
  • March 2021
  • February 2021
  • January 2021
  • December 2020
  • November 2020
  • October 2020
  • September 2020
  • August 2020
  • July 2020
  • June 2020
  • May 2020
  • April 2020
  • March 2020
  • February 2020
  • January 2020
  • December 2019
  • November 2019
  • October 2019
  • September 2019
  • August 2019
  • July 2019
  • June 2019
  • May 2019
  • April 2019
  • March 2019
  • February 2019
  • January 2019
  • December 2018
  • November 2018
  • October 2018
  • September 2018
  • August 2018
  • July 2018
  • June 2018
  • May 2018
  • April 2018
  • March 2018
  • February 2018
  • January 2018
  • December 2017
  • November 2017
  • October 2017
  • September 2017
  • August 2017
  • July 2017
  • June 2017
  • May 2017
  • April 2017
  • March 2017
  • February 2017
  • January 2017
  • December 2016
  • November 2016
  • October 2016
  • September 2016
  • August 2016
  • July 2016
  • June 2016
  • May 2016
  • April 2016
  • March 2016
  • February 2016
  • January 2016
  • December 2015
  • November 2015
  • October 2015
  • September 2015
  • August 2015
  • July 2015
  • June 2015
  • May 2015
  • April 2015
  • March 2015
  • February 2015
  • January 2015
  • December 2014
  • November 2014
  • October 2014
  • September 2014
  • August 2014
  • July 2014
  • June 2014
  • May 2014
  • April 2014
  • March 2014

Blogs I Follow

  • Ominous The Spirit
  • Passive Income Kickstart
  • OnlyFinance.net
  • TLC Cholesterol
  • Nintil
  • kendunning.net
  • DCWhispers.com
  • Hoong-Wai in the UK
  • Marginal REVOLUTION
  • Stlouis
  • Watts Up With That?
  • Aussie Nationalist Blog
  • American Elephants
  • The View from Alexandria
  • The Gymnasium
  • A Force for Good
  • Notes On Liberty
  • troymo
  • SUNDAY BLOG Stephanie Sievers
  • Miss Lou Acquiring Lore
  • Your Well Wisher Program
  • Objectivism In Depth
  • RobotEnomics
  • Orderstatistic
  • Paradigm Library

Blog at WordPress.com.

Ominous The Spirit

Ominous The Spirit is an artist that makes music, paints, and creates photography. He donates 100% of profits to charity.

Passive Income Kickstart

OnlyFinance.net

Financial Matters!

TLC Cholesterol

Nintil

To estimate, compare, distinguish, discuss, and trace to its principal sources everything

kendunning.net

The future is ours to create.

DCWhispers.com

Hoong-Wai in the UK

A Commonwealth immigrant's perspective on the UK's public arena.

Marginal REVOLUTION

Small Steps Toward A Much Better World

Stlouis

Watts Up With That?

The world's most viewed site on global warming and climate change

Aussie Nationalist Blog

Commentary from a Paleoconservative and Nationalist perspective

American Elephants

Defending Life, Liberty and the Pursuit of Happiness

The View from Alexandria

In advanced civilizations the period loosely called Alexandrian is usually associated with flexible morals, perfunctory religion, populist standards and cosmopolitan tastes, feminism, exotic cults, and the rapid turnover of high and low fads---in short, a falling away (which is all that decadence means) from the strictness of traditional rules, embodied in character and inforced from within. -- Jacques Barzun

The Gymnasium

A place for reason, politics, economics, and faith steeped in the classical liberal tradition

A Force for Good

How economics, morality, and markets combine

Notes On Liberty

Spontaneous thoughts on a humble creed

troymo

SUNDAY BLOG Stephanie Sievers

Escaping the everyday life with photographs from my travels

Miss Lou Acquiring Lore

Gallery of Life...

Your Well Wisher Program

Attempt to solve commonly known problems…

Objectivism In Depth

Exploring Ayn Rand's revolutionary philosophy.

RobotEnomics

(A)n (I)ntelligent Future

Orderstatistic

Economics, chess and anything else on my mind.

Paradigm Library

OODA Looping

  • Follow Following
    • Sacred Cow Chips
    • Join 121 other followers
    • Already have a WordPress.com account? Log in now.
    • Sacred Cow Chips
    • Customize
    • Follow Following
    • Sign up
    • Log in
    • Report this content
    • View site in Reader
    • Manage subscriptions
    • Collapse this bar
 

Loading Comments...