• About

Sacred Cow Chips

Sacred Cow Chips

Tag Archives: Urban Heat Island Effect

Is “Global Temperature” a Fiction?

01 Friday May 2026

Posted by Nuetzel in Climate science, Global Warming

≈ Leave a comment

Tags

ARGO Buoys, Atmospheric CO2, Christopher Essex, Extensive Measure, Global Temperature, GMST, Intensive Measure, IPCC, Jack Salmon, Jonathan Cohler, NOAH, Ocean Acidification, PH, Price Level, Satellite Temperatures, Sea Surface Temperatures, Temperature Averaging, Urban Heat Island Effect, Weather Station Siting

At the heart of the climate crisis narrative lies a huge weakness regarding a thing its believers take for granted: whether our measures of global temperature are meaningful, let alone reliable. The problems are both at the level of individual weather stations, their siting, their geographical distribution, and perhaps even more critically, their aggregation into the so-called Global Mean Surface Temperature (GMST).

The Weather Station Network

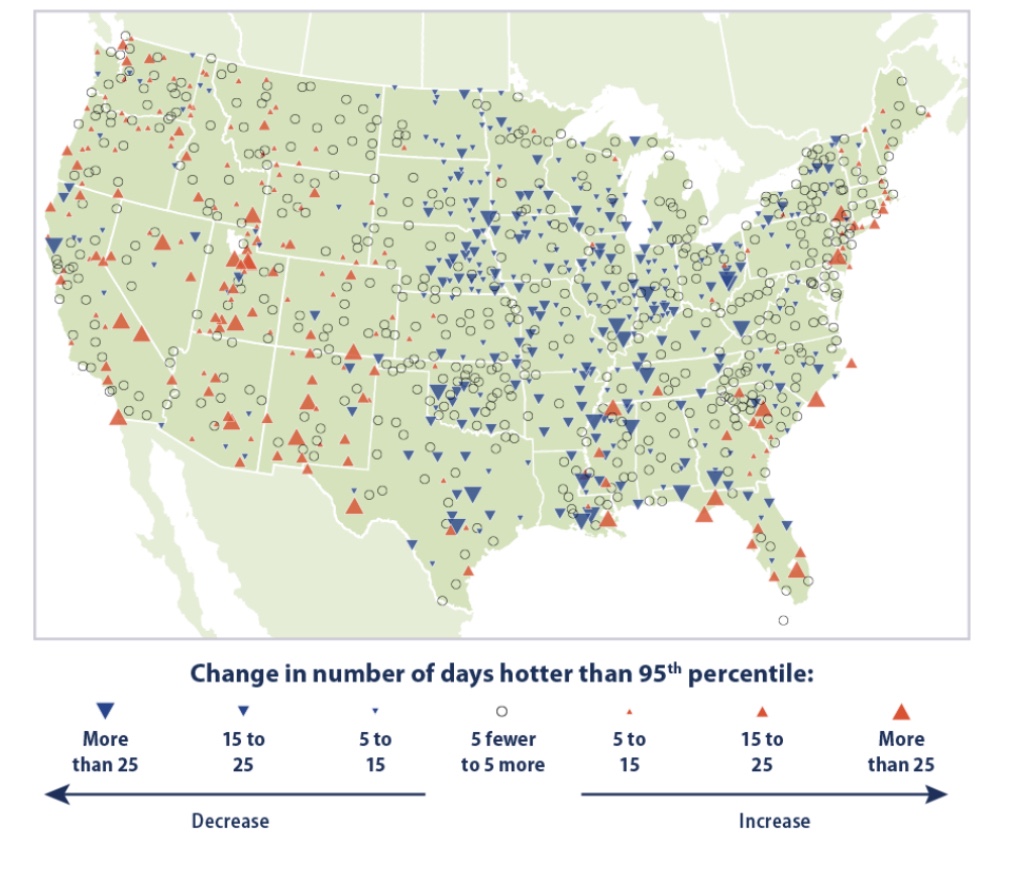
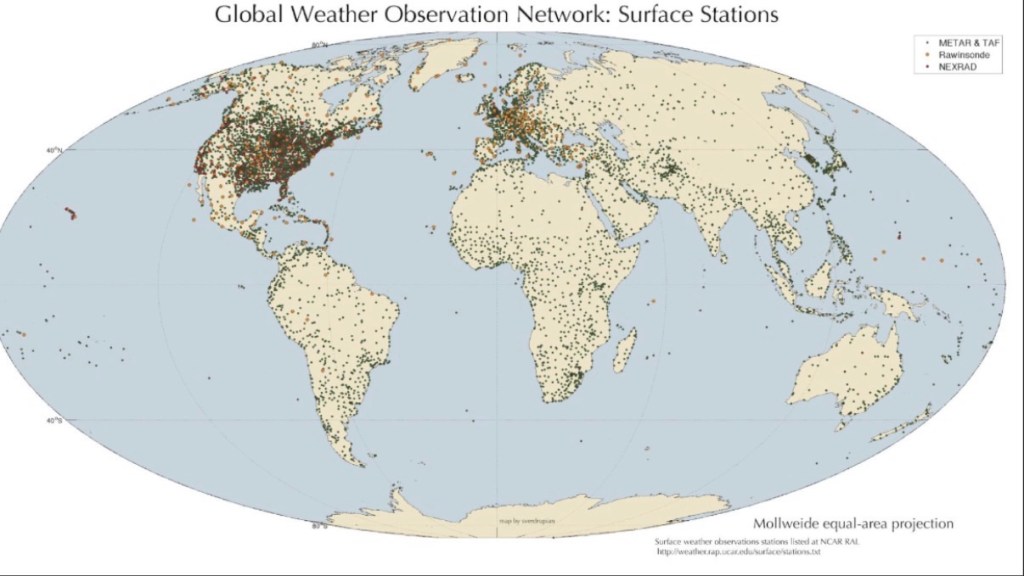
In the U.S. and worldwide we have about one weather station for every one thousand square miles. However, the geographic distribution of weather stations is highly uneven (see the map of land-based stations above) and is more sparse in rural areas than in urban environments. It’s also very sparse in highly remote and extreme environments.

At best, a temperature reading at a particular weather station might be approximately representative of its surrounding area at that moment. However, temperatures from place-to-place are influenced by many varying features of local geography. That includes altitude, the presence of waterways and bodies of water, other surface features such as rock and greenery, and human land use. Thus, conditions at a given weather station might not be at all descriptive of the surrounding area.

Moreover, there are no well-defined geographic “zones” to which weather stations are assigned. Attempts to do so involve arbitrary and irregular boundaries and drastic variations in size. “Averaging” temperatures across such zones requires a crude attempt to assign weights based on distances and ultimately yields mongrelized statistics. Furthermore, daily temperature averages are based on averages of high and low temperatures at each station. Such an average might only describe the actual temperature at a station for an instant, but regardless of duration, the timing is likely to differ across any two stations. Not only that, but many weather stations do not record “daily” temperatures based on normal calendar days. Thus, temperature averages across stations are calculated across locations, extremes only, and time. And again, inputs of temperatures from the individual stations are not representative of their respective zones.

Deterioration in the quality of weather station sites has been the subject of sharp criticism over the years. There are now a large number of poorly-sited stations, often located in close proximity to paved surfaces, concrete, metals, or exhaust fans. These kinds of features impart an upward bias to the local temperature record. Individually, these are small examples of the well-known urban heat island effect. In the aggregate, it creates a substantial exaggeration in temperatures, accounting for about 50% of the estimated warming trend for the U.S.

According to this study, the upward bias is more severe for poorly-sited stations, and the quality of siting often deteriorates over time as urban growth encroaches on outlying communities. Urban sites tend to warm the most, followed by semi-urban sites, followed by rural sites. Even worse, the study found that the NOAH temperature adjustment process creates a contagion of the warming bias, passing biases from poor sites along to better stations as an artifact. That is, the process adjusts temperatures upward for well-sited stations to more closely match poor sites!

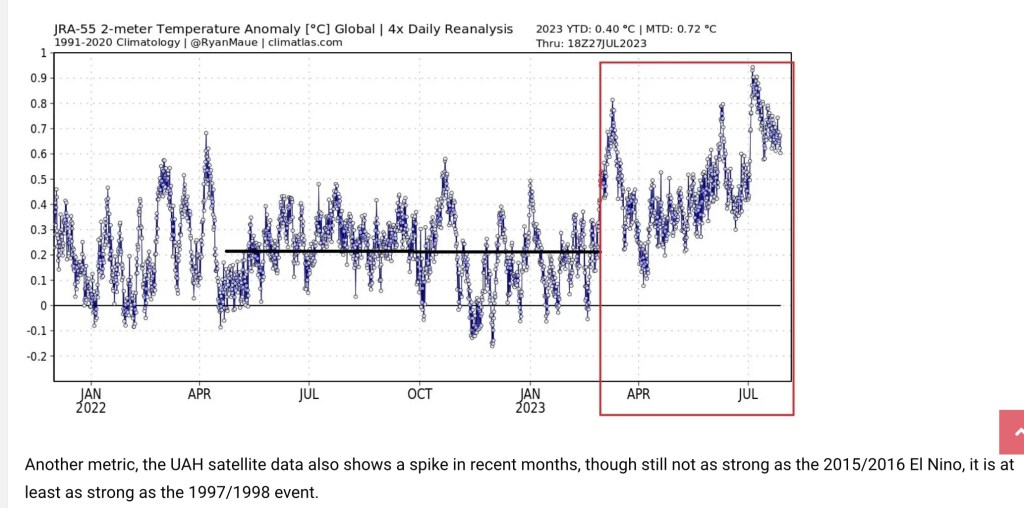
Ocean temperatures present their own challenges. Several different techniques have been used over the years, but the most consistent and reliable ocean temperatures are from so-called ARGO buoys, which have been available only since 2003. Before that, ocean temperatures were taken using buckets dipped into the water from the sides of ships, and from engine water intakes. Unfortunately, error rates on reported observations from ARGO buoys (which involve several factors besides the accuracy of the thermometers themselves, such as transmission errors) are unknown, but they appear to be far outside acceptable limits. Thus, reasonably good sea surface records have only recently contributed to global temperature coverage, and even those are subject to great uncertainty. (Satellite temperature measurements, by the way, are really indirect estimates of temperatures based on radiance and subsequent calibrations.)

Thus, historical temperature records are an amalgam of different measurement instruments at different locations at different times of the day, adding layers of inconsistency to the calculation of temperature averages.

Physically Untethered

I was prompted to write this post after reading a mathematical analysis of the impossibility of aggregating temperature readings across multiple weather stations in any meaningful way. The analysis, by Jonathan Cohler, is a damning indictment of GMST as a concept. It relies on a series of calculations and transformations that are arbitrarily chosen from many unsuitable alternatives. Cohler says that such an “average temperature” calculation is necessarily “untethered” from the various states of nature it attempts to summarize.

Temperature itself is a so-called intensive quantity. That means it is independent of the size of the system it characterizes. If you combine it with an identical twin system, the temperature of the combined whole doesn’t double, unlike measures like mass or volume. The latter are examples of extensive quantities.

Temperatures vary from one spot to another within a given system while in disequilibrium, and of course they vary over the course of any day. However, the validity of a temperature measurement at a particular location and time requires a local state of equilibrium in the immediate vicinity of the measuring instrument. Otherwise, a temperature measurement is would not be a valid descriptor of the condition of the (very local) system.

Faulty Aggregations

With that in mind, imagine the many arbitrary ways we can devise to aggregate temperatures across weather stations for which conditions differ drastically. These are all attempts to calculate a single temperature for a large and geographically uneven system in a continuing state of disequilibrium. And every combination of weather station temperatures represents an artificially combined “system” in a state of disequilibrium. That’s true of any two adjacent weather stations or of all the weather stations on the globe. No one method of doing so can claim validity as a measure of system-wide temperature. This contrasts with extensive quantities, for which well-defined rules of aggregation exist (e.g., summation) regardless of a system’s dynamic condition.

Over time, the temperature records involve a changing number of stations, local environmental conditions, accuracy, and a varying mix of seawater bucket measurements, ship engine water intake measurements, and ARGO floats. These disparities reinforce the impossibility of measuring wide-ranging “average” trends in temperature.

As Cohler demonstrates mathematically, these temperature averages are physically meaningless. He offers a crazy-sounding example of blending two intensive measurements: averaging the PH of your morning coffee with the PH of seawater at a nearby coast. This is very much of a kind with averaging temperatures across weather stations under disparate conditions. Furthermore, as noted above, the steps employed to arrive at the temperature to be used for each station, and the weight each station is assigned in the average, is hardly a unique set of calculations. There is an infinite number of equally invalid aggregations of the same data.

Grand Ambiguity

Cohler is not the first to point out that the concept of a global temperature average is physically meaningless. In 2007, a paper by Christopher Essex, et al was entitled, “Does a Global Temperature Exist?” The abstract states (my brackets):

“Distinct and equally valid [or invalid] statistical rules can and do show opposite trends when applied to the results of computations from physical models and real data in the atmosphere. A given temperature field can be interpreted as both ‘warming’ and ‘cooling’ simultaneously, making the concept of warming in the context of the issue of global warming physically ill-posed.”

This is all the more salient in a world with warming biases at poorly sited weather stations and a strong urban heat island effect.

My Glass House?

Of course, there are other areas in which similar statistical “sins” are common, some of which are also used repeatedly by climate alarmists: ocean water PH, which Cohler explains cannot be averaged across “parcels”. The result is meaningless. If that isn’t enough for you to harbor doubts about the ocean acidification narrative, just read the first few paragraphs of the tweet linked above!

Similar examples occur in the world of economic data. For example, prices are intensive measures, but economists often refer to an aggregate “price level”. Can such a thing truly exist? Simply averaging prices of all goods and services creates a meaningless figure. Each price can be weighted in a variety of ways (e.g., by shares of a fixed or varying “market basket”). There are several prominent alternatives, all of which have strengths and weaknesses, but none has a claim as an accurate measure of “the price level.”

In fact, though economists talk about it constantly, it can be said that “the price level” does not exist as an objective reality, just as there is no “global temperature.” The difference is that economists readily acknowledge this fundamental ambiguity surrounding price aggregation. Some even insist, for example, that only nominal aggregates (e.g., total spending = prices x quantities), rather than inflation in “the price level”, be considered in certain policy domains, though there is more than one reason for that preference. In contrast, climate officialdom, within the likes of such organizations as the IPCC and NOAH, are loath to acknowledge weaknesses in GMST.

Conclusion

There are many reasons to question the climate orthodoxy, which holds that human emissions of carbon dioxide, a trace gas, produce a warming global temperature trend. An issue that’s been largely taken for granted is the integrity of the so-called global temperature, most commonly the GMST. The reality is that it’s impossible to identify a unique method of calculating a global temperature. It’s possible to specify many different aggregations of local temperature readings, but there is no “true” way of measuring global temperature. Another way of putting this is that it’s impossible to define a single global temperature as a physical reality. There is no such thing.

Nevertheless, global temperature is a critical pillar on which climate alarmism rests, and Cohler has published equally damning critiques of several other climate measurements (also see here), such as mean ocean PH, ocean heat content, and human contribution to atmospheric CO2. Climate authorities should acknowledge the inherent weakness of relying on temperature aggregations, and especially any one aggregation. Perhaps they could define several alternatives, as economists have with price indices, acknowledging the impossibility of pinning down a true global temperature.

The real lesson here is that we should approach climate statistics both with skepticism and humility. Even if you must pretend that it exists, any measure of a so-called global temperature and its trend is of highly of uncertain value. This is critical when it comes to assessing climate policy. As Jack Salmon says in a somewhat broader context:

“One of the most striking features of modern climate economics is not consensus, it’s dispersion. Depending on which paper, model, or administration you consult, the economic damages from climate change range from modest to catastrophic.“

Tis the Season of Peak Climate Propaganda

09 Wednesday Aug 2023

Posted by Nuetzel in Climate

≈ 1 Comment

Tags

Björn Lomberg, Climate Change, Cooling the Past, Dust Bowl, El Nino, EPA, global warming, Heat Wave Index, Heat Waves, Hunga Tonga, Lancet, NASA, PBS News Hour, Satellite Temperatures, Thermometer Sitings, Urban Heat Island Effect, Water Temperatures, Water Vapor, Wildfires

It happens every summer! It’s been hot, and the news media and professional grifters in the anti-carbon climate-change establishment want us to panic about it. Granted, the weather really was quite hot for several weeks in July across parts of the U.S., Europe, and elsewhere, but it’s cooled off considerably since then, especially in my neck of the woods.

July is typically the warmest month of the year, and July 2023 was the warmest July for the troposphere on the satellite record. (The troposphere is the lowest 13 km of the atmosphere, but that’s an average — it’s thicker toward equatorial latitudes, thinner toward the poles.) However, attribution of this summer’s heat waves to carbon-induced climate change is misplaced. What follows are a few considerations in evaluating this claim, and the lengths to which climate activists go to distort weather data and reporting.

The Biggest Greenhouse Gas

One speculative explanation for the recent heat wave has gained some traction: the eruption of the Hunga Tonga-Hunga Ha’apai volcano in the South Pacific on Jan. 15, 2022 (and see here). This underwater eruption spewed massive quantities of water vapor into the stratosphere, which encircled the globe in fairly short order. Water vapor acts as a greenhouse gas, and it is by far the most important greenhouse gas. This plume of vapor may have affected the climate with a delay, and it is not expected to dissipate for at least a couple of years. However, there are theories that the eruption might have led to some offsetting effects due to the reflective properties of water and ice in the stratosphere. See here for an interesting debate on the estimated effects of this “shock” to the atmosphere.

NASA has estimated that the Hunga Tonga eruption resulted in a 10% increase in atmospheric water vapor, while the European Space Agency puts the increase at 13%. Now, in addition to this added water vapor, we have the early effects of an El Niño event in the Pacific, which may elevate temperatures over the next couple of years.

However, the temperatures in July simply don’t justify the claim that we’re experiencing “unprecedented” warmth. The satellite records go back only to 1979, which is an especially narrow window on climatological scales. The longer record of temperatures shows earlier periods of higher temperatures, For example, U.S. surface temperature records indicate that the 1930s had periods warmer than this July. Moreover, while estimates of paleo-climate data are a matter of great dispute, there is no question that the globe has experienced warmer temperatures in the past, with an ice-free Arctic.

So, was July 3 really the hottest day in history? No way, and the worst part of this warm spell wasn’t even the warmth. Rather, it was the attempts to make weather a political matter, as if public policymakers possess some kind of control knob over weather phenomena, or as if we should bestow upon them dictatorial powers to act on their fantasy.

Longer Trends

There’s plenty of other evidence running contrary to the “hotter-than-any-time in-history” foolishness. Take a look at trends in hot and cool weather from individual U.S. weather stations over a somewhat longer time span than the satellite record. The red symbols shown on the map below mark stations reporting increases in the number of unusually hot days (heat in the 95th percentile) between 1948 – 2020, with larger symbols corresponding to greater increases in extremely hot days. The blue symbols mark stations reporting increases in the number of unusually cool days (in the 5th percentile) over the same period. The data in this chart is published by the EPA, and it is definitely not alarming.

The next chart shows the so-called Heat Wave Index produced by the EPA. Recent spikes in the index are muted relative to the Dust Bowl days of the 1930s.

Journalism or Exaggeration?

Reports of hot weather in Europe have been distorted as well, often placing more emphasis on forecasts of high temperatures than on the temperatures themselves. It’s almost as if authorities, with the aid of the news media and naive weather reporters, are determined to raise an exaggerated sense of alarm among the citizenry. Almost?

Cold 10x Deadlier Than Heat

The next chart vividly illustrates an attempt to propagandize climate misinformation. Take a look at the left side of this illustration, which appeared in the medical journal Lancet. Note the difference in the horizontal scale for heat deaths vs. cold deaths. The chart on the right side uses equivalent scales for heat vs. cold deaths. This should qualify the journal for some kind of award for mendacity, or perhaps sheer stupidity. It’s the cold that really kills, not the heat! I’m moving south!

Finding Hot Water

And here’s a take-down of some incredible water temperature propaganda. A PBS News Hour reporter has pushed claims that South Florida water temperatures reached 101 degrees this summer. The emphasis on a single reading was taken from a buoy not subject to the cooling effects of deep water circulation, and it is located where fresh water often overlays salt water, which traps heat. Data from other buoys not far away showed much lower temperatures.

Spreads Like Wildfire

Another fallacious claim we hear too often is that global warming is literally causing the world to go up in flames. The facts run contrary to these scare stories. Björn Lomborg notes the following:

“For more than two decades, satellites have recorded fires across the planet’s surface. The data are unequivocal: Since the early 2000s, when 3% of the world’s land caught fire, the area burned annually has trended downward.

“In 2022, the last year for which there are complete data, the world hit a new record-low of 2.2% burned area. Yet you’ll struggle to find that reported anywhere.”

The heavy focus by the media on this year’s wild fires in North America offers a perfect example of the media’s tendency to “cherry pick for clicks”. Africa and Europe have had little burning this year, and in North America, arson has played a conspicuous role (and see here) in the wildfires.

Distorted Measurements

Personally, I have trouble accepting claims that temperatures are any warmer now than they were in my youth, at least where I grew up. My subjective and local assessment aside, there are strong reasons to doubt the reliability and significance of trends in official temperature records. The urban heat-island effect has distorted temperatures by ever greater magnitudes, as growing metropolitan areas absorb heat readily compared to rural green space.

Furthermore, poor siting of weather stations and temperature gauges has become all too common. This includes equipment located at airports and other areas in close proximity to asphalt or concrete. This contributes to an upward bias in more recent temperature data. It’s also worth noting in this context that satellite temperature readings must be calibrated periodically to surface temperatures. If the latter are corrupted in any way, the satellite readings may be corrupted as well.

“Adjusting” the Past

Official historical records also include a variety of “adjustments” to temperature data that raise concerns. Ostensibly, these adjustments are justified by an interest in maintaining a consistent historical record. Changes in equipment or it’s exact location can create discontinuities, for example. Unfortunately, the adjustments appear to have had a systematic tendency to “cool the past” relative to more recent data. This reinforcement of the warming trend over the past few decades is suspicious, to say the least. It does very little to build confidence in the agencies responsible for these records.

Conclusion

The hot temperatures in July brought the usual deluge of propaganda, including distortions in the reporting of weather phenomena. And we hear increasing calls to force transition to EVs (which are powered mostly by fossil-fuel electric plants), subsidize intermittent renewable power sources, and to end the use of air conditioning and gas stoves. Yet these coercive measures would do nothing to prevent summer heat or climate change generally. Water vapor represents 95% of greenhouse gases, and the huge vapor shock from the Hunga Tonga eruption might well make us prone to warmer temperatures for at least some months to come, mixed with signals from the Pacific El Niño pattern. But these are not evidence of a man-made crisis, despite perverse cheers from those rooting for more draconian state intrusions and an end to growth, or indeed, a reversal in gains to human well being.

Follow Sacred Cow Chips on WordPress.com

Recent Posts

  • Is “Global Temperature” a Fiction?
  • ESG Contortions: Virtue, Returns, and Politics
  • Grading Trump II, So Far
  • A Warsh Policy Scenario At the Federal Reserve
  • The Coexistence of Labor and AI-Augmented Capital

Archives

  • May 2026
  • April 2026
  • March 2026
  • February 2026
  • January 2026
  • December 2025
  • November 2025
  • October 2025
  • September 2025
  • August 2025
  • July 2025
  • June 2025
  • May 2025
  • April 2025
  • March 2025
  • February 2025
  • January 2025
  • December 2024
  • November 2024
  • October 2024
  • September 2024
  • August 2024
  • July 2024
  • June 2024
  • May 2024
  • April 2024
  • March 2024
  • February 2024
  • January 2024
  • December 2023
  • November 2023
  • August 2023
  • July 2023
  • June 2023
  • May 2023
  • April 2023
  • March 2023
  • February 2023
  • January 2023
  • December 2022
  • November 2022
  • October 2022
  • September 2022
  • August 2022
  • July 2022
  • June 2022
  • May 2022
  • April 2022
  • March 2022
  • February 2022
  • January 2022
  • December 2021
  • November 2021
  • October 2021
  • September 2021
  • August 2021
  • July 2021
  • June 2021
  • May 2021
  • April 2021
  • March 2021
  • February 2021
  • January 2021
  • December 2020
  • November 2020
  • October 2020
  • September 2020
  • August 2020
  • July 2020
  • June 2020
  • May 2020
  • April 2020
  • March 2020
  • February 2020
  • January 2020
  • December 2019
  • November 2019
  • October 2019
  • September 2019
  • August 2019
  • July 2019
  • June 2019
  • May 2019
  • April 2019
  • March 2019
  • February 2019
  • January 2019
  • December 2018
  • November 2018
  • October 2018
  • September 2018
  • August 2018
  • July 2018
  • June 2018
  • May 2018
  • April 2018
  • March 2018
  • February 2018
  • January 2018
  • December 2017
  • November 2017
  • October 2017
  • September 2017
  • August 2017
  • July 2017
  • June 2017
  • May 2017
  • April 2017
  • March 2017
  • February 2017
  • January 2017
  • December 2016
  • November 2016
  • October 2016
  • September 2016
  • August 2016
  • July 2016
  • June 2016
  • May 2016
  • April 2016
  • March 2016
  • February 2016
  • January 2016
  • December 2015
  • November 2015
  • October 2015
  • September 2015
  • August 2015
  • July 2015
  • June 2015
  • May 2015
  • April 2015
  • March 2015
  • February 2015
  • January 2015
  • December 2014
  • November 2014
  • October 2014
  • September 2014
  • August 2014
  • July 2014
  • June 2014
  • May 2014
  • April 2014
  • March 2014

Blogs I Follow

  • Passive Income Kickstart
  • OnlyFinance.net
  • TLC Cholesterol
  • Nintil
  • kendunning.net
  • DCWhispers.com
  • Hoong-Wai in the UK
  • Marginal REVOLUTION
  • Stlouis
  • Watts Up With That?
  • American Elephants
  • The View from Alexandria
  • The Gymnasium
  • A Force for Good
  • Notes On Liberty
  • troymo
  • SUNDAY BLOG Stephanie Sievers
  • Miss Lou Acquiring Lore
  • Your Well Wisher Program
  • Objectivism In Depth
  • RobotEnomics
  • Orderstatistic
  • Paradigm Library
  • Scattered Showers and Quicksand
  • Jam Review

Blog at WordPress.com.

Passive Income Kickstart

OnlyFinance.net

TLC Cholesterol

Nintil

To estimate, compare, distinguish, discuss, and trace to its principal sources everything

kendunning.net

The Future is Ours to Create

DCWhispers.com

Hoong-Wai in the UK

A Commonwealth immigrant's perspective on the UK's public arena.

Marginal REVOLUTION

Small Steps Toward A Much Better World

Stlouis

Watts Up With That?

The world's most viewed site on global warming and climate change

American Elephants

Defending Life, Liberty and the Pursuit of Happiness

The View from Alexandria

In advanced civilizations the period loosely called Alexandrian is usually associated with flexible morals, perfunctory religion, populist standards and cosmopolitan tastes, feminism, exotic cults, and the rapid turnover of high and low fads---in short, a falling away (which is all that decadence means) from the strictness of traditional rules, embodied in character and inforced from within. -- Jacques Barzun

The Gymnasium

A place for reason, politics, economics, and faith steeped in the classical liberal tradition

A Force for Good

How economics, morality, and markets combine

Notes On Liberty

Spontaneous thoughts on a humble creed

troymo

SUNDAY BLOG Stephanie Sievers

Escaping the everyday life with photographs from my travels

Miss Lou Acquiring Lore

Gallery of Life...

Your Well Wisher Program

Attempt to solve commonly known problems…

Objectivism In Depth

Exploring Ayn Rand's revolutionary philosophy.

RobotEnomics

(A)n (I)ntelligent Future

Orderstatistic

Economics, chess and anything else on my mind.

Paradigm Library

OODA Looping

Scattered Showers and Quicksand

Musings on science, investing, finance, economics, politics, and probably fly fishing.

Jam Review

"If you get confused, listen to the music play."

  • Subscribe Subscribed
    • Sacred Cow Chips
    • Join 128 other subscribers
    • Already have a WordPress.com account? Log in now.
    • Sacred Cow Chips
    • Subscribe Subscribed
    • Sign up
    • Log in
    • Report this content
    • View site in Reader
    • Manage subscriptions
    • Collapse this bar

Loading Comments...