Tags
Björn Lomberg, Climate Change, Cooling the Past, Dust Bowl, El Nino, EPA, global warming, Heat Wave Index, Heat Waves, Hunga Tonga, Lancet, NASA, PBS News Hour, Satellite Temperatures, Thermometer Sitings, Urban Heat Island Effect, Water Temperatures, Water Vapor, Wildfires
It happens every summer! It’s been hot, and the news media and professional grifters in the anti-carbon climate-change establishment want us to panic about it. Granted, the weather really was quite hot for several weeks in July across parts of the U.S., Europe, and elsewhere, but it’s cooled off considerably since then, especially in my neck of the woods.
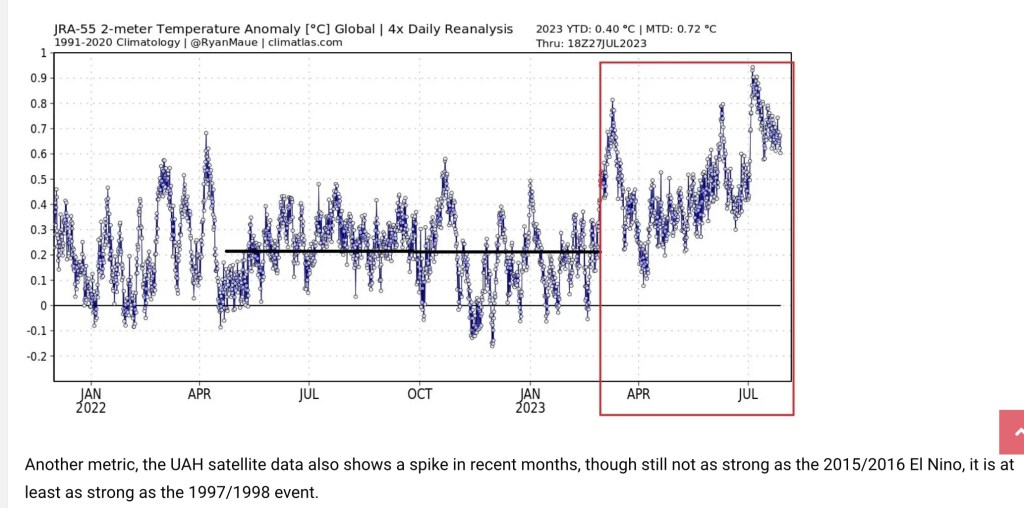
July is typically the warmest month of the year, and July 2023 was the warmest July for the troposphere on the satellite record. (The troposphere is the lowest 13 km of the atmosphere, but that’s an average — it’s thicker toward equatorial latitudes, thinner toward the poles.) However, attribution of this summer’s heat waves to carbon-induced climate change is misplaced. What follows are a few considerations in evaluating this claim, and the lengths to which climate activists go to distort weather data and reporting.
The Biggest Greenhouse Gas
One speculative explanation for the recent heat wave has gained some traction: the eruption of the Hunga Tonga-Hunga Ha’apai volcano in the South Pacific on Jan. 15, 2022 (and see here). This underwater eruption spewed massive quantities of water vapor into the stratosphere, which encircled the globe in fairly short order. Water vapor acts as a greenhouse gas, and it is by far the most important greenhouse gas. This plume of vapor may have affected the climate with a delay, and it is not expected to dissipate for at least a couple of years. However, there are theories that the eruption might have led to some offsetting effects due to the reflective properties of water and ice in the stratosphere. See here for an interesting debate on the estimated effects of this “shock” to the atmosphere.
NASA has estimated that the Hunga Tonga eruption resulted in a 10% increase in atmospheric water vapor, while the European Space Agency puts the increase at 13%. Now, in addition to this added water vapor, we have the early effects of an El Niño event in the Pacific, which may elevate temperatures over the next couple of years.
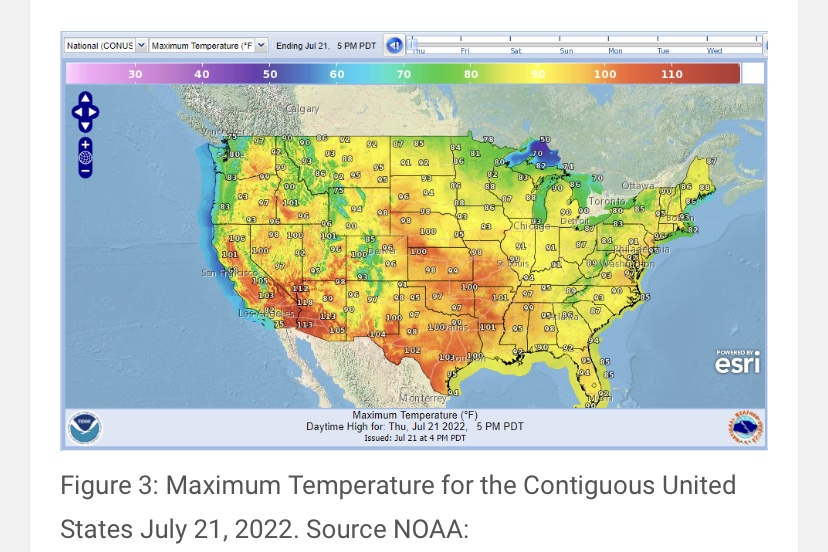
However, the temperatures in July simply don’t justify the claim that we’re experiencing “unprecedented” warmth. The satellite records go back only to 1979, which is an especially narrow window on climatological scales. The longer record of temperatures shows earlier periods of higher temperatures, For example, U.S. surface temperature records indicate that the 1930s had periods warmer than this July. Moreover, while estimates of paleo-climate data are a matter of great dispute, there is no question that the globe has experienced warmer temperatures in the past, with an ice-free Arctic.
So, was July 3 really the hottest day in history? No way, and the worst part of this warm spell wasn’t even the warmth. Rather, it was the attempts to make weather a political matter, as if public policymakers possess some kind of control knob over weather phenomena, or as if we should bestow upon them dictatorial powers to act on their fantasy.
Longer Trends
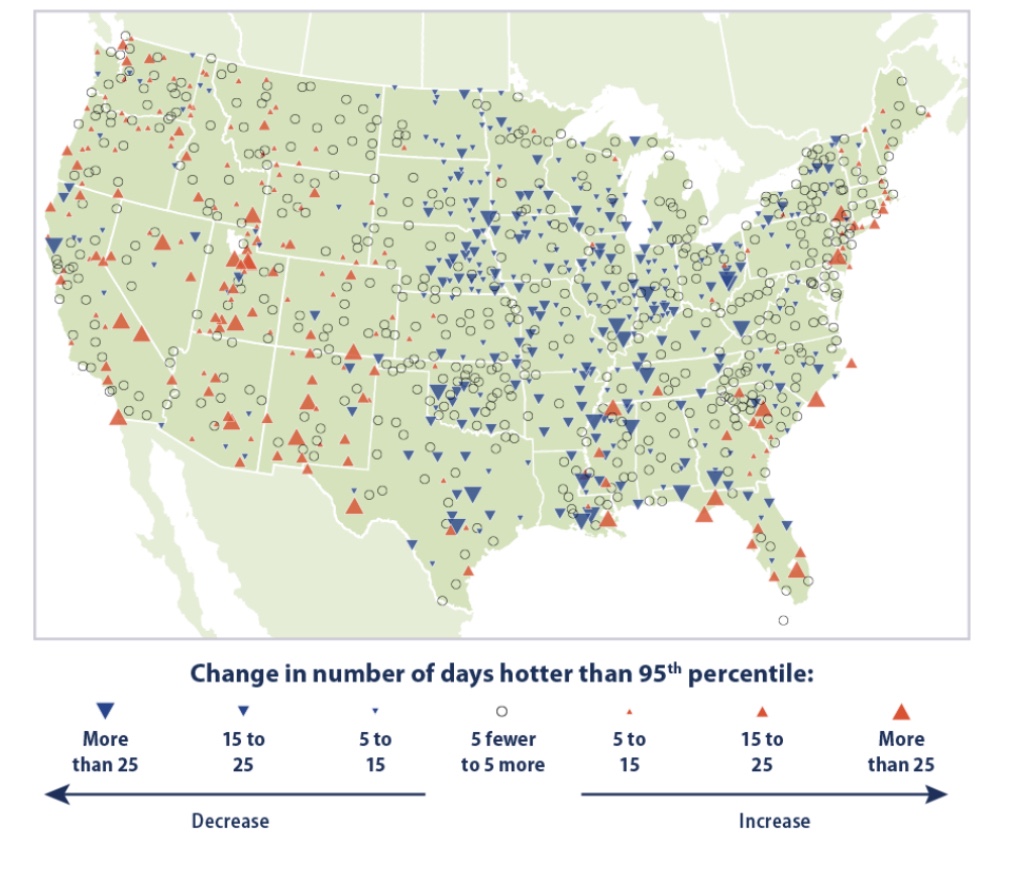
There’s plenty of other evidence running contrary to the “hotter-than-any-time in-history” foolishness. Take a look at trends in hot and cool weather from individual U.S. weather stations over a somewhat longer time span than the satellite record. The red symbols shown on the map below mark stations reporting increases in the number of unusually hot days (heat in the 95th percentile) between 1948 – 2020, with larger symbols corresponding to greater increases in extremely hot days. The blue symbols mark stations reporting increases in the number of unusually cool days (in the 5th percentile) over the same period. The data in this chart is published by the EPA, and it is definitely not alarming.
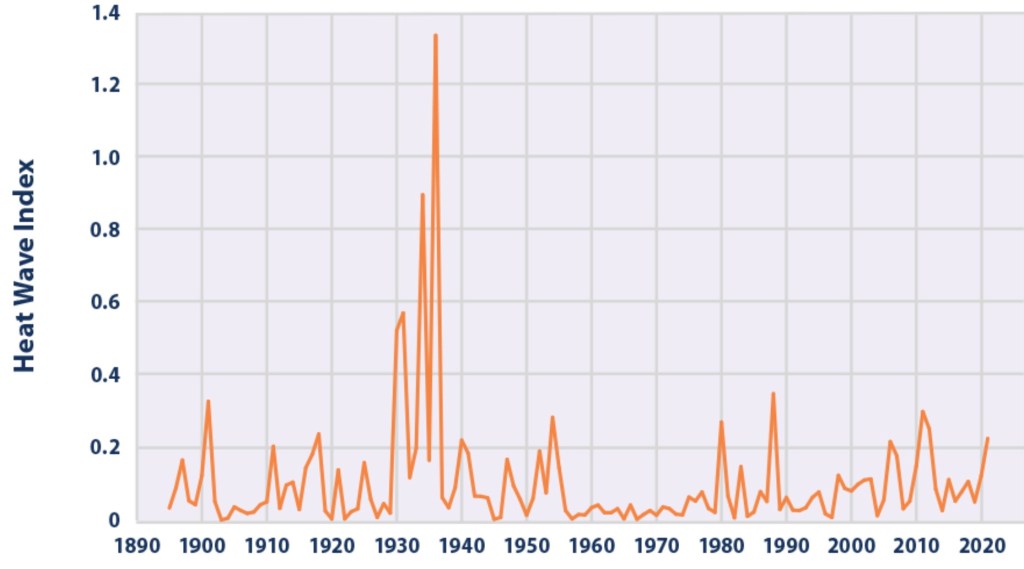
The next chart shows the so-called Heat Wave Index produced by the EPA. Recent spikes in the index are muted relative to the Dust Bowl days of the 1930s.
Journalism or Exaggeration?
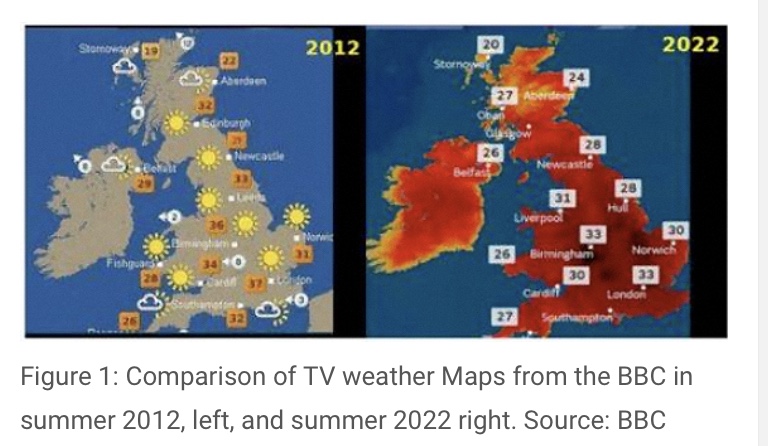
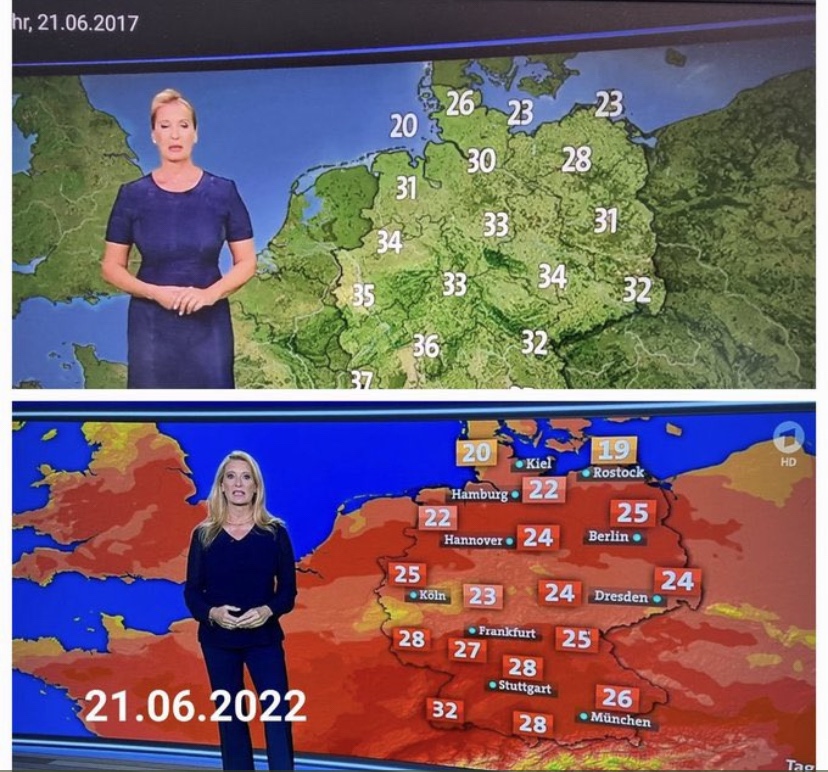
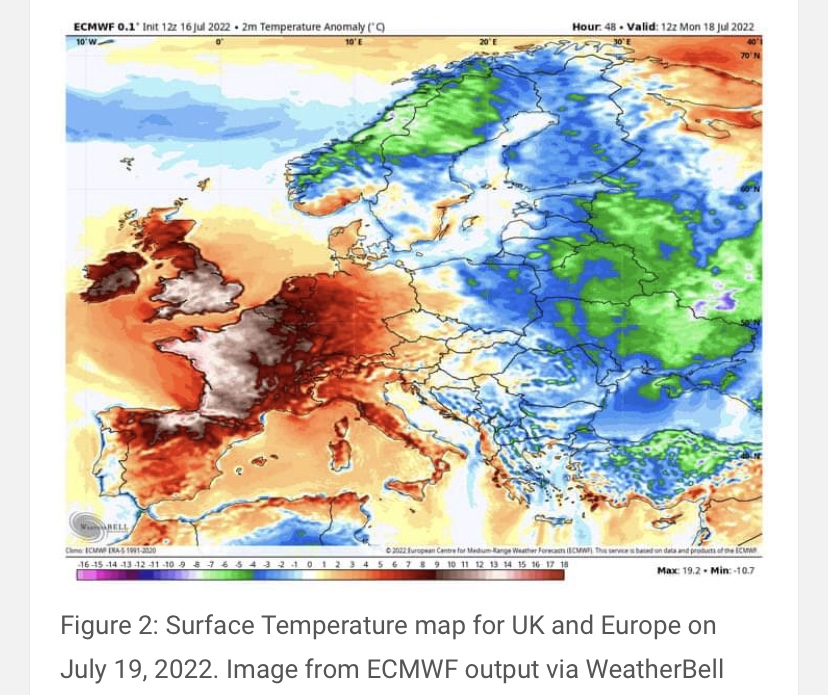
Reports of hot weather in Europe have been distorted as well, often placing more emphasis on forecasts of high temperatures than on the temperatures themselves. It’s almost as if authorities, with the aid of the news media and naive weather reporters, are determined to raise an exaggerated sense of alarm among the citizenry. Almost?
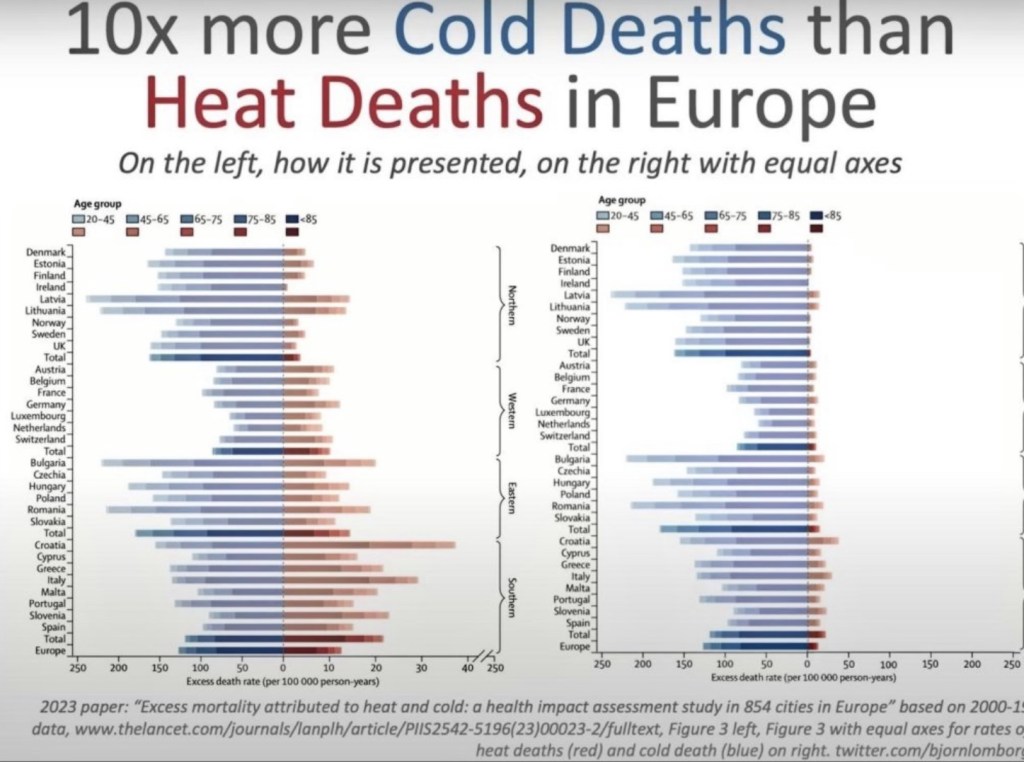
Cold 10x Deadlier Than Heat
The next chart vividly illustrates an attempt to propagandize climate misinformation. Take a look at the left side of this illustration, which appeared in the medical journal Lancet. Note the difference in the horizontal scale for heat deaths vs. cold deaths. The chart on the right side uses equivalent scales for heat vs. cold deaths. This should qualify the journal for some kind of award for mendacity, or perhaps sheer stupidity. It’s the cold that really kills, not the heat! I’m moving south!
Finding Hot Water
And here’s a take-down of some incredible water temperature propaganda. A PBS News Hour reporter has pushed claims that South Florida water temperatures reached 101 degrees this summer. The emphasis on a single reading was taken from a buoy not subject to the cooling effects of deep water circulation, and it is located where fresh water often overlays salt water, which traps heat. Data from other buoys not far away showed much lower temperatures.
Spreads Like Wildfire
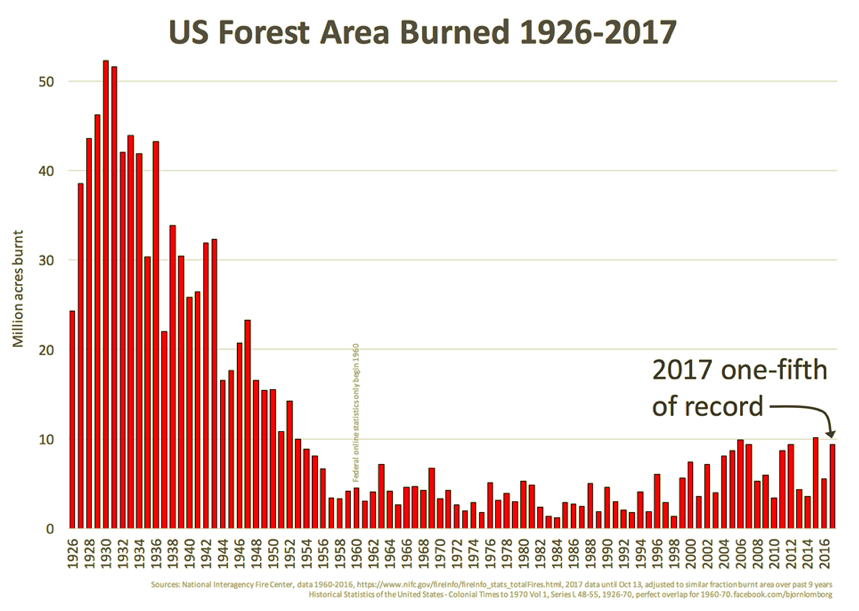
Another fallacious claim we hear too often is that global warming is literally causing the world to go up in flames. The facts run contrary to these scare stories. Björn Lomborg notes the following:
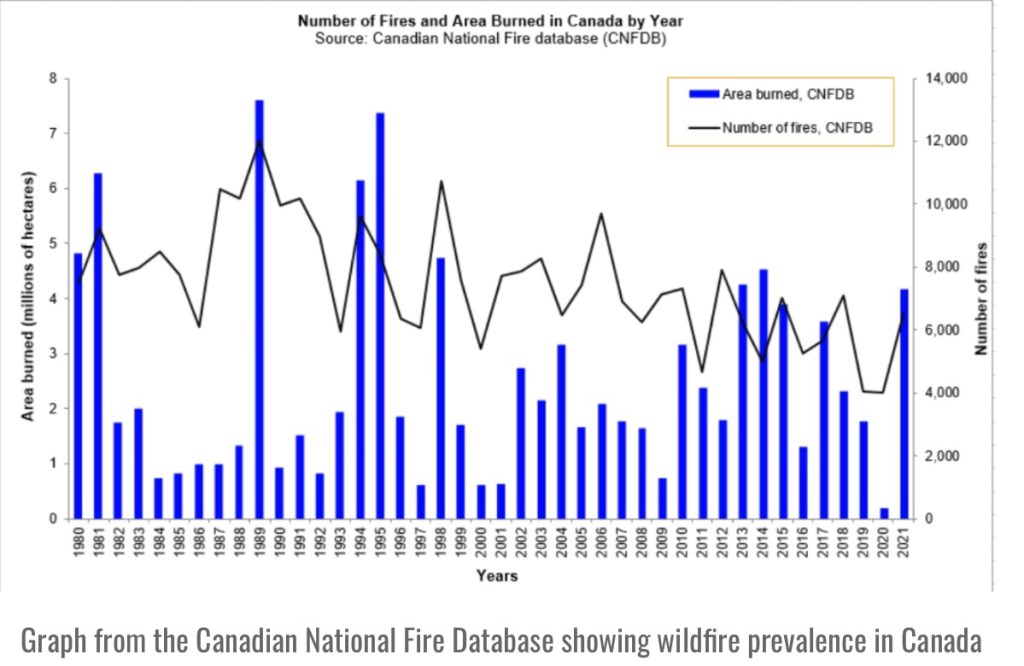
“For more than two decades, satellites have recorded fires across the planet’s surface. The data are unequivocal: Since the early 2000s, when 3% of the world’s land caught fire, the area burned annually has trended downward.
“In 2022, the last year for which there are complete data, the world hit a new record-low of 2.2% burned area. Yet you’ll struggle to find that reported anywhere.”
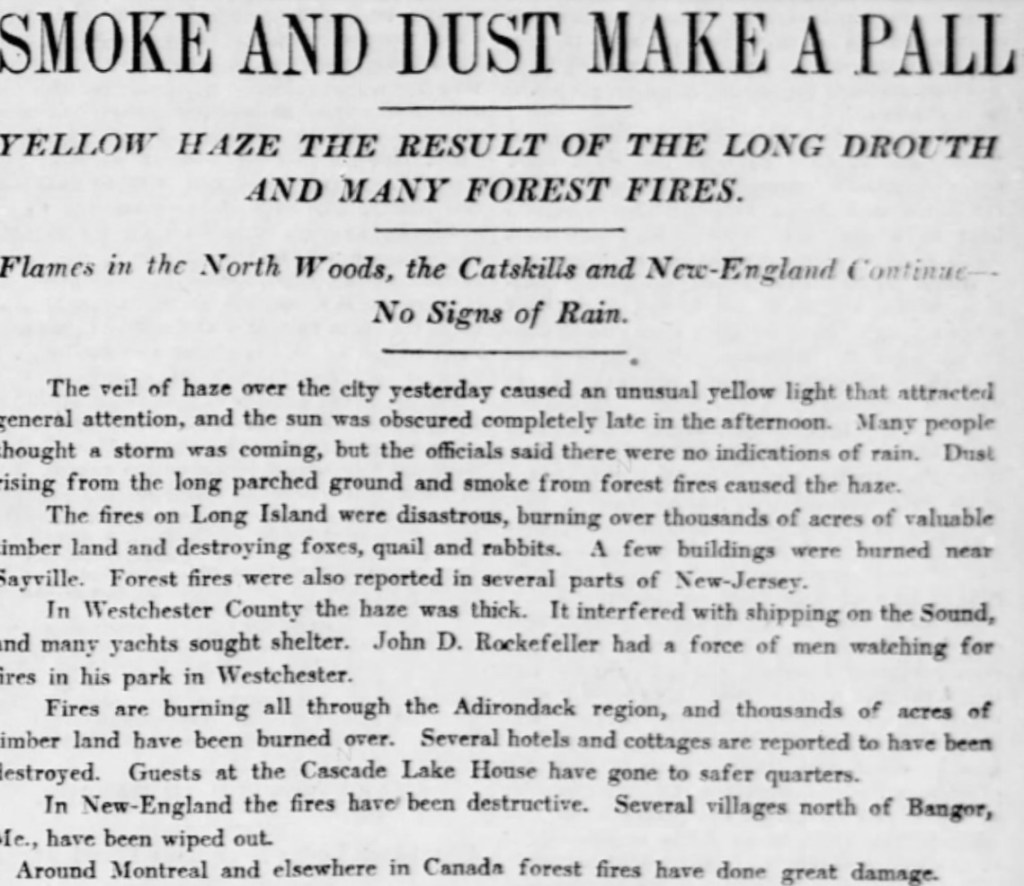
The heavy focus by the media on this year’s wild fires in North America offers a perfect example of the media’s tendency to “cherry pick for clicks”. Africa and Europe have had little burning this year, and in North America, arson has played a conspicuous role (and see here) in the wildfires.
Distorted Measurements
Personally, I have trouble accepting claims that temperatures are any warmer now than they were in my youth, at least where I grew up. My subjective and local assessment aside, there are strong reasons to doubt the reliability and significance of trends in official temperature records. The urban heat-island effect has distorted temperatures by ever greater magnitudes, as growing metropolitan areas absorb heat readily compared to rural green space.
Furthermore, poor siting of weather stations and temperature gauges has become all too common. This includes equipment located at airports and other areas in close proximity to asphalt or concrete. This contributes to an upward bias in more recent temperature data. It’s also worth noting in this context that satellite temperature readings must be calibrated periodically to surface temperatures. If the latter are corrupted in any way, the satellite readings may be corrupted as well.
“Adjusting” the Past
Official historical records also include a variety of “adjustments” to temperature data that raise concerns. Ostensibly, these adjustments are justified by an interest in maintaining a consistent historical record. Changes in equipment or it’s exact location can create discontinuities, for example. Unfortunately, the adjustments appear to have had a systematic tendency to “cool the past” relative to more recent data. This reinforcement of the warming trend over the past few decades is suspicious, to say the least. It does very little to build confidence in the agencies responsible for these records.
Conclusion
The hot temperatures in July brought the usual deluge of propaganda, including distortions in the reporting of weather phenomena. And we hear increasing calls to force transition to EVs (which are powered mostly by fossil-fuel electric plants), subsidize intermittent renewable power sources, and to end the use of air conditioning and gas stoves. Yet these coercive measures would do nothing to prevent summer heat or climate change generally. Water vapor represents 95% of greenhouse gases, and the huge vapor shock from the Hunga Tonga eruption might well make us prone to warmer temperatures for at least some months to come, mixed with signals from the Pacific El Niño pattern. But these are not evidence of a man-made crisis, despite perverse cheers from those rooting for more draconian state intrusions and an end to growth, or indeed, a reversal in gains to human well being.