Tags
Carbon Forcing Models, carbon Sensitivity, Climate Alarmism, Geophysical Fluid Dynamics Laboratory, Glenn Reynolds, Greenhouse Gases, Hurricane Ian, Hurricane Models, IPCC, Model Calibration, Named Storms, National Hurricane Center, National Oceanic and Atmospheric Administration, Neil L. Frank, NOAA, Paul Driessen, Roger Pielke Jr., Ron DeSantis, Ryan Maue, Satellite Data, Tropical Cyclones
There was deep disappointment among political opponents of Florida Governor Ron DeSantis at their inability to pin blame on him for Hurricane Ian’s destruction. It was a terrible hurricane, but they so wanted it to be “Hurricane Hitler”, as Glenn Reynolds noted with tongue in cheek. That just didn’t work out for them, given DeSantis’ competent performance in marshaling resources for aid and cleanup from the storm. Their last ditch refuge was to condemn DeSantis for dismissing the connection they presume to exist between climate change and hurricane frequency and intensity. That criticism didn’t seem to stick, however, and it shouldn’t.
There is no linkage to climate change in actual data on tropical cyclones. It is a myth. Yes, models of hurricane activity have been constructed that embed assumptions leading to predictions of more hurricanes, and more intense hurricanes, as temperatures rise. But these are models constructed as simplified representations of hurricane development. The following quote from the climate modelers at the Geophysical Fluid Dynamics Laboratory (GFDL) (a division of the National Oceanic and Atmospheric Administration (NOAA)) is straightforward on this point (emphases are mine):
“Through research, GFDL scientists have concluded that it is premature to attribute past changes in hurricane activity to greenhouse warming, although simulated hurricanes tend to be more intense in a warmer climate. Other climate changes related to greenhouse warming, such as increases in vertical wind shear over the Caribbean, lead to fewer yet more intense hurricanes in the GFDL model projections for the late 21st century.
Models typically are said to be “calibrated” to historical data, but no one should take much comfort in that. As a long-time econometric modeler myself, I can say without reservation that such assurances are flimsy, especially with respect to “toy models” containing parameters that aren’t directly observable in the available data. In such a context, a modeler can take advantage of tremendous latitude in choosing parameters to include, sensitivities to assume for unknowns or unmeasured relationships, and historical samples for use in “calibration”. Sad to say, modelers can make these models do just about anything they want. The cautious approach to claims about model implications is a credit to GFDL.
Before I get to the evidence on hurricanes, it’s worth remembering that the entire edifice of climate alarmism relies not just on the temperature record, but on models based on other assumptions about the sensitivity of temperatures to CO2 concentration. The models relied upon to generate catastrophic warming assume very high sensitivity, and those models have a very poor track record of prediction. Estimates of sensitivity are highly uncertain, and this article cites research indicating that the IPCC’s assumptions about sensitivity are about 50% too high. And this article reviews recent findings that carbon sensitivity is even lower, about one-third of what many climate models assume. In addition, this research finds that sensitivities are nearly impossible to estimate from historical data with any precision because the record is plagued by different sources and types of atmospheric forcings, accompanying aerosol effects on climate, and differing half-lives of various greenhouse gases. If sensitivities are as low as discussed at the links above, it means that predictions of warming have been grossly exaggerated.
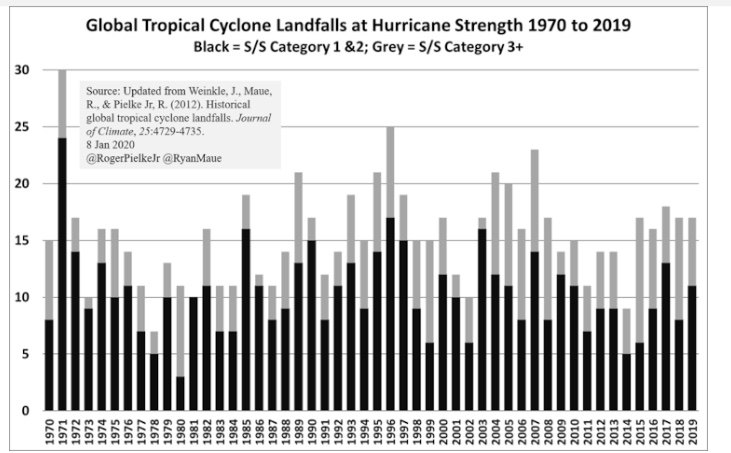
The evidence that hurricanes have become more frequent or severe, or that they now intensify more rapidly, is basically nonexistent. Ryan Maue and Roger Pielke Jr. of the University of Colorado have both researched hurricanes extensively for many years. They described their compilation of data on land-falling hurricanes in this Forbes piece in 2020. They point out that hurricane activity in older data is much more likely to be missing and undercounted, especially storms that never make landfall. That’s one of the reasons for the focus on landfalling hurricanes to begin with. With the advent of satellite data, storms are highly unlikely to be missed, but even landfalls have sometimes gone unreported historically. The farther back one goes, the less is known about the extent of hurricane activity, but Pielke and Maue feel that post-1970 data is fairly comprehensive.
The chart at the top of this post is a summery of the data that Pielke and Maue have compiled. There are no obvious trends in terms of the number of storms or their strength. The 1970s were quiet while the 90s were more turbulent. The absence of trends also characterizes NOAA’s data on U.S. landfalling hurricanes since 1851, as noted by Pail Driessen. Here is Driessen on Florida hurricane history:
“Using pressure, Ian was not the fourth-strongest hurricane in Florida history but the tenth. The strongest hurricane in U.S. history moved through the Florida Keys in 1935. Among other Florida hurricanes stronger than Ian was another Florida Keys storm in 1919. This was followed by the hurricanes in 1926 in Miami, the Palm Beach/Lake Okeechobee storm in 1928, the Keys in 1948, and Donna in 1960. We do not know how strong the hurricane in 1873 was, but it destroyed Punta Rassa with a 14-foot storm surge. Punta Rassa is located at the mouth of the river leading up to Ft. Myers, where Ian made landfall.”
Neil L. Frank, veteran meteorologist and former head of the National Hurricane Center, bemoans the changed conventions for assigning names to storms in the satellite era. A typical clash of warm and cold air will often produce thunderstorms and wind, but few of these types of systems were assigned names under older conventions. They are not typical of systems that usually produce tropical cyclones, although they can. Many of those kinds of storms are named today. Right or wrong, that gives the false impression of a trend in the number of named storms. Not only is it easier to identify storms today, given the advent of satellite data, but storms are assigned names more readily, even if they don’t strictly meet the definition of a tropical cyclone. It’s a wonder that certain policy advocates get away with saying the outcome of all this is a legitimate trend!
As Frank insists, there is no evidence of a trend toward more frequent and powerful hurricanes during the last several decades, and there is no evidence of rapid intensification. More importantly, there is no evidence that climate change is leading to more hurricane activity. It’s also worth noting that today we suffer far fewer casualties from hurricanes owing to much earlier warnings, better precautions, and better construction.