Tags
Bank Reserves, Bureau of Labor Statistics, CPI, Debt Ceiling, Fed Pause, Federal Funds, Federal Open Market Committee, Hoarding Labor, Inflation, Inverted Yield Curve, Jobless Claims, Leading Economic Indicators, Liquidity, PCE Deflator, Philip Jefferson, PPI, Quantitative Tightening, Real Weekly Earnings, Soft Landing, Stock Rally
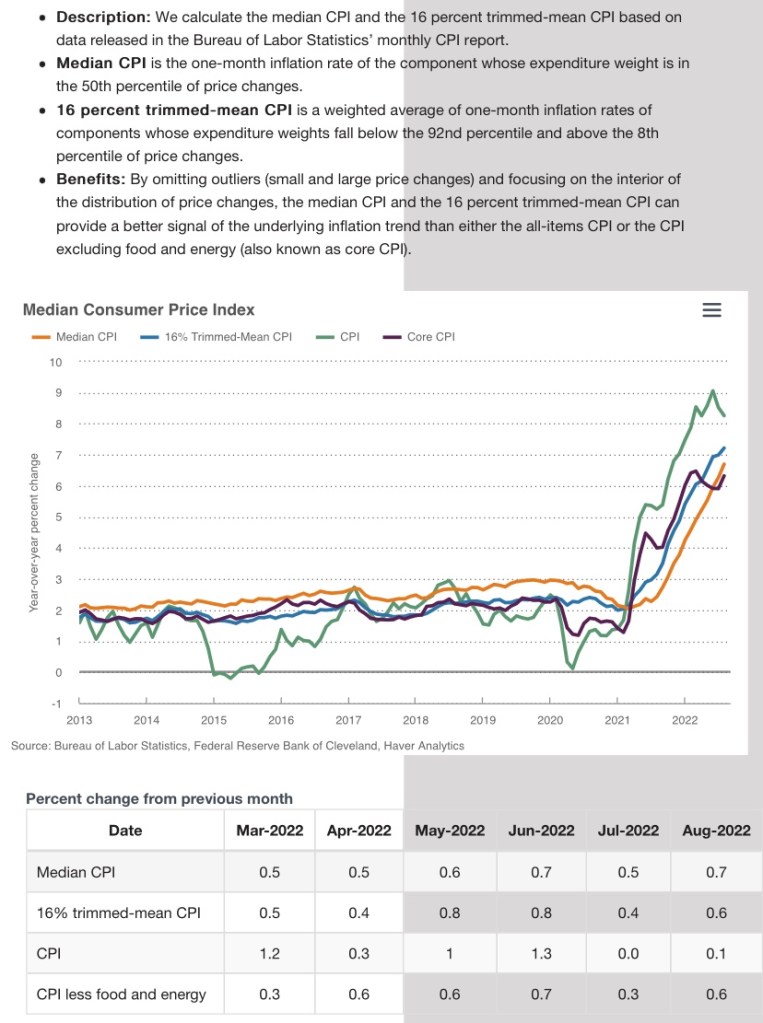
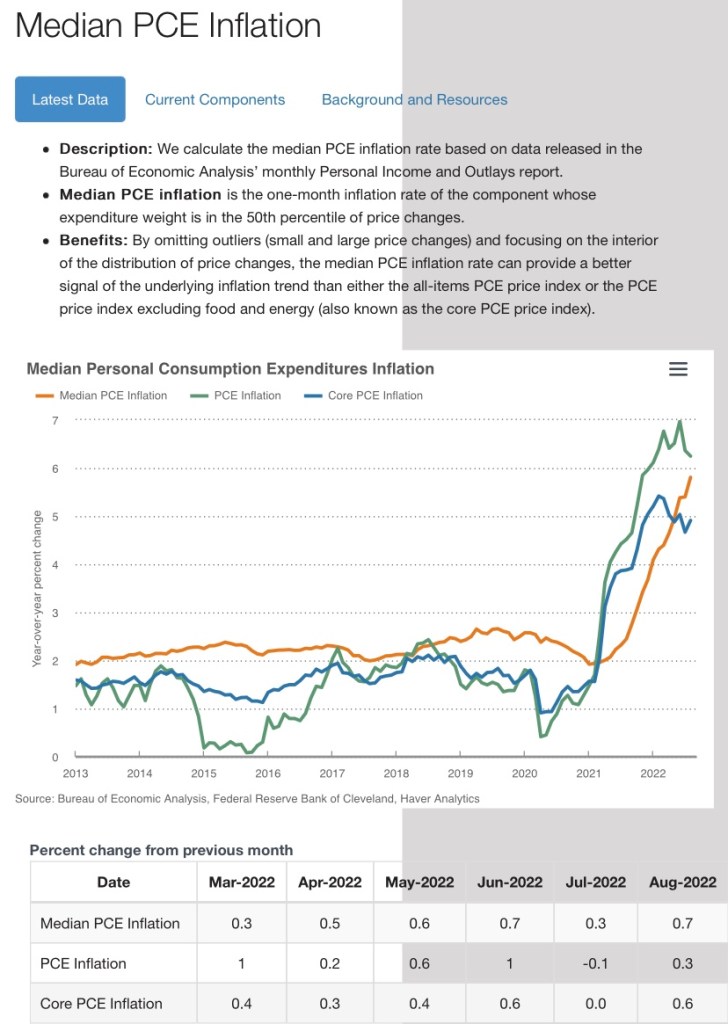
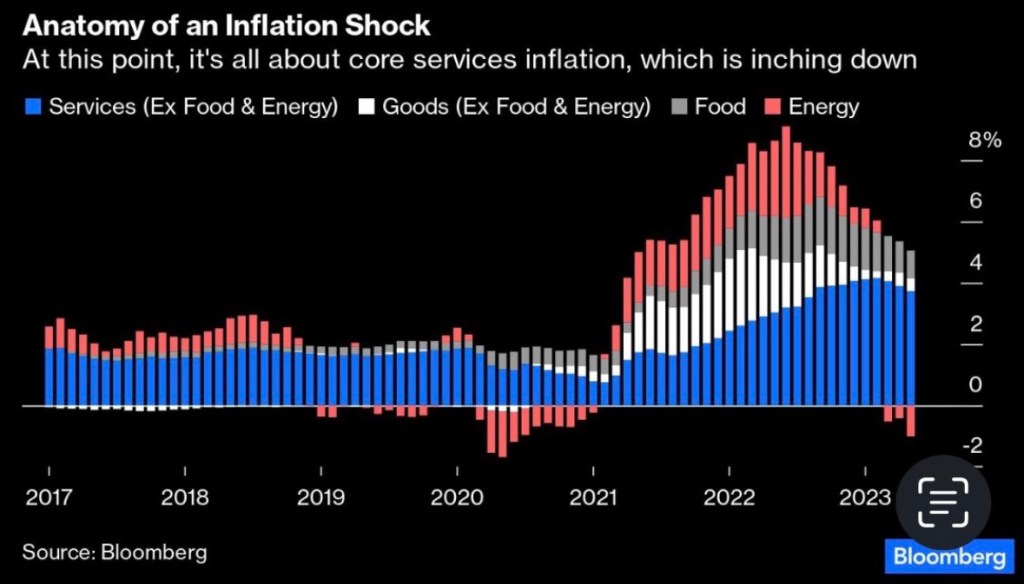
The inflation news was good last week, with both the consumer and producer price indices (CPI and PPI) for May coming in below expectations. The increase in the core CPI, which excludes food and energy prices, was the same as in April. As this series of tweets attempts to demonstrate, teasing out potential distortions from the shelter component of the CPI shows a fairly broad softening. That might be heartening to the Federal Reserve, though at 4.0%, the increase in the CPI from a year ago remains too high, as does the core rate at 5.3%. Later in the month we’ll see how much the Fed’s preferred inflation gauge, the PCE deflator, exceeds the 2% target.
Inflation has certainly tapered since last June, when the CPI had its largest monthly increase of this cycle. After that, the index leveled off to a plateau lasting through December. But the big run-up in the CPI a year ago had the effect of depressing the year-over-year increase just reported, and it will tend to depress next month’s inflation report as well. After this June’s CPI (to be reported in July), the flat base from a year earlier might have a tendency to produce rising year-over-year inflation numbers over the rest of this year. Also, the composition of inflation has shifted away from goods prices and into services, where markets aren’t as interest-rate sensitive. Therefore, the price pressure in services might have more persistence.
So it’s way too early to say that the Fed has successfully brought inflation under control, and they know it. But last week, for the first time in 10 meetings, the Fed’s chief policy-making arm (the Federal Open Market Committee, or FOMC) did not increase its target for the federal funds rate, leaving it at 5% for now. This “pause” in the Fed’s rate hikes might have more to do with internal politics than anything else, as new Vice Chairman Philip Jefferson spoke publicly about the “pause” several days before the meeting. That statement might not have been welcome to other members of the FOMC. Nevertheless, at least the pause buys some time for the “long and variable lags” of earlier monetary tightening to play out.
There are strong indications that the FOMC expects additional rate hikes to be necessary in order to squeeze inflation down to the 2% target. The “median member” of the Committee expects the target FF rate to increase by an additional 50 basis points by the end of 2023. At a minimum, it seems they felt compelled to signal that later rate hikes might be necessary after having their hand forced by Jefferson. That “expectation” might have been part of a “political bargain” struck at the meeting.
In addition, the Fed’s stated intent is to continue drawing down its massive securities portfolio, an act otherwise known as “quantitative tightening” (QT). That process was effectively interrupted by lending to banks in the wake of this spring’s bank failures. And now, a danger cited by some analysts is that a wave of Treasury borrowing following the increase in the debt ceiling, along with QT, could at some point lead to a shortage of bank reserves. That could force the Fed to “pause” QT, essentially allowing more of the new Treasury debt to be monetized. This isn’t an imminent concern, but perhaps next year it could present a test of the Fed’s inflation-fighting resolve.
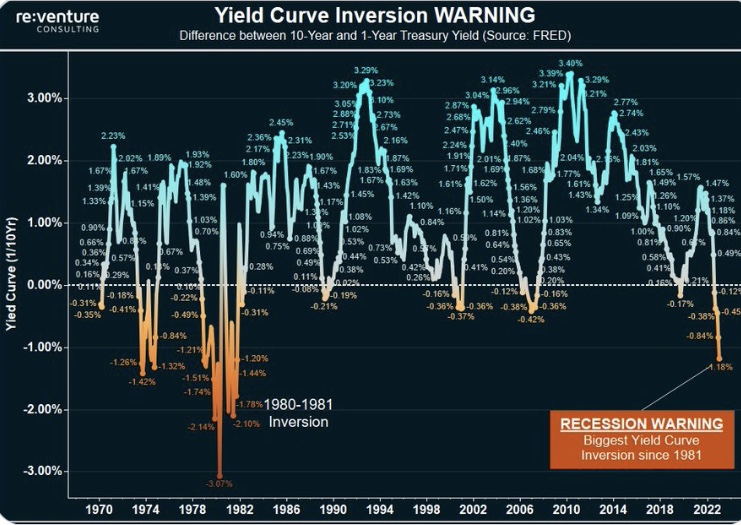
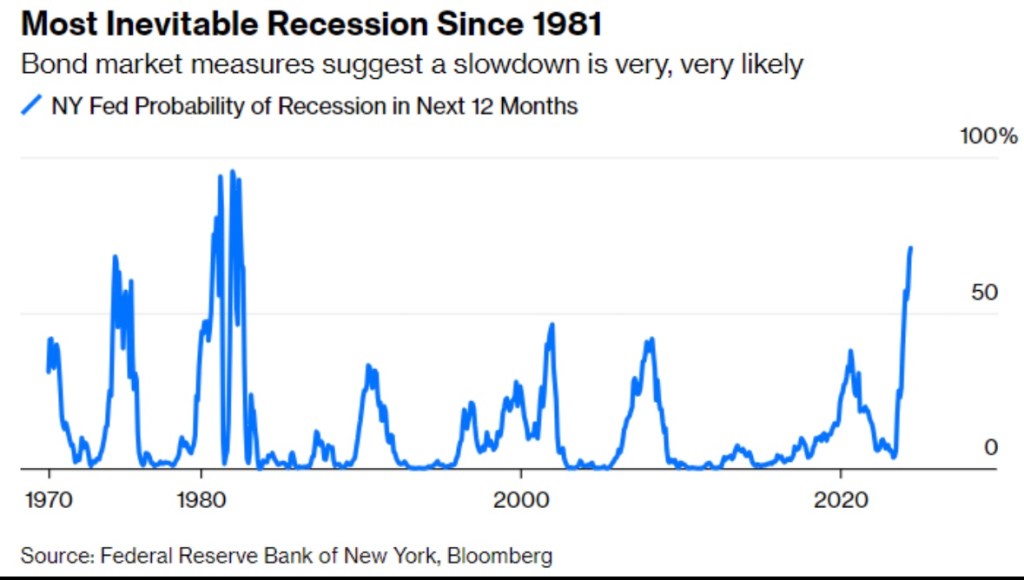
It’s certainly too early to declare that the Fed has engineered a “soft landing”, avoiding recession while successfully reigning-in inflation. The still-inverted yield curve is the classic signal that credit markets “expect” a recession. Here is the New York Federal Reserve Bank’s recession probability indicator, which is at its highest level in over 40 years:
There are other signs of weakness: the index of leading economic indicators has moved down for the last 13 months, real retail sales are down from 13 months ago, and real average weekly earnings have been trending down since January, 2021. A real threat is the weakness in commercial real estate, which could renew pressure on regional banks. Credit is increasingly tight, and that is bound to take a toll on the real economy before long.
The labor market presents its own set of puzzles. The ratio of job vacancies to job seekers has declined, but it is still rather high. Multiple job holders have increased, which might be a sign of stress. Some have speculated that employers are “hoarding” labor, hedging against the advent of an ultimate rebound in the economy, when finding new workers might be a challenge.
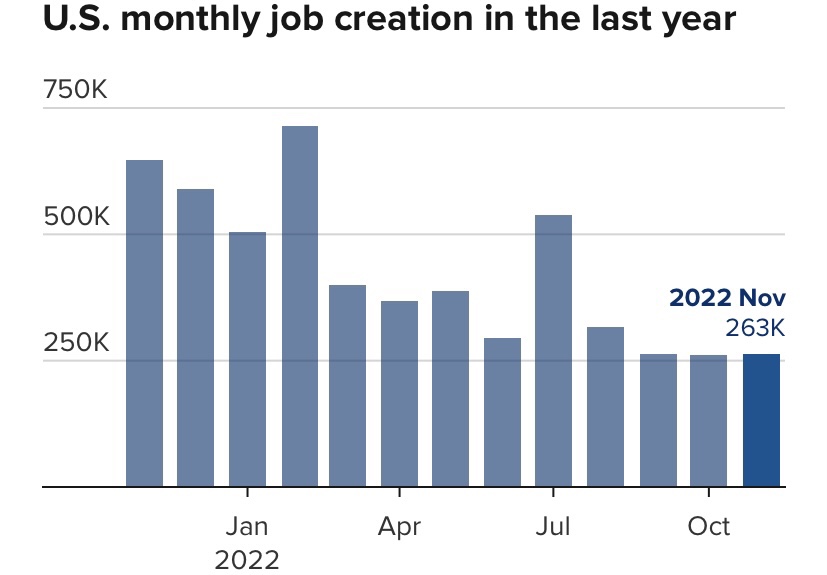
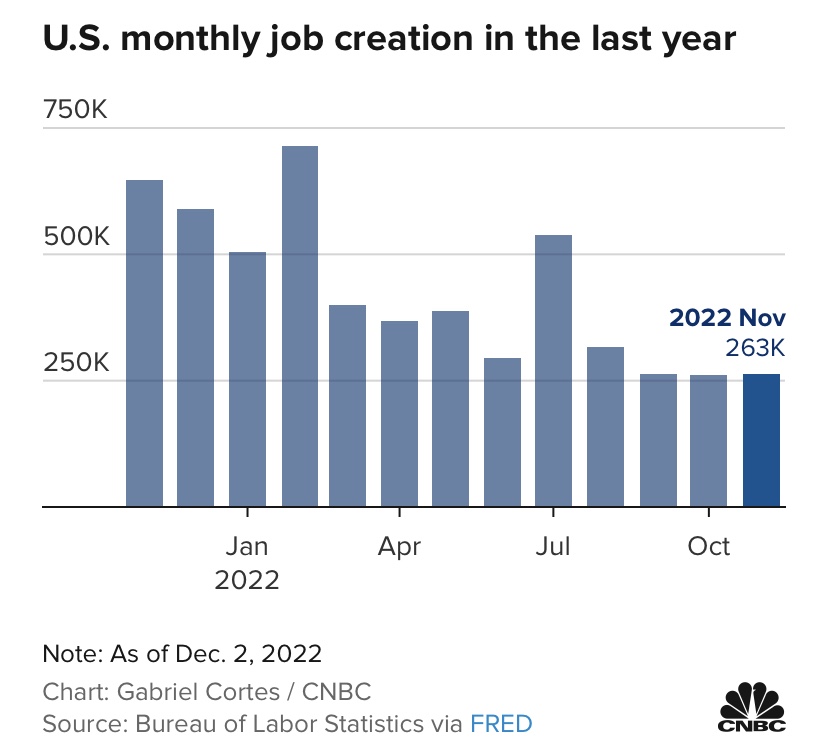
Despite some high-profile layoffs in tech and financial services, job gains have held up well thus far. Of course, the labor market typically lags turns in the real economy. We’ve seen declining labor productivity, consistent with changes in real earnings. This is probably a sign that while job growth remains strong, we are witnessing a shift in the composition of jobs from highly-skilled and highly-paid workers to lower-paid workers.
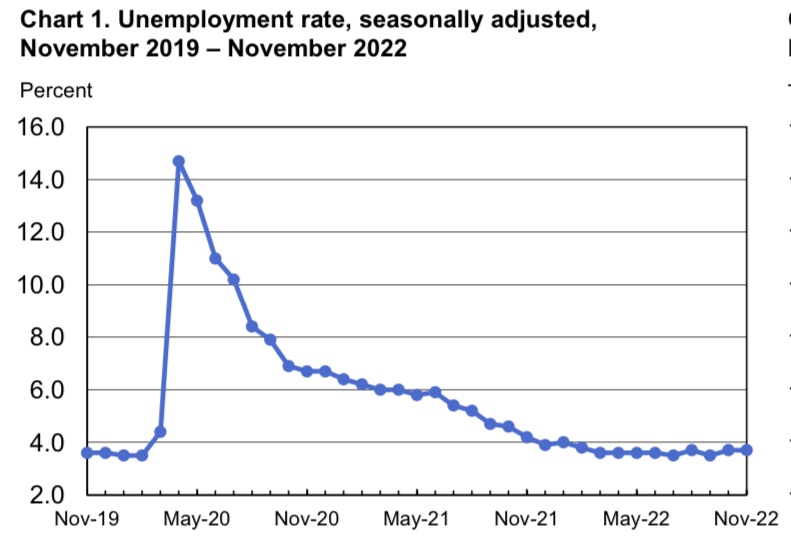
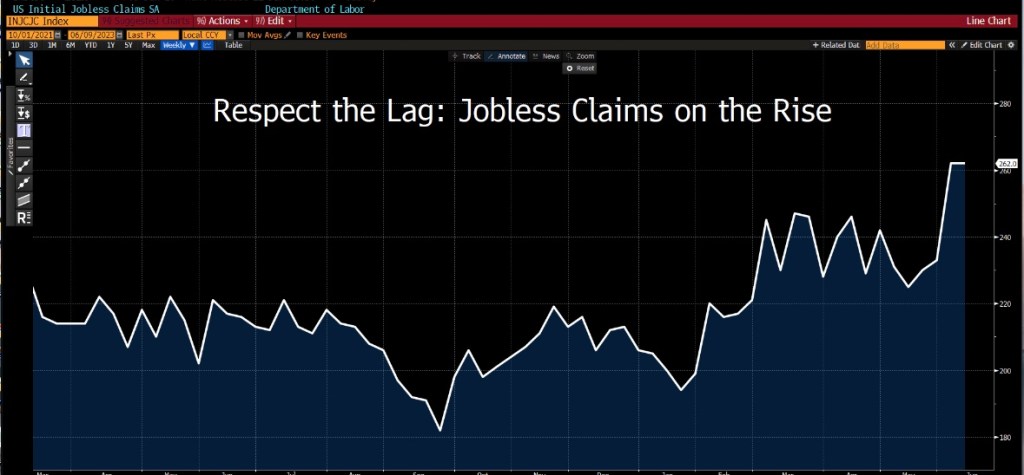
A further qualification is that many of the most highly-qualified job applicants are already employed, and are not part of the pool of idle workers. It’s also true that jobless claims, while not at alarming levels, have been trending higher.
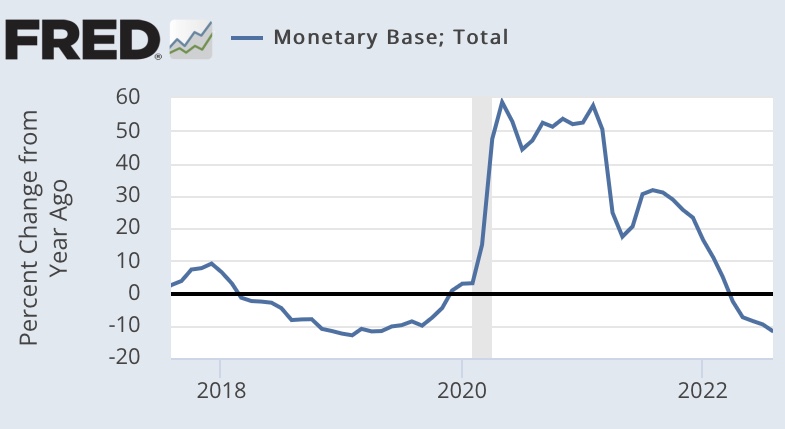
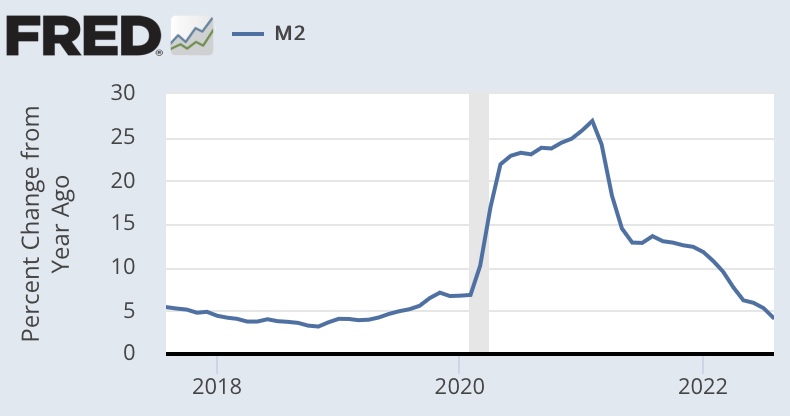
It’s important to remember that the Fed’s policy stance over the past year is intended to reduce liquidity and ultimately excess demand for goods and services. In typical boom-and-bust fashion, the tightening was a reversal from the easy-money policy pursued by the Fed from 2020 – early 2022, even in the face of rising inflation. The money supply has been declining for just over a year now, but the declines have been far short of the massive expansion that took place during the pandemic. There is still quite a lot of liquidity in the system.
That liquidity helps explain the stock market’s recovery in the face of ongoing doubts about the economy. While the market is still well short of the highs reached in early 2022, recent gains have been impressive.
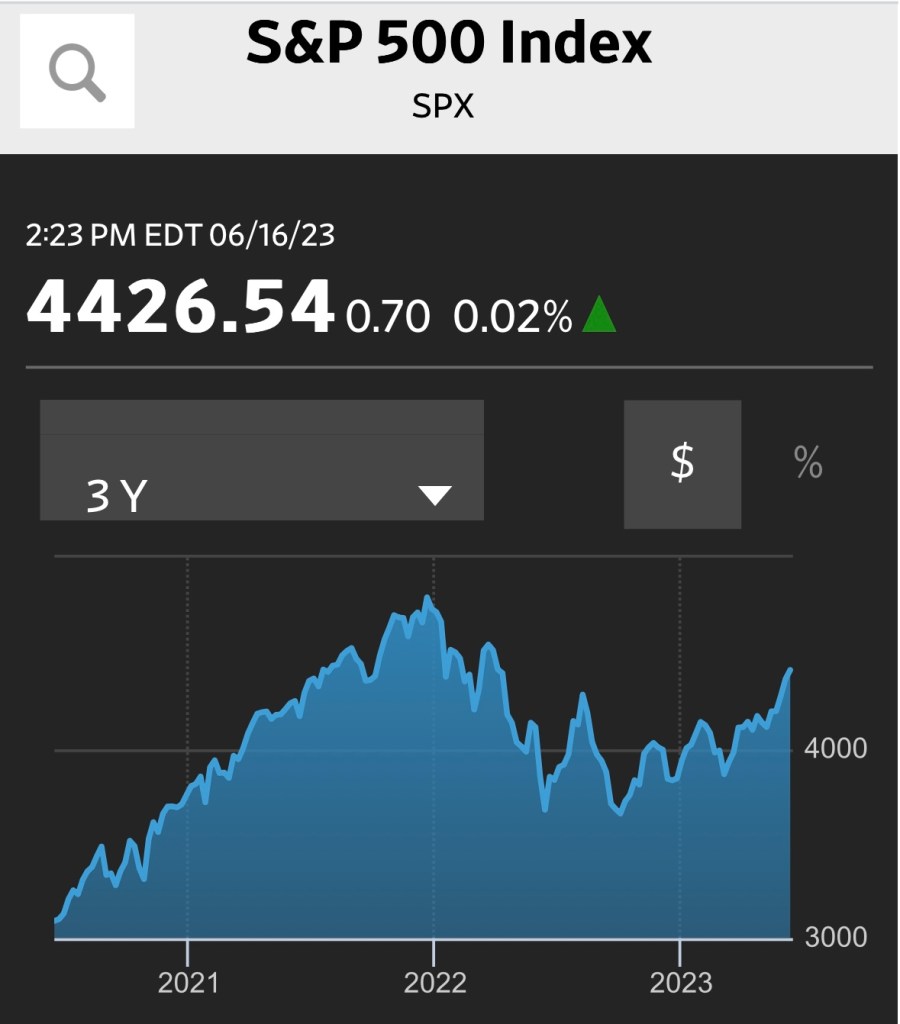
Some would argue that the forward view driving stock prices reflects an expectation of a mild recession and an inevitable rebound in the economy, no doubt accompanied by eventual cuts in the Fed’s interest rate target. But even stipulating that’s the case, the timing of a stock rally on those terms seems a little premature. Or maybe not! It wouldn’t be the first time incoming data revealed a recession had been underway that no one knew was happening in real time. Are we actually coming out of shallow woods?
To summarize, inflation is down but not out. The Fed might continue its pause on rate hikes through one more meeting in late July, but there will be additional rate increases if inflation remains persistent or edges up from present levels, or if the economy shows unexpected signs of strength. I’d like to be wrong about the prospects of a recession, but a downturn is likely over the next 12 months. I’ve been saying that a recession is ahead for the past eight months or so, which reminds me that even a broken clock is right twice a day. In any case, the stock market seems to expect something mild. However misplaced, hopes for a soft landing seem very much alive.