• About

Sacred Cow Chips

Sacred Cow Chips

Category Archives: Economic Outlook

Demand, Disinflation, and Fed Gradualism

15 Monday Apr 2024

Posted by Nuetzel in Economic Outlook, Inflation, Monetary Policy

≈ Leave a comment

Tags

Core PCE Inflation, Federal Deficit, Federal Reserve, Flexible Average Inflation Targeting, Hard Landing, Helicopter Drop, Higher for Longer, Nominal GDP Targeting, Pandemic Relief Payments, Quantitative Tightening, Scott Sumner, Soft Landing, Tight Money, Wage Inflation

The Fed’s “higher for longer” path for short-term interest rates lingers on, and so does inflation in excess of the Fed’s 2% target. No one should be surprised that rate cuts aren’t yet on the table, but the markets freaked out a little with the release of the February CPI numbers last week, which were higher than expected. For now, it only means the Fed will remain patient with the degree of monetary restraint already achieved.

Dashed Hopes

As I’ve said before, there was little reason for the market to have expected the Fed to cut rates aggressively this year. Just a couple of months ago, the market expected as many as six quarter-point cuts in the Fed’s target for the federal funds rate. The only rationale for that reaction would have been faster disinflation or the possibility of an economic “hard landing”. A downturn is not out of the question, especially if the Fed feels compelled to raise its rate target again in an effort to stem a resurgence in inflation. Maybe some traders felt the Fed would act politically, cutting rates aggressively as the presidential election approaches. Not yet anyway, and it seems highly unlikely.

There is no assurance that the Fed can succeed in engineering a “soft landing”, i.e., disinflation to its 2% goal without a recession. No one can claim any certainty on that point — it’s too early to call, though the odds have improved somewhat. As Scott Sumner succinctly puts it, a soft landing basically depends on whether the Fed can disinflate gradually enough.

It’s a Demand-Side Inflation

I’d like to focus a little more on Sumner’s perspective on Fed policy because it has important implications for the outlook. Sumner is a so-called market monetarist and a leading proponent of nominal GDP level targeting by the Fed. He takes issue with those ascribing the worst of the pandemic inflation to supply shocks. There’s no question that disruptions occurred on the supply side, but the Fed did more than accommodate those shocks in attempting to minimize their impact on real output and jobs. In fact, it can fairly be said that a Fed / Treasury collaboration managed to execute the biggest “helicopter drop” of money in the history of the world, by far!

That “helicopter drop” consisted of pandemic relief payments, a fiscal maneuver amounting to a gigantic monetary expansion and stimulus to demand. The profligacy has continued on the fiscal side since then, with annual deficits well in excess of $1 trillion and no end in sight. This reflects government demand against which the Fed can’t easily act to countervail, making the job of achieving a soft landing that much more difficult.

The Treasury, however, is finding a more limited appetite among investors for the flood of bonds it must regularly sell to fund the deficit. Recent increases in long-term Treasury rates reflect these large funding needs as well as the “higher-for-longer” outlook for short-term rates, inflation expectations, and of course better perceived investment alternatives.

The Nominal GDP Proof

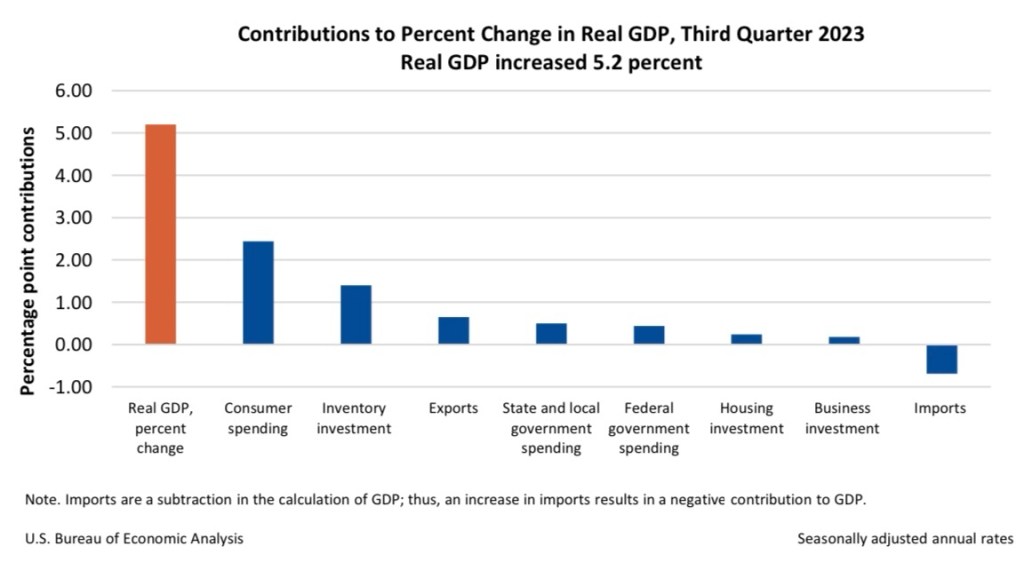
There should be no controversy that inflation is a demand-side problem. As Summer says, supply shocks tend to reverse themselves over time, and that was largely the case as the pandemic wore on in 2021. Furthermore, advances in both real and nominal GDP have continued since then. The difference between the two is inflation, which again, has remained above the Fed’s target.

So let’s see… output and prices both growing? That combination of gains demonstrates that demand has been the primary driver of inflation for three-plus years. Restrictive monetary policy is the right prescription for taming excessive demand growth and inflation.

Here’s Sumner from early March (emphasis his), where he references flexible average inflation targeting (FAIT), a policy the Fed claims to be following, and nominal GDP level targeting (NGDPLT):

“Over the past 4 years, the PCE price index is up 16.7%. Under FAIT it should have risen by 8.2% (i.e., 2%/year). Thus we’ve had roughly 8.5% excess inflation (a bit less due to compounding.)

Aggregate demand (NGDP) is up by 27.6%. Under FAIT targeting (which is similar to NGDPLT) it should have been up by about 17% (i.e., 4%/year). So we’ve had a bit less than 10.6% extra demand growth.  That explains all of the extra inflation.”

Is Money “Tight”?

The Fed got around to tightening policy in the spring of 2022, but that doesn’t necessarily mean that policy ever advanced to the “tight” stage. Sumner has been vocal in asserting that the Fed’s policy hasn’t looked especially restrictive. Money growth feeds demand and ultimately translates into nominal GDP growth (aggregate demand). The latter is growing too rapidly to bring inflation into line with the 2% target. But wait! Money growth has been moderately negative since the Fed began tightening. How does that square with Sumner’s view?

In fact, the M2 money supply is still approximately 35% greater than at the start of the pandemic. There’s still a lot of M2 sloshing around out there, and the Fed’s portfolio of securities acquired during the pandemic via “quantitative easing” remains quite large ($7.5 trillion). Does this sound like tight money?

Again, Sumner would say that with nominal GDP ripping ahead at 5.7%, the Fed can’t be credibly targeting 2% inflation given an allowance for real GDP growth at trend of around 1.8% (or even somewhat greater than that). It’s an even bigger stretch if M2 velocity (V — turnover) continues to rebound with higher interest rates.

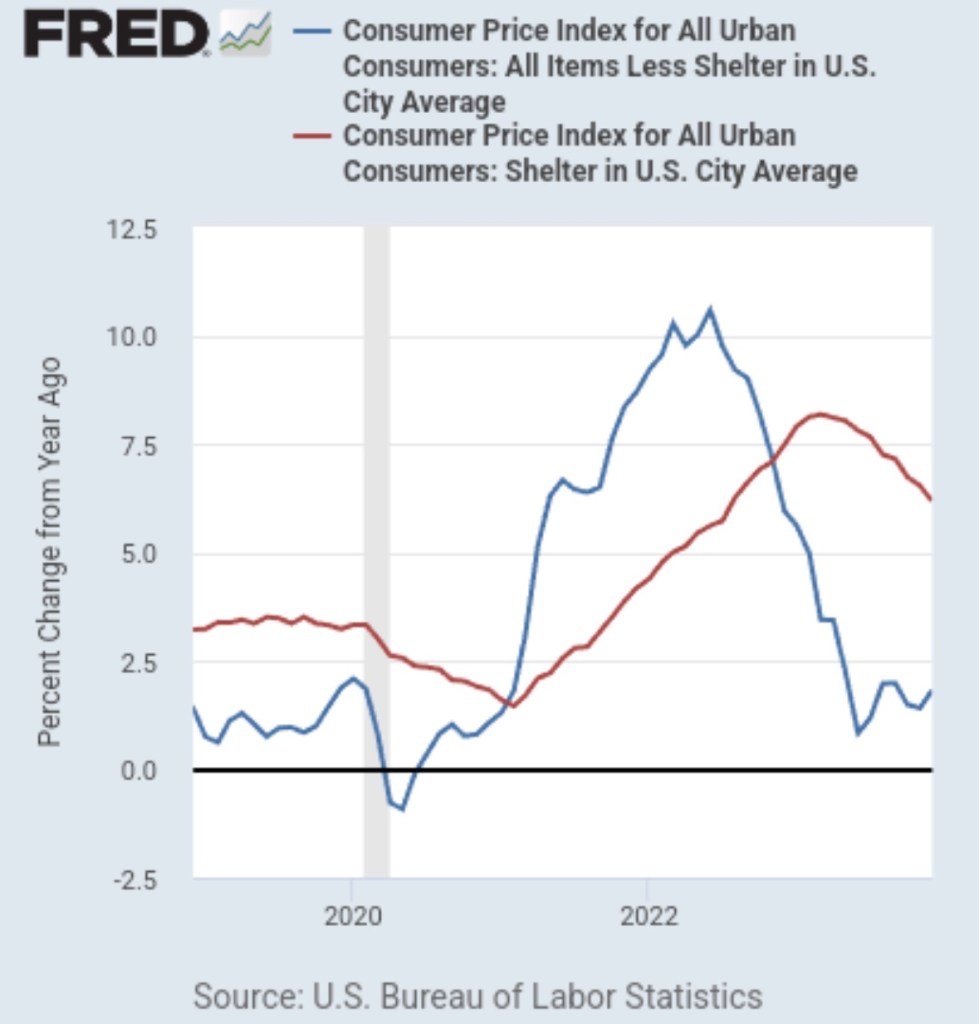
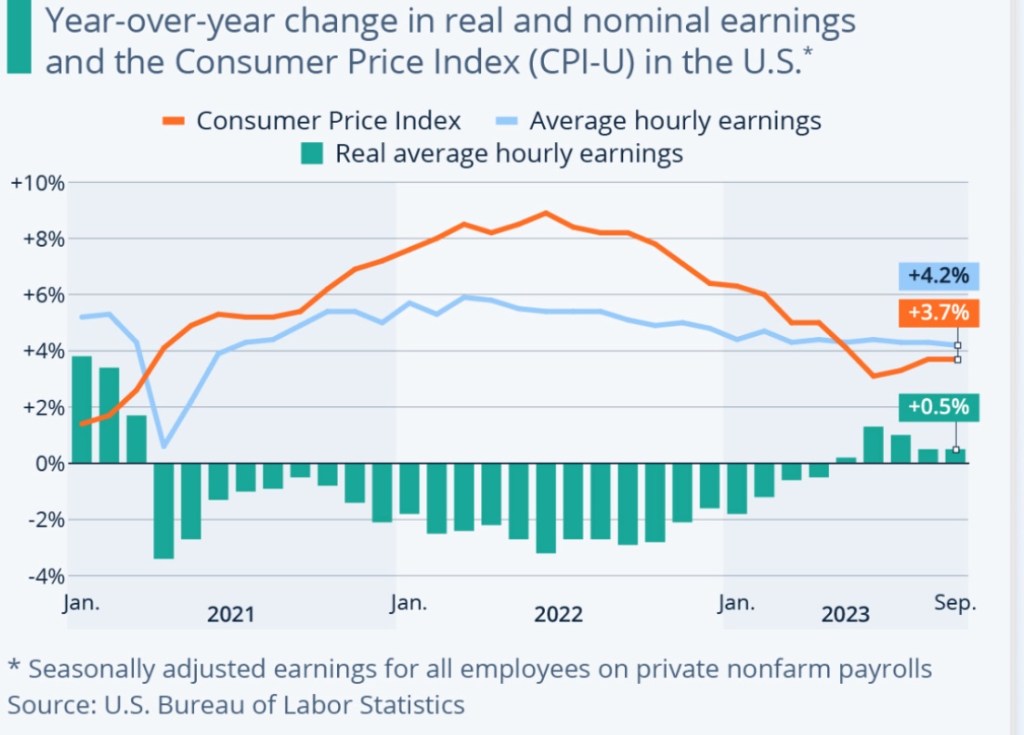
Wage growth also exceeds a level consistent with the Fed’s target. The chart below shows the gap between price inflation and wage inflation that left real wages well below pre-pandemic levels. Since early 2023, wages have made up part of that decline, but stubborn wage inflation can impede progress against price inflation.

Just Tight Enough?

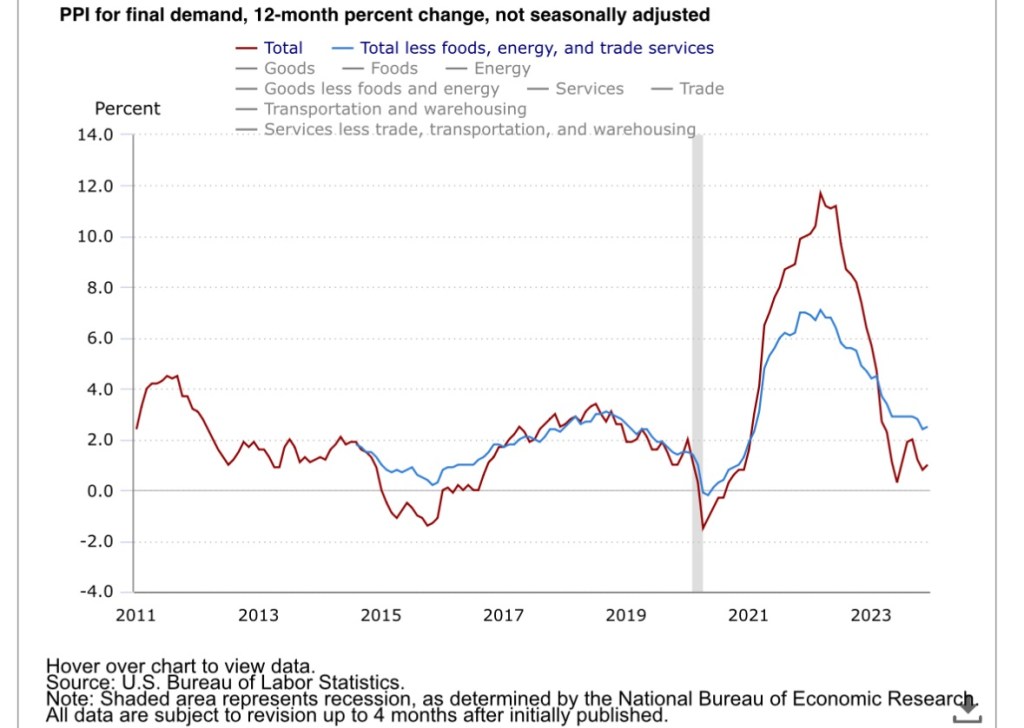
Despite Sumner’s doubts, there are arguments to be made that Fed policy qualifies as restrictive. Even moderate declines in liquidity can come as a shock to markets grown accustomed to torrents from the money supply firehose. And to the extent that inflation expectations have declined, real interest rates may be higher now than they were in early November. In any case, it’s clear the market was disappointed in the higher-than-expected CPI, and traders were not greatly assuaged by the moderate report on the PPI that followed.

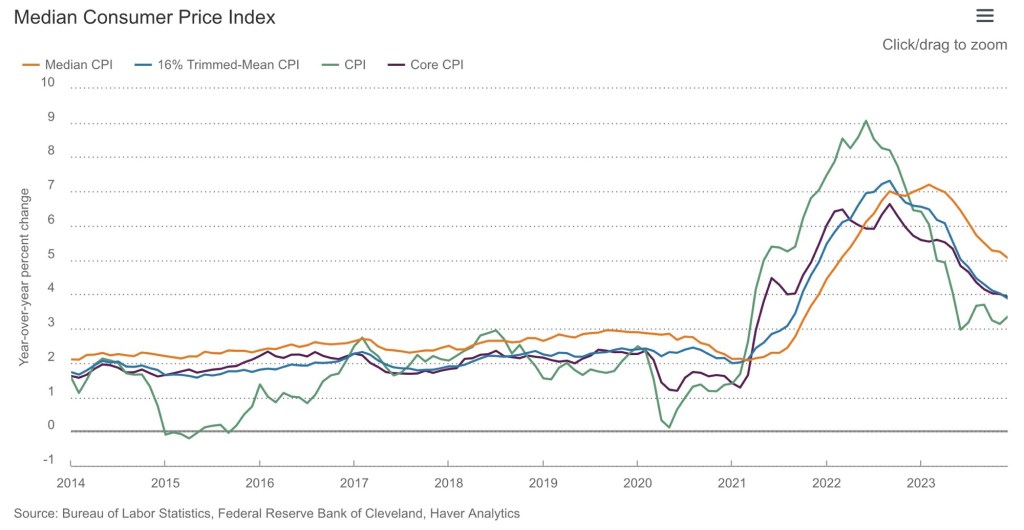
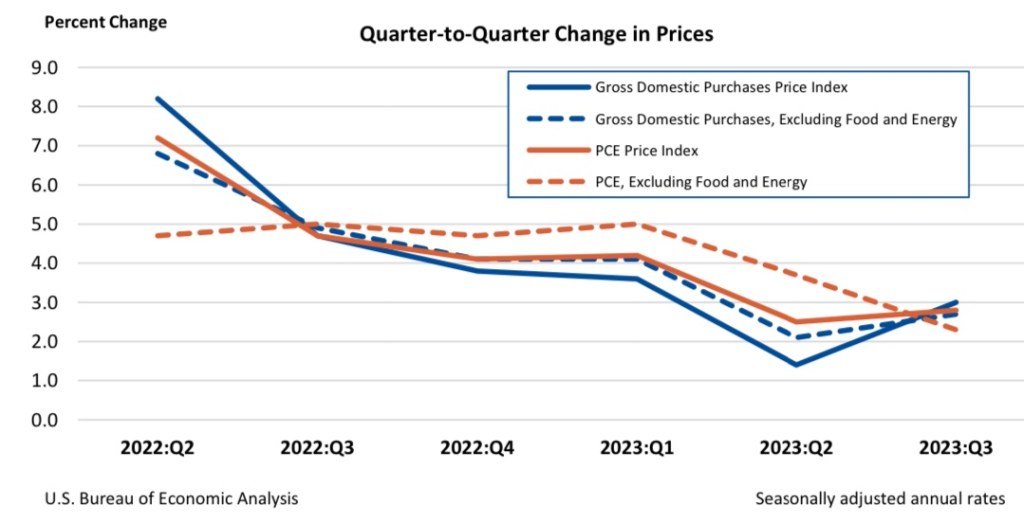
However, the Fed pays closest attention to another price index: the core deflator for personal consumption expenditures (PCE). Inflation by this measure is trending much closer to the Fed’s target (see the second chart below). Still, from the viewpoint of traders, many of whom, not long ago, expected six rate cuts this year, the reality of “higher for longer” is a huge disappointment.

Danger Lurks

As I noted, many believe the odds of a soft landing have improved. However, the now-apparent “stickiness” of inflation and the knowledge that the Fed will standby or possibly hike rates again has rekindled fears that the economy could turn south before the Fed elects to cut its short-term interest rate target. That might surprise Sumner in the absence of more tightening, as his arguments are partly rooted in the continuing strength of aggregate demand and nominal GDP growth.

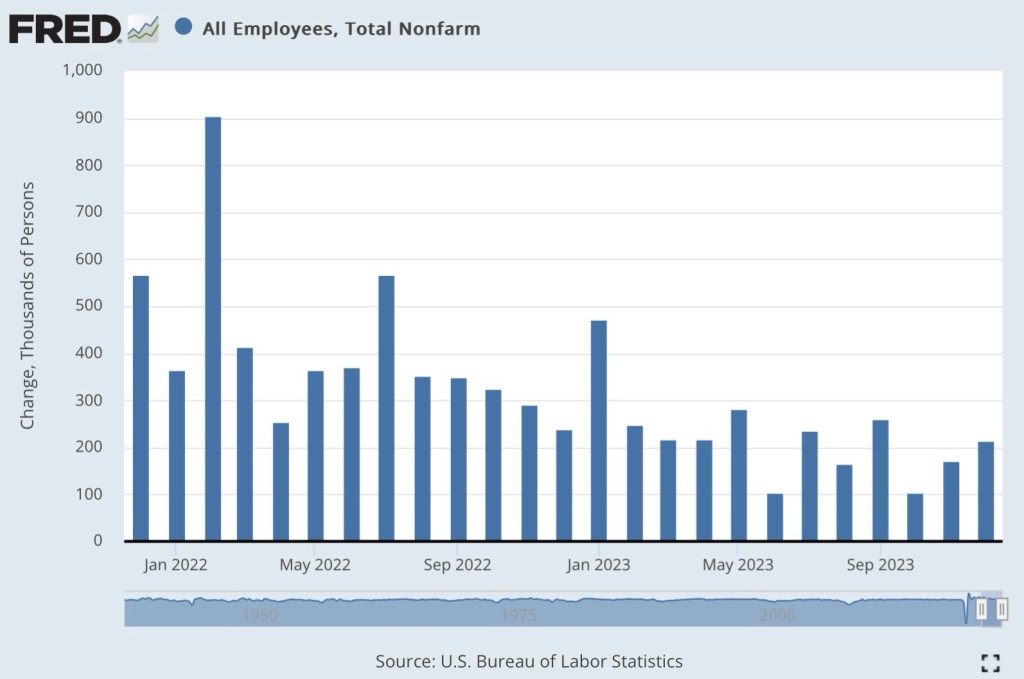
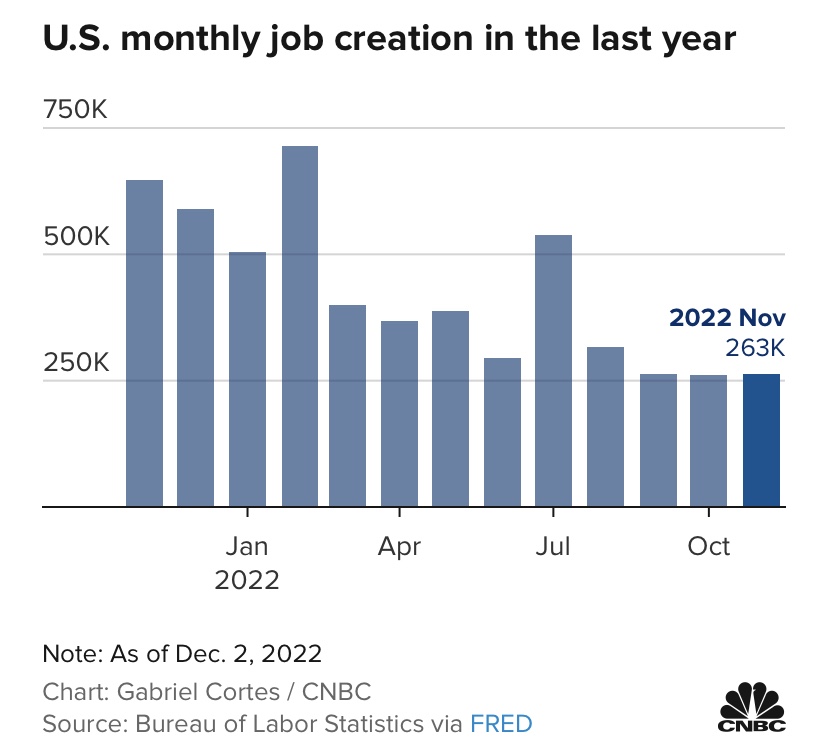
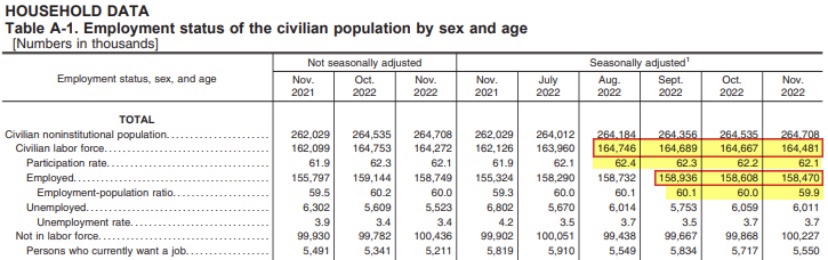
There’s a fair degree of consensus that the labor market remains strong, which underscores Sumner’s doubts as to the actual tenor of monetary policy. The March employment numbers were deceptive, however. The gain in civilian employment was just shy of 500,000, but that gain was entirely in part-time employment. Full-time employment actually declined slightly. In fact, the same is true over the prior 12 months. And over that period, the number of multiple jobholders increased by more than total employment. Increasing reliance on part-time work and multiple jobs is a sign of stress on household budgets and that firms may be reluctant to commit to full-time hires. From the establishment survey, the gain in nonfarm employment was dominated once again by government and health care. These numbers hardly support the notion that the economy is on solid footing.

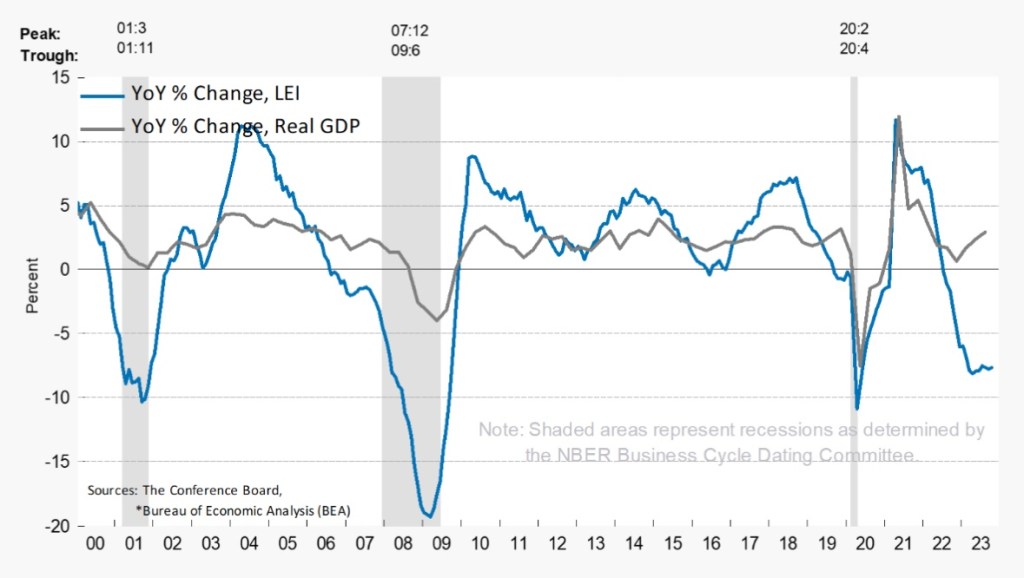
There are other signs of stress: credit card delinquencies hit an all-time high in February. High interest rates are taking a toll on households and business borrowers. Retail sales were stronger than expected in March, but excess savings accumulated during the pandemic were nearly depleted as of February, so it’s not clear how long the spending can last. And while the index of leading indicators inched up in February, it was the first gain in two years and the index has shown year/over-year declines over that entire two-year period.

Conclusion

It feels a little hollow for me to list a series of economic red flags, having done so a few times over the past year or so. The risks of a hard landing are there, to be sure. The behavior of the core PCE deflator over the next few months will have much more influence on the Fed policy, as would any dramatic changes in the real economy. The “data dependence” of policy is almost a cliche at this point. The Fed will stand pat for now, and I doubt the Fed will raise its rate target without a dramatic upside surprise on the core deflator. Likewise, any downward rate moves won’t be forthcoming without more softening in the core deflator toward 2% or definitive signs of a recession. So rate cuts aren’t likely for some months to come.

Stubborn Inflation and the Fed’s Approach Trajectory

15 Monday Jan 2024

Posted by Nuetzel in Economic Outlook, Monetary Policy

≈ Leave a comment

Tags

Birth-Death Model, BLS, Core Inflation, CPI, Establishment Survey, Federal Funds Rate, Federal Open Market Committee, Federal Reserve, FOMC, Grateful Dead, Hard Landing, Household Survey, Inflation, Jerome Powell, Nonfarm Payrolls, PCE Deflator, PPI, Red Sea, Seasonal Adjustment, Soft Landing, Supply Shocks

When Federal Reserve Chairman Jerome Powell said “higher for longer” last year, it wasn’t about the Grateful Dead concerts he’s attended over the years. No, he meant the Fed might need to raise its short-term interest rate target and/or keep it elevated for an extended period to squeeze inflation out of the economy. As late as December, Powell said that additional rate hikes remain on the table. But short of that, the Fed might keep its current target rate steady until inflation is solidly in-line with its 2% objective. The obvious risk is that tight monetary policy might tip the economy into recession. The market, for its part, is pricing in several rate cuts this year.

Thus far, the release of key economic data for December 2023 has not settled the debate as to whether disinflation has truly paused short of the Fed’s goal. There were inauspicious signs from the labor market in December as well. These data releases don’t rule out a “soft landing”, but they indicate that recession risks are still with us in 2024. The Fed will face a dilemma if the economy weakens but inflation fails to abate, either due to residual stickiness or new supply shocks. The latter are unfolding even now with the shut down of Red Sea shipping.

Bad Employment Report

On the surface, the employment report from the Bureau of Labor Statistics (BLS) was strong relative to expectations, and the media reported it on that superficial level: nonfarm payrolls increased by 216,000 jobs, about 45,000 more than expected; unemployment was unchanged from November at 3.7%.

Unfortunately, the report contained several ominous signs:

1) Employment from the BLS Household Survey declined by 683,000 in December and is essentially flat since July. This discrepancy should be rather unsettling to anyone waving off the possibility of a recession.

2) The number of full-time workers decreased by 1.53 million in December, and the number of part-time workers increased by 762,000 as the holidays approached. Retail employment was not particularly strong however, and the big loss of full-time work stands in contrast to the “strong-report” narrative.

3) The number of multiple jobholders hit a record and increased by 556,000 over the past year. This might indicate trouble for some workers making ends meet.

5) The civilian labor force declined by 676,000. What accounts for the change in status among these former workers or job seekers?

6) From the BLS Establishment Survey, government hiring accounted for 24% of the nonfarm jobs filled in December. Social Services accounted for 10% of the new hiring and health care for 18%, both of which are heavily dependent on government.

7) Nonfarm payrolls were revised downward by a total of 71,000 for October and November. We’ve seen downward revisions for 10 of the past 11 months.

8) In total, initial monthly job reports in 2023 overstated the full-year gain in nonfarm employment after available revisions by 439,000.

Those are big qualifiers on the “stronger than expected” jobs report. Furthermore, I tend to discount new government jobs as a real engine of production possibilities, so the report didn’t offer much assurance about the economy’s momentum. In addition, there are estimates that the payroll gain was due to better weather than the seasonal adjustment factors indicate.

Fictional Payroll Gains?

Still other issues cast doubt on the BLS payroll numbers. First, they are based on a survey of employers that is not complete by the time of each month’s initial report. Second, the survey is heavily skewed toward employees of government and large corporations; the sample of small employers is light by comparison. Third, seasonal adjustments often swamp the unadjusted changes in payrolls.

Finally, the BLS uses a statistical model of business births/deaths to adjust the figures. This is intended to correct for a lag in survey coverage as new businesses are formed and others close. The net effect on the payroll estimate can be positive or negative. Unfortunately, it’s difficult for even the BLS to tell how much the birth/death model affects the headline nonfarm jobs figure in any particular month. Therefore, it’s tough to put much faith in the monthly reports, but we watch them anyway.

Stubborn Inflation

The Consumer Price Index (CPI) for December increased 0.3% over November and 3.4% year-over-year, slightly more than expectations of 0.2% and 3.2%, respectively. The “core” CPI (excluding food and energy prices) rose 3.9% year-over-year, more than the 3.8% expected. The core rate declined on a one-month and year-over-year basis, however, as did the median item in the CPI.

All CPI measures in the chart declined during 2023, though the core and median lagged the headline CPI (green line), which “flattened” somewhat during the last half of the year. So there appears to be some stickiness hindering disinflation in the CPI at this point, but the apparent “stickiness” has been confined to lagging declines in housing costs (also see here).

The Producer Price Index (PPI) reported a day later was thought to be benign. Like the CPI, disinflation in the core PPI has tapered:

In this context, it should be noted that declines in the Fed’s preferred inflation gauge, the PCE deflator, have also undergone something of a pause, and the PCE weights housing costs much less heavily than the CPI.

The CPI and PPI reports don’t offer any reason for the Fed to reduce its target federal funds rate over the next couple of Federal Open Market Committee (FOMC) meetings. There are two more sets of monthly inflation reports before the meeting in late March, so things could change. But again, the Fed has given ample guidance that it might have to leave its target rate at the current level for an extended period.

The Market View

Markets had priced-in six cuts in the Fed funds rate target in 2024 prior to the CPI report, but traders began to discount that possibility in its immediate aftermath. However, members of the FOMC expected an average of three cuts in 2024, with more to come in 2025, whether or not that’s consistent with “higher for longer”. Inflation is hovering somewhat above the Fed’s goal, but getting the rest of the job done might be tough, and indeed, might imply “longer” if not “higher”.

But why did the market ever hold the expectation of six cuts this year? Traders must have anticipated an economic contraction, which would kick the Fed into rapid response mode. The employment report offered no assurance that such a “hard landing” will be avoided. A few more negative signals on the real economy without further progress on prices would provide quite a test of the Fed’s inflation-fighting resolve.

So When Can We Expect That Hard Landing, Hmmm?

13 Wednesday Dec 2023

Posted by Nuetzel in Economic Outlook, Monetary Policy

≈ Leave a comment

Tags

Consumer Sentiment, Core PCE, Federal Funds Rate Target, Federal Open Market Committee, Hard Landing, Inflation, Jamie Diamond, Labor Market, Leading Indicators, Long and Variable Lags, Milton Friedman, Money Growth, Neutral Real Rate, Quantitative Tightening, Real Interest Rates, Real Wages, Recession, Scott Sumner, Soft Landing, Tight Money

The joke’s on me, but my “out” on the question above is “long and variable lags” in the impact of monetary policy, a description that goes back to the work of Milton Friedman. If you call me out on my earlier forebodings of a hard landing or recession, I’ll plead that I repeatedly quoted Friedman on this point as a caveat! That is, the economic impact of a monetary tightening will be lagged by anywhere from 9 to 24 months. So maybe we’re just not there yet.

Of course, maybe I’m wrong and we won’t have to get “there”: the rate of inflation has indeed tapered over the past year. A soft landing now seems like a more realistic possibility. Still, there’s a ways to go, and as Scott Sumner says, when it comes to squeezing inflation out of the system, “It’s the final percentage point that’s the toughest.” One might say the Federal Reserve is hedging its bets, avoiding further increases in its target federal funds rate absent evidence of resurging price pressures.

Strong Growth or Mirage?

Economic growth is still strong. Real GDP in the third quarter grew at an astonishing 5.2% annual rate. A bulge in inventories accounted for about a quarter of the gain, which might lead to some retrenchment in production plans. Government spending also accounted for roughly a quarter, which corresponds to a literal liability as much as a dubious gain in real output. Unfortunately, fiscal policy is working at cross purposes to the current thrust of monetary policy. Profligate spending and burgeoning budget deficits might artificially prop up the economy for a time, but it adds to risks going forward, not to mention uncertainty surrounding the strength and timing in the effects of tight money.

Consumers accounted for almost half of the third quarter growth despite a slim 0.1% increase in real personal disposable income. That reinforces the argument that consumers are depleting their pandemic savings and becoming more deeply indebted heading into the holidays.

The economy continues to produce jobs at a respectable pace. The November employment report was slightly better than expected, but it was buttressed by the return of striking workers, and retail and manufacturing jobs declined. Still, the unemployment rate fell slightly, so the labor market has remained stronger than expected by most economists.

Consumer sentiment had been in the dumps until the University of Michigan report for December, which erased four months of declines. The expectations index is one component of the leading economic indicators, which has been at levels strongly suggesting a recession ahead for well over a year now. See the chart below:

But expectations improved sharply in November, and that included a decline in inflation expectations.

Another component of the LEI is the slope of the yield curve (measured by the difference between the 10-year Treasury bond yield and the federal funds rate). This spread has been a reliable predictor of recessions historically. The 10-year bond yield has declined by over 90 basis points since mid-October, a sign that bond investors think the inflation threat is subsiding. However, that drop steepened the negative slope of the yield curve, meaning that the recession signal has strengthened.

Disinflation, But Still Inflation

Inflation measures have been slowing, and the Fed’s “target” inflation rate of 2% appears within reach. In the Fed’s view, the most important inflation gauge is the personal consumption expenditures deflator excluding food and energy prices (the “core” PCE). The next chart shows the extent to which it has tapered over the past two quarters. While it’s encouraging that inflation has edged closer to the Fed’s target, it does not mean the inflation fight is over. Still, the decision taken at the December meeting of the Fed’s Open Market Committee (FOMC) to leave its interest rate target unchanged is probably wise.

Real wages declined during most of the past three years with the surge in price inflation (see next chart). Some small gains occurred over the past few months, but the earlier declines reinforce the view that consumers need to tighten their belts to maintain savings or avoid excessive debt.

Has Policy Really Been “Tight“?

The prospect of a hard landing presupposes that policy is “tight” and has been tight for some months, but there is disagreement over whether that is, in fact, the case. Scott Sumner, at the link above in the second paragraph, is skeptical that policy is “tight” even now. That’s despite the fact that the Fed hiked its federal funds rate target 11 times between March 2022 and July 2023 (by a total of 5.25%). The Fed waited too long to get started on its upward rate moves, which helps explain the continuing strength of the economy right now.

The real fed funds rate turned positive (arguably) as early as last winter as the rate rose and as expected inflation began to decline. There is also solid evidence that real interest rates on the short-end of the maturity spectrum are higher than “neutral” real rates and have been for well over a year (see chart below). If the Fed leaves its rate target unchanged over the next few months, assuming expected inflation continues to taper, the real rate will rise passively and the Fed’s policy stance will have tightened further.

Another view is that the Fed’s policy became “tight” when the monetary aggregates began to decrease (April 2022 for M2). A few months later the Fed began so-called “quantitative tightening” (QT—selling securities to reduce its balance sheet). Thus far, QT has reversed only a portion of the vast liquidity provided by the Fed during the pandemic. However, markets do grow accustomed to generous ongoing flows of liquidity. Cutting them off creates financial tensions that have real economic effects. No doubt the Fed’s commitment to QT established some credibility that a real policy shift was underway. So it’s probably fair to say that policy became “tight” as this realization took hold, which might place the date demarcating “tight” policy around 15 – 18 months ago.

Back to the Lags

Again, changes in monetary policy have a discernible impact only with a lag. The broad range of timing discussed among monetary experts (again, going back to Milton Friedman) is 9 – 24 months. We’re right in there now, which adds to the conviction among many forecasters that the onset of recession is likely during the first half of 2024. That’s my position, and while the tapering of inflation we’ve witnessed thus far is quite encouraging, it might take sustained monetary restraint before we’re at or below the Fed’s 2% target. That also increases the risk that we’ll ultimately suffer through a hard landing. In fact, there are prominent voices like hedge fund boss Bill Ackman who predict the Fed must begin to cut the funds rate soon to avoid a hard landing. Jamie Diamond, CEO of JP Morgan, says the U.S. is headed for a hard landing in 2024.

Looking Forward

If new data over the next few months is consistent with a “soft landing” (and it would take much more than a few months to be conclusive), or especially if the data more strongly indicate an incipient recession, the Fed certainly won’t raise its target rate again. The Fed is likely to begin to cut the funds rate sometime next year, and sooner if a recession seems imminent. Otherwise, my guess is the Fed waits at least until well into the second quarter. The average of FOMC member forecasts at the December meeting works out to three quarter-point rate cuts by year-end 2024. When the Fed does cut its target rate, I hope it won’t at the same time abandon QT, the continuing sales of securities from its currently outsized portfolio. Reducing the Fed’s holdings of securities will restrain money growth and give the central bank more flexibility over future policy actions. QT will also put pressure on Congress and the President to reduce budget deficits.

The Employment Situation: Where’s the Recession?

14 Wednesday Dec 2022

Posted by Nuetzel in Economic Outlook

≈ 1 Comment

Tags

ADP Employment Report, Average Weekly Hours, BLS, Business Confidence, Consumer Confidence, Elise Gould, Employment Situation, Establishment Survey, Federal Reserve, Great Depression, Household Survey, Index of Leading Indicators, Inverted Yield Curve, Jerome Powell, Job Losers, Labor Force Participation, Labor Market, Lagging Indicator, Layoffs, Long and Variable Lags, Nonfarm Payrolls, Real Wages, Soft Landing, Underemployment

It’s always hard to foresee dramatic turns in the economy and their timing. One day, way back in grad school, a professor of mine went on about how the Great Depression seemed to surprise people at the time. He felt they should have known it was coming, and he emphasized that housing had been in a downturn starting around 1926. Well, hindsight’s 20/20, and I’m not sure how timely and accurate economic reporting was at the time, but today it’s not any easier to call recessions in advance.

An Array of Weak Signals

We’ve seen a downturn in housing this year, and for that and several other reasons many forecasters are predicting a recession in 2023. Consumers are depleting their savings and running up debt, and in November consumer confidence dropped for a fourth month in a row. In October, the Index of Leading Economic Indicators declined for an eighth straight month. A slump in business confidence has been underway for 12 months. Businesses are accumulating debt at much higher interest rates, and the earnings outlook (excluding energy) is bleak.

Buttressing that negative outlook is the inverted yield curve, which has been reliable (though not infallible) as a recession signal in the past. We now have a gap between the one-year Treasury yield and the 10-year Treasury yield of well over 100 basis points, which is as high as it’s been since 1981. That looks rather ominous.

The Fed’s Mission

Perhaps most importantly, the Federal Reserve has succeeded in reducing the money supply. That shift to tightening policy really only began in the late spring, however, and as Milton Friedman emphasized, the impact of money supply growth on the real economy is subject to “long and variable lags”. That could mean an economic slowdown or recession any time from now into 2024, but many analysts believe it will begin in the first half of 2023.

Denialists

Yet a few observers claim things are rosy, not least of all those within the Biden Administration. They insist the economy is in fine shape, pointing to the continuing strength in some of the employment numbers. Those gains have also been a preoccupation of the media, but employment statistics aren’t especially good predictors of changes in economic growth. Job growth and unemployment are lagging indicators, so we shouldn’t expect to see obvious signals of recession from employment data, at least until a downturn is underway. Even the Fed’s official economic forecast still calls for something of a “soft landing”, but Chairman Jerome Powell is wary of placing much confidence in particular outcomes, and with good reason.

The Employment Situation

There are unusual patterns in recent employment data that might portend a weaker economy, but first, the statistics most widely followed are changes in non-farm employment (from the Bureau of Labor Statistics’ Survey of Business Establishments) and the unemployment rate (from the BLS Household Survey). The chart below shows monthly changes in nonfarm payrolls over the past year. There was a still-healthy gain in payrolls in November, but the pace of job growth slowed over the last twelve months as we came off the post-pandemic rebound.

One factor partly offsetting recent gains in non-farm employment is a decrease in the average workweek. Average weekly hours declined slightly in November and it was down 0.4 hours from a year earlier.

There are sectors of the economy that have shown recent weakness in payroll jobs. There was a decline in goods-producing employment in November, and layoffs are underway in the tech sector, a first for some of the big tech firms. Job reductions have also been announced at a few prominent financial firms.

The next chart shows that the unemployment rate has remained near post-pandemic lows since early this year. An ongoing factor helping to keep it low, however, is that labor force participation is still running below pre-pandemic levels (despite rebounding well off pandemic lows during 2021). You aren’t counted as unemployed if you don’t participate in the labor force by seeking work.

One negative sign here is an uptick over the past two months in the share of job losers among the unemployed (as opposed to quitters or new entrants). That’s a pattern that would become more pronounced when and if a recession takes hold.

Keep in mind that these statistics are derived from surveys and extrapolated to the universe of households or non-farm employees. The Household Survey samples 60,000 households, whereas the Establishment Survey samples 131,000 employers, accounting for 670,000 employees. So the Household Survey is much smaller. Nevertheless, sample sizes of these magnitudes should be highly reliable, even for most subcategories.

Contradictory BLS Surveys

There are a few other possible signs of a weakening labor market in recent employment data. One such development is a gap between new job numbers from the Establishment Survey (non-farm payrolls) and the Household Survey (total employment). The following table (taken from the December 2nd BLS Report for households) is from a series of tweets by Elise Gould:

Total employment from the Household Survey has actually declined by almost 470,000 the past two months, while non-farm payrolls have increased by a total of over 500,000. Turning points in employment from the Household Survey tend to lead non-farm payrolls, so this could foretell a softening. While the Household Survey is smaller than the Establishment Survey, it is broader in some respects, covering several categories of workers who aren’t counted on non-farm payrolls, including agricultural workers and the self-employed. The latter are a more significant part of the employed population given the rise in the so-called gig economy. Self-employed workers (unincorporated) have declined by more than 170,000 over the past two months. However, it’s not clear that these workers would be affected earlier than others around turning points.

A separate employment report by ADP Research noted a sharp slowdown in private sector hiring in November, with the most weakness in construction and interest rate sensitive industries. The report also noted that fewer workers are leaving jobs voluntarily.

Is the Labor Market Tight Or Loose?

Nominal wages are rising at an accelerating pace, which might make it more difficult for the Fed to rein-in inflation. However, wages are still rising less than prices — as of October, real hourly earnings had declined 1.9% over the past year. November will mark 20 straight months of declines in the real wage. The drop in real weekly earnings is even steeper, given a slight decline in the average workweek. If we’re looking for a silver lining, inflation and declines in real earnings mean that employers have gained additional incentive to hire. Perhaps that can be offered as one reason for persistent strength in the payroll numbers.

There are still more than 10 million job openings across the country, but only 6 million workers are unemployed. Again, many would-be job candidates are sitting things out. (Perhaps they are mostly terrible candidates, given their apparent disinterest in work.) Some observers assume this means that the labor market is extremely tight, yet real wages are declining, as if there were an excess supply of workers! The answer to this “puzzle” is that many vacancies are ultimately filled by candidates who were already employed. Also, there is a large number of underemployed workers. Thus, the available pool of candidates is much larger than the number available due to unemployment. It’s not outlandish to think that there is actually an excess supply of labor at the moment, rather than excess demand, but that doesn’t bode well for real wage gains going forward.

Conclusion

Despite an ostensibly strong labor market, there are reasons to think that strength is waning, even without appeal to other economic and financial indicators. The BLS household survey showed recent declines in employment, as did the ADP survey, and we’ve seen an increase in the share of job losers among the unemployed. High-profile layoff announcements should also give pause. The recessionary outlook is reinforced by a number of other indicators, but most of all, the Federal Reserve’s tightening of the money supply is bound to have a stronger impact on the economy in 2023, and the Fed is not finished tightening yet.

Follow Sacred Cow Chips on WordPress.com

Recent Posts

  • Immigration and Merit As Fiscal Propositions
  • Tariff “Dividend” From An Indigent State
  • Almost Looks Like the Fed Has a 3% Inflation Target
  • Government Malpractice Breeds Health Care Havoc
  • A Tax On Imports Takes a Toll on Exports

Archives

  • December 2025
  • November 2025
  • October 2025
  • September 2025
  • August 2025
  • July 2025
  • June 2025
  • May 2025
  • April 2025
  • March 2025
  • February 2025
  • January 2025
  • December 2024
  • November 2024
  • October 2024
  • September 2024
  • August 2024
  • July 2024
  • June 2024
  • May 2024
  • April 2024
  • March 2024
  • February 2024
  • January 2024
  • December 2023
  • November 2023
  • August 2023
  • July 2023
  • June 2023
  • May 2023
  • April 2023
  • March 2023
  • February 2023
  • January 2023
  • December 2022
  • November 2022
  • October 2022
  • September 2022
  • August 2022
  • July 2022
  • June 2022
  • May 2022
  • April 2022
  • March 2022
  • February 2022
  • January 2022
  • December 2021
  • November 2021
  • October 2021
  • September 2021
  • August 2021
  • July 2021
  • June 2021
  • May 2021
  • April 2021
  • March 2021
  • February 2021
  • January 2021
  • December 2020
  • November 2020
  • October 2020
  • September 2020
  • August 2020
  • July 2020
  • June 2020
  • May 2020
  • April 2020
  • March 2020
  • February 2020
  • January 2020
  • December 2019
  • November 2019
  • October 2019
  • September 2019
  • August 2019
  • July 2019
  • June 2019
  • May 2019
  • April 2019
  • March 2019
  • February 2019
  • January 2019
  • December 2018
  • November 2018
  • October 2018
  • September 2018
  • August 2018
  • July 2018
  • June 2018
  • May 2018
  • April 2018
  • March 2018
  • February 2018
  • January 2018
  • December 2017
  • November 2017
  • October 2017
  • September 2017
  • August 2017
  • July 2017
  • June 2017
  • May 2017
  • April 2017
  • March 2017
  • February 2017
  • January 2017
  • December 2016
  • November 2016
  • October 2016
  • September 2016
  • August 2016
  • July 2016
  • June 2016
  • May 2016
  • April 2016
  • March 2016
  • February 2016
  • January 2016
  • December 2015
  • November 2015
  • October 2015
  • September 2015
  • August 2015
  • July 2015
  • June 2015
  • May 2015
  • April 2015
  • March 2015
  • February 2015
  • January 2015
  • December 2014
  • November 2014
  • October 2014
  • September 2014
  • August 2014
  • July 2014
  • June 2014
  • May 2014
  • April 2014
  • March 2014

Blogs I Follow

  • Passive Income Kickstart
  • OnlyFinance.net
  • TLC Cholesterol
  • Nintil
  • kendunning.net
  • DCWhispers.com
  • Hoong-Wai in the UK
  • Marginal REVOLUTION
  • Stlouis
  • Watts Up With That?
  • Aussie Nationalist Blog
  • American Elephants
  • The View from Alexandria
  • The Gymnasium
  • A Force for Good
  • Notes On Liberty
  • troymo
  • SUNDAY BLOG Stephanie Sievers
  • Miss Lou Acquiring Lore
  • Your Well Wisher Program
  • Objectivism In Depth
  • RobotEnomics
  • Orderstatistic
  • Paradigm Library
  • Scattered Showers and Quicksand

Blog at WordPress.com.

Passive Income Kickstart

OnlyFinance.net

TLC Cholesterol

Nintil

To estimate, compare, distinguish, discuss, and trace to its principal sources everything

kendunning.net

The Future is Ours to Create

DCWhispers.com

Hoong-Wai in the UK

A Commonwealth immigrant's perspective on the UK's public arena.

Marginal REVOLUTION

Small Steps Toward A Much Better World

Stlouis

Watts Up With That?

The world's most viewed site on global warming and climate change

Aussie Nationalist Blog

Commentary from a Paleoconservative and Nationalist perspective

American Elephants

Defending Life, Liberty and the Pursuit of Happiness

The View from Alexandria

In advanced civilizations the period loosely called Alexandrian is usually associated with flexible morals, perfunctory religion, populist standards and cosmopolitan tastes, feminism, exotic cults, and the rapid turnover of high and low fads---in short, a falling away (which is all that decadence means) from the strictness of traditional rules, embodied in character and inforced from within. -- Jacques Barzun

The Gymnasium

A place for reason, politics, economics, and faith steeped in the classical liberal tradition

A Force for Good

How economics, morality, and markets combine

Notes On Liberty

Spontaneous thoughts on a humble creed

troymo

SUNDAY BLOG Stephanie Sievers

Escaping the everyday life with photographs from my travels

Miss Lou Acquiring Lore

Gallery of Life...

Your Well Wisher Program

Attempt to solve commonly known problems…

Objectivism In Depth

Exploring Ayn Rand's revolutionary philosophy.

RobotEnomics

(A)n (I)ntelligent Future

Orderstatistic

Economics, chess and anything else on my mind.

Paradigm Library

OODA Looping

Scattered Showers and Quicksand

Musings on science, investing, finance, economics, politics, and probably fly fishing.

  • Subscribe Subscribed
    • Sacred Cow Chips
    • Join 128 other subscribers
    • Already have a WordPress.com account? Log in now.
    • Sacred Cow Chips
    • Subscribe Subscribed
    • Sign up
    • Log in
    • Report this content
    • View site in Reader
    • Manage subscriptions
    • Collapse this bar
 

Loading Comments...