• About

Sacred Cow Chips

Sacred Cow Chips

Tag Archives: COVID

Banished Illusions: They Screwed the People and the Country

22 Thursday Jul 2021

Posted by Nuetzel in Constitution, Corruption, Election Fraud

≈ Leave a comment

Tags

Adam Schiff, Biden Inc. Hunter Biden, Big Tech, Brett Kavanaugh, Capitol Police, COVID, Darryl Cooper, DNC, Donald Trump, Election Fraud, Insurrection, James Comey, John Brennan, MartyrMade, Pay-For-Play, Propaganda, Tyler O’Neil, Voting Procedures

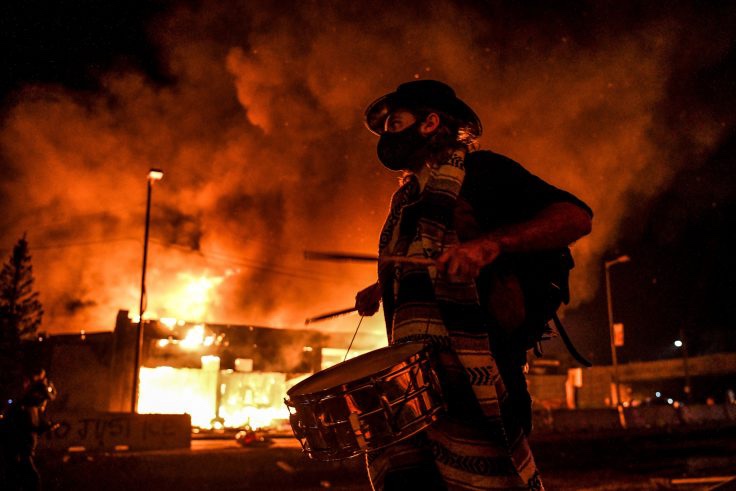
There’s no shortage of nincompoops buying into the legitimacy of the Biden presidency and the bullshit narrative about “an insurrection” at the U.S. Capitol building on January 6th. I’m sure they’re quite content in their ignorance — they refuse to even consider the evidence available regarding the lack of ballot integrity in Arizona, Georgia, Pennsylvania, Texas, and elsewhere, and they continue to pretend the January 6th debacle was a real threat to our democracy, rather than a largely peaceful group of wide-eyed goofballs who were mostly waved through the barricades by the Capitol Police.

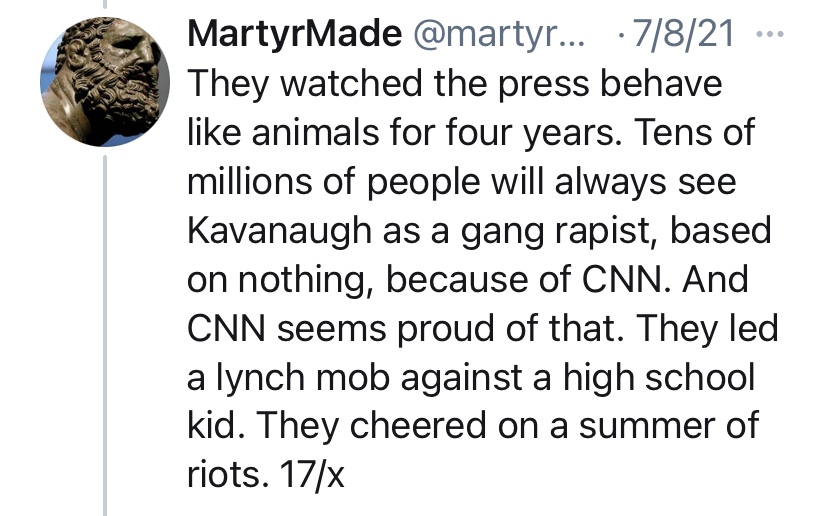
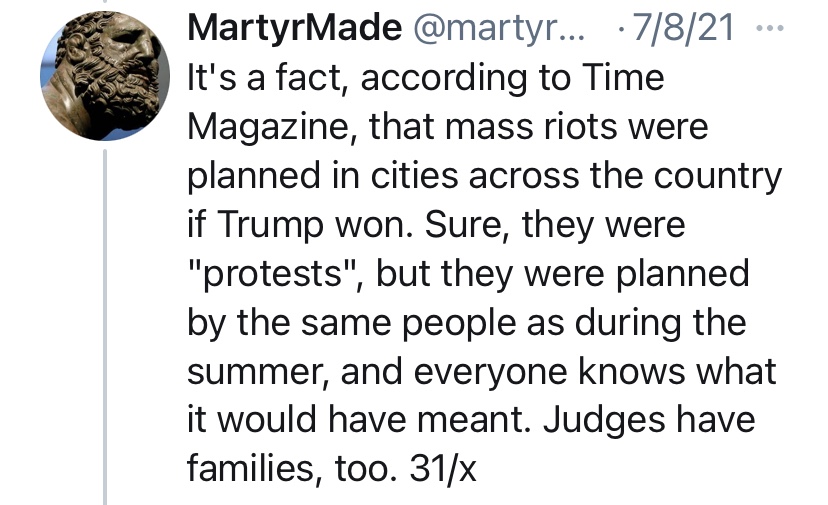
One of the best summaries I’ve read about the attitudes of those who feel disenfranchised by the 2020 election is this series of tweets by the of the MartyrMade podcast, Darryl Cooper. His tweets are also discussed here by Tyler O’Neil. It is Cooper’s “general theory” on the perspective of “Boomer tier” Trump supporters, as he calls them. Last year’s fraudulent election was only the culmination of events going back to the investigation of Donald Trump’s 2016 campaign. The whole thread is interesting, but you must get past a little “soft cover” at the start that might have been intended to distract the speech police at Twitter. I’ll try to summarize here:

  • The intelligence community spied on the Trump campaign in 2016, and that’s a major transgression! The DNC was involved too, actually paying for fabricated evidence. James Comey falsely denied any knowledge of that fact. John Brennan and Adam Schiff also lied shamelessly in this affair.
  • By the time Trump supporters realized all the noise was fake, they naively expected justice to be served. But no, and so their faith in certain institutions was shaken.
  • The gaslighting continued, and the whole thing consumed energy and had a chilling effect on participation in the Trump Administration. This was an active kind of subversion crossing “all institutional boundaries”.
  • The participation of the press was the poison icing on the cake. The press is now viewed by much of the country as a propaganda arm of “The Regime”.
  • Many aren’t sure whether the election was fixed, but if it was, they know they’d be lied to about it. 
  • Voting procedures in many jurisdictions were changed using COVID as a pretext. 
  • The press smoke-screened the Biden, Inc. scandals, including evidence of pay-for-play and incredibly lurid information on Hunter Biden’s laptop. Instead, the press played-up gossip about Trump. 
  • Trump people rightly felt betrayed by the very institutions they’ve always trusted, but they voted in record numbers, and we’re not convinced all were counted.
  • “But when the four critical swing states went dark at midnight, they knew.”
  • Conspiracy theories abounded, but media and tech shut down discussion of real anomalies. Had the election gone Trump’s way, they would have cried foul! 
  • The courts were handcuffed by fear of political violence and retribution.

I agree with substantially all of Cooper’s thread. Our experience since Donald Trump became an active politician has been disillusioning in several respects: it has shown how flimsy our constitutional rights and our republic are when the wrong actors come to dominate certain institutions. It also shows how malleable are the “facts” that we are asked to accept by these actors. We are seemingly helpless to defend the rule of law, the Constitution, and social norms when an intransigent minority decides it can simply ignore them. This is how tyranny is borne.

Election integrity is not an outlandish objective. Neither is demanding fair treatment of diverse viewpoints from social media, Big Tech, and educational institutions. And neither is it outlandish to demand safe communities and adequate police protection; that our borders be enforced; that our public health officials speak honestly about risks; and that we should never, under any circumstances, be judged, punished, or rewarded based on the color of our skin. These are just a few of the things we must demand, and never take “no” for an answer.

Most Hospitals Have Ample Capacity

05 Saturday Dec 2020

Posted by Nuetzel in Coronavirus, Health Care

≈ 1 Comment

Tags

AJ Kay, CARES Act, CDC, CLI, COVID, COVID-Like Illness, Don Wolt, Emergency Use Authorization, FAIR Health, False Positives, FDA, HealthData.gov, Hospital Utiluzation, Houston Methodist Hospital, ICU Utilization, ILI, Influenza-Like Illness, Intensive Care, Length of Stay, Marc Boom, Observation Beds, PCR Tests, Phil Kerpen, Remdesivir, Staffed Beds, Statista

Let’s get one thing straight: when you read that “hospitalizations have hit record highs”, as the Wall Street Journal headline blared Friday morning, they aren’t talking about total hospitalizations. They reference a far more limited set of patients: those admitted either “for” or “with” COVID. And yes, COVID admissions have increased this fall nationwide, and especially in certain hot spots (though some of those are now coming down). Admissions for respiratory illness tend to be highest in the winter months. However, overall hospital capacity utilization has been stable this fall. The same contrast holds for ICU utilization: more COVID patients, but overall occupancy rates have been fairly stable. Several factors account for these differing trends.

Admissions and Utilization

First, take a look at total staffed beds, beds occupied, and beds occupied by COVID patients (admitted “for” or “with” COVID), courtesy of Don Wolt. Notice that COVID patients occupied about 14% of all staffed beds over the past week or so, and total beds occupied are at about 70% of all staffed beds.

Is this unusual? Utilization is a little high based on the following annual averages of staffed-bed occupancy from Statista (which end in 2017, unfortunately). I don’t have a comparable utilization average for the November 30 date in recent years. However, the medical director interviewed at this link believes there is a consensus that the “optimal” capacity utilization rate for hospitals is as high as 85%! On that basis, we’re fine in the aggregate!

The chart below shows that about 21% of staffed Intensive Care Unit (ICU) beds are occupied by patients having COVID infections, and 74% of all ICU beds are occupied.

Here’s some information on the regional variation in ICU occupancy rates by COVID patients, which pretty much mirror the intensity of total beds occupied by COVID patients. Fortunately, new cases have declined recently in most of the states with high ICU occupancies.

Resolving an Apparent Contradiction

There are several factors that account for the upward trend in COVID admissions with stable total occupancy. Several links below are courtesy of AJ Kay:

  • The flu season has been remarkably light, though outpatients with symptoms of influenza-like illness (ILI) have ticked-up a bit in the past couple of weeks. Still, thus far, the light flu season has freed up hospital resources for COVID patients. Take a look at the low CDC numbers through the first nine weeks of the current flu season (from Phil Kerpen):
  • There is always flexibility in the number of staffed beds both in ICUs and otherwise. Hospitals adjust staffing levels, and beds are sometimes reassigned to ICUs or from outpatient use to inpatient use. More extreme adjustments are possible as well, as when hallways or tents are deployed for temporary beds. This tends to stabilize total bed utilization.
  • The panic about the fall wave of the virus sowed by media and public officials has no doubt “spooked” individuals into deferring care and elective procedures that might require hospitalization. This has been an unfortunate hallmark of the pandemic with terrible medical implications, but it has almost surely freed-up capacity.
  • COVID beds occupied are inflated by a failure to distinguish between patients admitted “for” COVID-like illness (CLI) and patients admitted for other reasons but who happen to test positive for COVID — patients “with” COVID (and all admissions are tested).
  • Case inflation from other kinds of admissions is amplified by false positives, which are rife. This leads to a direct reallocation of patients from “beds occupied” to “COVID beds occupied”.
  • In early October, the CDC changed its guidelines for bed counts. Out-patients presenting CLI symptoms or a positive test, and who are assigned to a bed for observation for more than eight hours, were henceforth to be included in COVID-occupied beds.
  • Also in October, the FDA approve an Emergency Use Authorization for Remdesivir as a first line treatment for COVID. That requires hospitalization, so it probably inflated COVID admissions.
  • The CDC also announced severe penalties in October for facilities which fail to meet its rather inclusive COVID reporting requirements, creating another incentive to capture any suspected COVID case in its reports.

In addition to the above, let’s not forget: early on, hospitals were given an incentive to diagnose patients with COVID, whether tested or merely “suspected”. The CARES Act authorized $175 billion dollars for hospitals for the care of COVID patients. In the spring and even now, hospitals have lost revenue due to the cancellation of many elective procedures, so the law helped replace those losses (though the distribution was highly uneven). The point is that incentives were and still are in place to diagnose COVID to the extent possible under the law (with a major assist from false-positive PCR tests).

Improved Treatment and Treatment

While more COVID patients are using beds, they are surviving their infections at a much higher rate than in the spring, according to data from FAIR Health. Moreover, the average length of their hospital stay has fallen by more than half, from 10.5 to 4.6 days. That means beds turn over more quickly, so more patients can be admitted over a week or month while maintaining a given level of hospital occupancy.

The CDC just published a report on “under-reported” hospitalization, but as AJ Kay notes, it can only be described as terrible research. Okay, propaganda is probably a better word! Biased research would be okay as well. The basic idea is to say that all non-hospitalized, symptomatic COVID patients should be counted as “under-counted” hospitalizations. We’ve entered the theater of the absurd! It’s certainly true that maxed-out hospitals must prioritize admissions based on the severity of cases. Some patients might be diverted to other facilities or sent home. Those decisions depend on professional judgement and sometimes on the basis of patient preference. But let’s not confuse beds that are unoccupied with beds that “should be occupied” if only every symptomatic COVID patient were admitted.

Regional Differences

Finally, here’s a little more information on regional variation in bed utilization from the HealthData.gov web site. The table below lists the top 25 states by staffed bed utilization at the end of November. A few states are highlighted based on my loose awareness of their status as “COVID “hot spots” this fall (and I’m sure I have overlooked a couple. Only two states were above 80% occupancy, however.

The next table shows the 25 states with the largest increase in staffed bed utilization during November. Only a handful would appear to be at all alarming based on these increases, but Missouri, for example, at the top of the list, still had 27% of beds unoccupied on November 30. Also, 21 states had decreases in bed utilization during November. Importantly, it is not unusual for hospitals to operate with this much headroom or less, which many administrators would actually prefer.

Of course, certain local markets and individual hospitals face greater capacity pressures at this point. Often, the most crimped situations are in small hospitals in underserved communities. This is exacerbated by more limited availability of staff members with school-age children at home due to school closures. Nevertheless, overall needs for beds look quite manageable, especially in view of some of the factors inflating COVID occupancy.

Conclusion

Marc Boom, President and CEO of Houston Methodist Hospital, had some enlightening comments in this article:

“Hospital capacity is incredibly fluid, as Boom explained on the call, with shifting beds and staffing adjustments an ongoing affair. He also noted that as a rule, hospitals actually try to operate as near to capacity as possible in order to maximize resources and minimize cost burdens. Boom said numbers from one year ago, June 25, 2019, show that capacity was at 95%.”

So there are ample beds available at most hospitals. A few are pinched, but resources can and should be devoted to diverting serious COVID cases to other facilities. But on the whole, the panic over hospital capacity for COVID patients is unwarranted.

November Pandemic Perspective

18 Wednesday Nov 2020

Posted by Nuetzel in Coronavirus, Pandemic, Uncategorized

≈ Leave a comment

Tags

@tlowdon, Actual Date of Death, COVID, COVID Testing, COVID-Like Illness, Don Wolt, Excess Deaths, False Positives, Hospitalizations, ILI, Influenza-Like Illness, PCR Tests, Reported Deaths

I hope readers share my compulsion to see updated COVID numbers. It’s become a regular feature on this blog and will probably remain one until infections subside, vaccine or otherwise. Or maybe when people get used to the idea of living normally again in the presence of an endemic pathogen, as they have with many other pathogens and myriad risks of greater proportions, and as they should. That might require more court challenges, political changes, and plain old civil disobedience.

So here, then, is an update on the U.S. COVID numbers released over the past few days. The charts below are attributable to Don Wolt (@tlowdon on Twitter).

First, reported deaths began to creep up again in the latter half of October and have escalated in November. They’ve now reached the highs of the mid-summer wave in the south, but this time the outbreak is concentrated in the midwest and especially the upper midwest.

Reported deaths are the basis of claims that we are seeing 1,500 people dying every day, which is an obvious exaggeration. There have been recent days when reported deaths exceeded that level, but the weekly average of reported deaths is now between 1,100 and 1,200 a day.

It’s important to understand that deaths reported in a given week actually occurred earlier, sometimes eight or more weeks before the week in which they are reported. Most occur within three weeks of reporting, but sometimes the numbers added from four-plus weeks earlier are significant.

The following chart reproduces weekly reported deaths from above using blue bars, ending with the week of November 14th. Deaths by actual date-of-death (DOD) are shown by the orange bars. The most recent three-plus weeks always show less than complete counts of deaths by DOD. But going back to mid-October, actual weekly deaths were running below reported deaths. If the pattern were to follow the upswings of the first two waves of infections, then actual weekly deaths would exceed reported deaths by perhaps the end of October. However, it’s doubtful that will occur, in part because we’ve made substantial progress since the spring and summer in treating the disease.

To reinforce the last point, it’s helpful to view deaths relative to COVID case counts. Deaths by DOD are plotted below by the orange line using the scale on the right-hand vertical axis. New positive tests are represented by the solid blue line, using the left-hand axis, along with COVID hospitalizations. There is no question that the relationship between cases, hospitalizations, and deaths has weakened over time. My suspicions were aroused somewhat by the noticeable compression of the right axis for deaths relative to the two charts above, but on reviewing the actual patterns (peak relative to troughs) in those charts, I’m satisfied that the relationships have indeed “decoupled”, as Wolt puts it.

Cases are going through the roof, but there is strong evidence that a large share of these cases are false positives. COVID hospitalizations are up as well, but their apparent co-movement with new cases appears to be dampening with successive waves of the virus. That’s at least partly a consequence of the low number of tests early in the pandemic.

So where is this going? The next chart again shows COVID deaths by DOD using orange bars. Wolt has concluded, and I have reported here, that the single-best short-term predictor of COVID deaths by DOD is the percentage of emergency room visits at which patients presented symptoms of either COVID-like illness (CLI) or influenza-like illness (ILI). The sum of these percentages, CLI + ILI, is shown below by the dark blue line, but the values are shifted forward by three weeks to better align with deaths. This suggests that actual COVID deaths by DOD will be somewhere around 7,000 a week by the end of November, or about 1,000 a day. Beyond that time, the path will depend on a number of factors, including the weather, prevalence and immunity levels, and changes in mobility.

I am highly skeptical that lockdowns have any independent effect in knocking down the virus, though interventionists will try to take credit if the wave happens to subside soon for any other reason. They won’t take credit for the grim lockdown deaths reaped by their policies.

Despite the bleak prospect of 1,000 or more COVID-attributed deaths a day by the end of November, the way in which these deaths are counted is suspect. Early in the pandemic, the CDC significantly altered guidelines for the completion of death certificates for COVID such that deaths are often improperly attributed to the virus. Some COVID deaths stem from false-positive PCR tests, and again, almost since the beginning of the pandemic, hospitals were given a financial incentive to classify inpatients as COVID-infected.

It’s also important to remember that while any true COVID fatality is premature, they are generally not even close to the prematurity of lockdown deaths. That’s a simple consequence of the age profile of COVID deaths, which indicate relatively few life-years lost, and the preponderance of co-morbidities among COVID fatalities.

Again, COVId deaths are bad enough, but we are seeing an unacceptable and ongoing level of lockdown deaths. This is now to the point where they may account for almost all of the continuing excess deaths, even with the fall COVID wave. It’s probable that public health would be better served with reduced emphasis on COVID-mitigation for the general population and more intense focus on protecting the vulnerable, including the distribution of vaccines.

Follow Sacred Cow Chips on WordPress.com

Recent Posts

  • The Dreaded Social Security Salvage Job
  • Tariffs, Content Quotas, and What Passes for Patriotism
  • Carbon Credits and Green Bonds Are Largely Fake
  • The Wasteful Nature of Recycling Mandates
  • Broken Windows: Destroying Wealth To Create Green Jobs

Archives

  • March 2023
  • February 2023
  • January 2023
  • December 2022
  • November 2022
  • October 2022
  • September 2022
  • August 2022
  • July 2022
  • June 2022
  • May 2022
  • April 2022
  • March 2022
  • February 2022
  • January 2022
  • December 2021
  • November 2021
  • October 2021
  • September 2021
  • August 2021
  • July 2021
  • June 2021
  • May 2021
  • April 2021
  • March 2021
  • February 2021
  • January 2021
  • December 2020
  • November 2020
  • October 2020
  • September 2020
  • August 2020
  • July 2020
  • June 2020
  • May 2020
  • April 2020
  • March 2020
  • February 2020
  • January 2020
  • December 2019
  • November 2019
  • October 2019
  • September 2019
  • August 2019
  • July 2019
  • June 2019
  • May 2019
  • April 2019
  • March 2019
  • February 2019
  • January 2019
  • December 2018
  • November 2018
  • October 2018
  • September 2018
  • August 2018
  • July 2018
  • June 2018
  • May 2018
  • April 2018
  • March 2018
  • February 2018
  • January 2018
  • December 2017
  • November 2017
  • October 2017
  • September 2017
  • August 2017
  • July 2017
  • June 2017
  • May 2017
  • April 2017
  • March 2017
  • February 2017
  • January 2017
  • December 2016
  • November 2016
  • October 2016
  • September 2016
  • August 2016
  • July 2016
  • June 2016
  • May 2016
  • April 2016
  • March 2016
  • February 2016
  • January 2016
  • December 2015
  • November 2015
  • October 2015
  • September 2015
  • August 2015
  • July 2015
  • June 2015
  • May 2015
  • April 2015
  • March 2015
  • February 2015
  • January 2015
  • December 2014
  • November 2014
  • October 2014
  • September 2014
  • August 2014
  • July 2014
  • June 2014
  • May 2014
  • April 2014
  • March 2014

Blogs I Follow

  • Ominous The Spirit
  • Passive Income Kickstart
  • OnlyFinance.net
  • TLC Cholesterol
  • Nintil
  • kendunning.net
  • DCWhispers.com
  • Hoong-Wai in the UK
  • Marginal REVOLUTION
  • Stlouis
  • Watts Up With That?
  • Aussie Nationalist Blog
  • American Elephants
  • The View from Alexandria
  • The Gymnasium
  • A Force for Good
  • Notes On Liberty
  • troymo
  • SUNDAY BLOG Stephanie Sievers
  • Miss Lou Acquiring Lore
  • Your Well Wisher Program
  • Objectivism In Depth
  • RobotEnomics
  • Orderstatistic
  • Paradigm Library

Blog at WordPress.com.

Ominous The Spirit

Ominous The Spirit is an artist that makes music, paints, and creates photography. He donates 100% of profits to charity.

Passive Income Kickstart

OnlyFinance.net

TLC Cholesterol

Nintil

To estimate, compare, distinguish, discuss, and trace to its principal sources everything

kendunning.net

The future is ours to create.

DCWhispers.com

Hoong-Wai in the UK

A Commonwealth immigrant's perspective on the UK's public arena.

Marginal REVOLUTION

Small Steps Toward A Much Better World

Stlouis

Watts Up With That?

The world's most viewed site on global warming and climate change

Aussie Nationalist Blog

Commentary from a Paleoconservative and Nationalist perspective

American Elephants

Defending Life, Liberty and the Pursuit of Happiness

The View from Alexandria

In advanced civilizations the period loosely called Alexandrian is usually associated with flexible morals, perfunctory religion, populist standards and cosmopolitan tastes, feminism, exotic cults, and the rapid turnover of high and low fads---in short, a falling away (which is all that decadence means) from the strictness of traditional rules, embodied in character and inforced from within. -- Jacques Barzun

The Gymnasium

A place for reason, politics, economics, and faith steeped in the classical liberal tradition

A Force for Good

How economics, morality, and markets combine

Notes On Liberty

Spontaneous thoughts on a humble creed

troymo

SUNDAY BLOG Stephanie Sievers

Escaping the everyday life with photographs from my travels

Miss Lou Acquiring Lore

Gallery of Life...

Your Well Wisher Program

Attempt to solve commonly known problems…

Objectivism In Depth

Exploring Ayn Rand's revolutionary philosophy.

RobotEnomics

(A)n (I)ntelligent Future

Orderstatistic

Economics, chess and anything else on my mind.

Paradigm Library

OODA Looping

  • Follow Following
    • Sacred Cow Chips
    • Join 121 other followers
    • Already have a WordPress.com account? Log in now.
    • Sacred Cow Chips
    • Customize
    • Follow Following
    • Sign up
    • Log in
    • Report this content
    • View site in Reader
    • Manage subscriptions
    • Collapse this bar
 

Loading Comments...