• About

Sacred Cow Chips

Sacred Cow Chips

Tag Archives: MIT

Biden OMB Suggests Minimal Discounts of Future Benefits

28 Wednesday Jun 2023

Posted by Nuetzel in Big Government, Risk, Tradeoffs

≈ Leave a comment

Tags

Administrative State, Certainty Equivalent, Consumer Price Index, Discount Rate, John Cochrane, Joshua Rauh, MIT, Modernizing Regulatory Review, Office of Management and Budget, Present Value, Real Interest Rate, Regulatory Impact Analysis, Risk-Free Rate, TIPS, Tradeoffs, Treasury Bonds, Unintended Consequences

Tweaks to the projected costs and benefits of prospective regulations or programs can be a great way to encourage domination of resources and society by the state. Of course, public policy ideas will never receive serious consideration unless their “expected” benefits exceed costs. It’s therefore critical that the validity of cost and benefit estimates — to say nothing of their objectivity — are always subject to careful review. By no means does that ensure that the projections are reasonable, however.

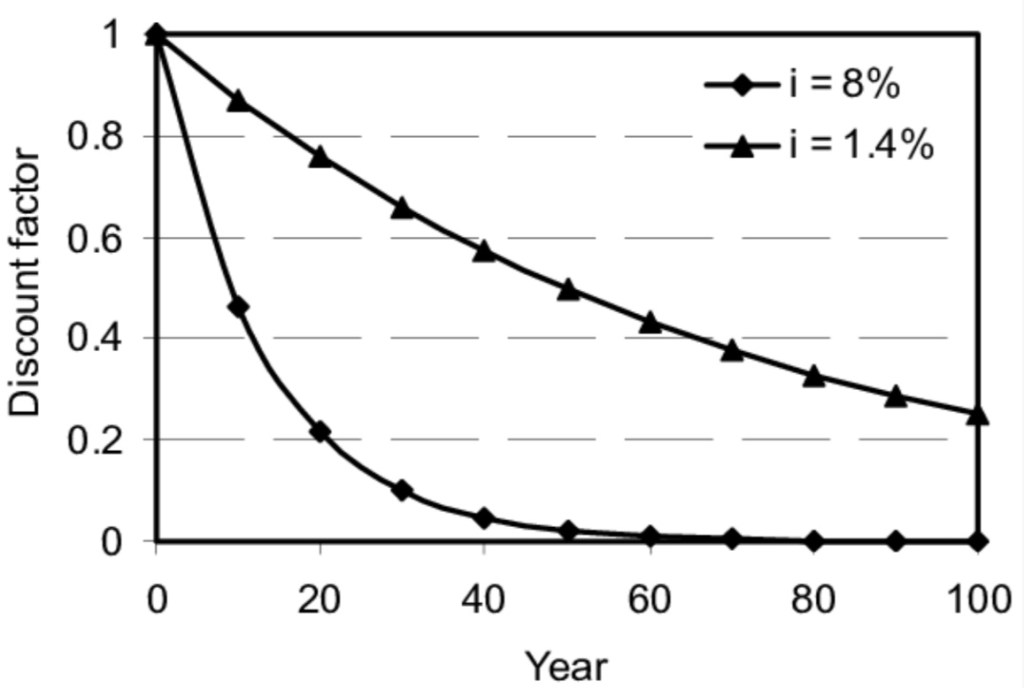
Traditionally less scrutinized is the rate at which the future costs and benefits of a program or regulation are discounted into present value terms. The discount rate can have a tremendous impact on the comparison of costs and benefits when their timing differs significantly, which is usually the case.

Intertemporal Tradeoffs

People generally aren’t willing to forsake present pleasure without at least a decent prospect of future gain. Thus, we observe that the deferral of $1 of consumption today generally brings a reward of more than $1 of future consumption. That’s made possible by the existence of productive opportunities for the use of resources. These opportunities, and the freedom to exploit them, allow a favorable tradeoff at which we transform resources across time for the benefit of both our older selves and our progeny. The interaction of savers and investors in such opportunities results in an equilibrium interest rate balancing the supply and demand for saving.

We can restate the tradeoff to demonstrate the logic of discounting. That is, the promise of $1 in the future induces the voluntary deferral of less than $1 of consumption today. To arrive at the amount of the deferral, the promised $1 in the future is discounted at the consumer’s rate of time preference. The promised $1 must cover the initial deferral of consumption plus the consumer’s perceived opportunity cost of lost consumption in the present, or else the “trade” won’t happen.

Discounting practices are broadly embedded in the economy. They provide a rational basis of evaluating inter-temporal tradeoffs. The calculation of net present values (NPVs) and internal rates of return (the discount rate at which NPV = 0) are standard practices for capital budgeting decisions in the private sector. Public-sector cost-benefit analysis often makes use of discounting methodology as well, which is unequivocally good as long as the process is not rigged.

Government Discounting

The Office of Management and Budget (OMB) provides guidance to federal agencies on matters like cost-benefit analysis. As part of a recent proposal that was prompted by executive orders on “Modernizing Regulatory Review” from the Biden Administration, the OMB has recommended revisions to a 2003 Circular entitled “Regulatory Analysis”. A major aspect of the proposal is a downward adjustment to recommended discount rates, largely dressed up as an update for “changes in market conditions”.

Since 2003, the OMB’s guidance on discount rates called for use of a historical average rate on 10-year government bonds. Before averaging, the rate was converted to a “real rate” in each period by subtracting the rate of increase in the Consumer Price Index (CPI). The baseline discount rate of 3% was taken from the average of that real rate over the 30 years ending in 2002. There has been an alternative discount rate of 7% under the existing guidance intended as a nod to the private costs of capital, but it’s not clear how seriously agencies took this higher value.

The new proposal seeks to update the calculation of recommended discount rates by using more recent data on Treasury rates and inflation. One aspect of the proposal is to utilize the rate on 10-year inflation-indexed Treasury bonds (TIPS) for the years in which it is available (2003-2022). The first ten years of the “new” 30-year average would use the previous methodology. However, the proposal gives examples of how other methods would change the resulting discount rate and requests comments on the most appropriate method of updating the calculation of the 30-year average.

The new baseline discount rate proposed by OMB is 1.7%, and it is lower still for very distant flows of benefits. This is intended as a real, after-tax discount rate on Treasury bonds. It represents an average (and ex post) risk-free rate on bonds held to maturity over the historical period in question, calculated as described by OMB. However, like the earlier guidance, it is not prospective in any sense. And of course it is quite low!

Our Poor Little Rich Ancestors

The projected benefits of regulations or other public initiatives can be highly dubious in the first place. Unintended consequences are the rule rather than the exception. Furthermore, even modest economic growth over several generations will leave our ancestors with far more income and wealth than we have at our disposal today. That means their ability to adapt to changes will be far superior, and they will have access to technologies making our current efforts seem quaint.

Now here’s the thing: discounting the presumed benefits of government intervention at a low rate would drastically inflate their present value. John Cochrane uses an extreme case to illustrate the point. Suppose a climate policy is projected to avoid costs equivalent to 5% of GDP 100 years from now. Those avoided costs would represent a gigantic sum! By then, at just 2% growth, real GDP will be over seven times larger than this year’s output. Cochrane calculates that 5% of real GDP in 2123 is equivalent to 37% of 2023 real GDP. And the presumed cost saving goes on forever.

We can calculate the present value of the climate policy’s benefits to determine whether it’s greater than the proposed cost of the policy. Let’s choose a fairly low discount rate like … oh, say zero. In that case, the present value is infinite, and it is infinite at any discount rate below 2% (such as 1.7%). That’s because the benefits grow at 2% (like real GDP) and go on forever! That’s faster than the diminishing effect of discounting on present value. In mathematical terms, the series does not converge. Of course, this is not discounting. It is non-discounting. Cochrane’s point, however, is that if you take these calculations seriously, you’d be crazy not to implement the policy at any finite cost! You shouldn’t mind the new taxes at all! Or the inflation tax induced by more deficit spending! Or higher regulatory costs passed along to you as a consumer! So just stop your bitching!

Formal Comments to OMB

If Cochrane’s example isn’t enough to convince you of the boneheadedness of the OMB proposal, there are several theoretical reasons to balk. Cochrane provides links to a couple of formal comments submitted to OMB. Joshua Rauh of the Stanford Business School details a few fundamental objections. His first point is that a regulatory impact analysis (RIA), or the evaluation of any other initiative, “should be based on market conditions that prevail at the time of the RIA”. In other words, the choice of a discount rate should not rely on an average over a lengthy historical period. Second, it is unrealistic to assume that the benefits and costs of proposed regulations are risk-free. In fact, unlike Treasury securities, these future streams are quite risky, and they are not tradable, and they are not liquid.

Rauh also notes that the OMB’s proposed decline in discount rates to be applied to benefits or cash flows in more distant periods has no reliable empirical basis. He believes that results based on a constant discount rate should at least be reported. Moreover, agencies should be required to offer justification for their choice of a discount rate relative to the risks inherent in the streams of costs and benefits on any new project or rule.

Rauh is skeptical of recommendations that agencies should add a theoretical risk premium to a risk-free rate, however, despite the analytical superiority of that approach. Instead, he endorses the simplicity of the OMB’s previous guidance for discount rates of 3% and 7%. But he also proposes that RIAs should always include “the complete undiscounted streams of both benefits and costs…”. If there are distributions of possible cost and benefit streams, then multiple streams should be included.

Furthermore, Rauh says that agencies should not recast streams of benefits in the form of certainty equivalents, which interpose various forms of objective functions in order to calculate a “fair guarantee”, rather than a range of actual outcomes. Instead, Rauh insists that straightforward expected values should be used, This is for the sake of transparency and to enable independent assessment of RIAs.

Another comment on the OMB proposal comes from a group of economists at MIT. They have fewer qualms than Rauh regarding the use of risk-adjusted discount rates by government agencies. In addition, they note that risk in the private sector can often be ameliorated by diversification, whereas risks inherent in public policy must be absorbed by changes in taxes, government spending, or unintended costs inflicted on the private sector. Taxpayers, those having stakes in other programs, and the general public bear these risks. Using Treasury rates for discounting presumes that bad outcomes have no cost to society!

Conclusion

Discounting the costs and benefits of proposed regulations and other government programs should be performed with discount rates that reflect risks. Treasury rates are wholly inappropriate as they are essentially risk-free over time horizons often much shorter than the streams of benefits and costs to be discounted. The OMB proposal might be a case of simple thoughtlessness, but I doubt it. To my mind, it aligns a little too neatly with the often expansive agenda of the administrative state. It would add to what is already a strong bias in favor of regulatory action and government absorption of resources. Champions of government intervention are prone to exaggerate the flow of benefits from their pet projects, and low discount rates exaggerate the political advantages they seek. That bias comes at the expense of the private sector and economic growth, where inter-temporal tradeoffs and risks are exploited only at more rational discounts and then tested by markets.

Predicted November COVID Deaths

08 Sunday Nov 2020

Posted by Nuetzel in Pandemic, Public Health

≈ 2 Comments

Tags

@tlowdon, Antibodies, CDC, COVID Deaths, Covid Tracking Project, COVID-Like Illness, ER Patient Symptoms, FiveThirtyEight, Flu Season, Herd Immunity, Humidity, Influenza-Type Illness, Iowa State, MIT, Predictive Models, Provisional Deaths, Seroprevalence, UCLA, University of Texas, Vitamin D

Reported COVID deaths do not reflect deaths that actually occurred in the reporting day or week, as I’ve noted several times. Here is a nice chart from @tlowdon on Twitter showing the difference between reported deaths and actual deaths for corresponding weeks. The blue bars are weekly deaths reported by the COVID Tracking Project. The solid orange bars are the CDC’s “provisional” deaths by actual week of death, which is less than complete for recent weeks because of lags in reporting. Still, it’s easy to see that reported deaths have overstated actual deaths each week since late August.

I should note that the orange bars represent deaths that involved COVID-19, though a COVID infection might not have actually killed them. This CDC report, updated on November 4th, shows the importance of co-morbidities, which in many cases are the actual cause of death according to pre-COVID, CDC guidance on death certificates.

Leading Indicators

Researchers have studied several measures in an effort to find leading indicators of COVID deaths. The list includes new cases diagnosed (PCR positivity) and the percentage of emergency room visits presenting symptoms of COVID-like illness (%CLI). These indicators are usually evaluated after shifting them in time by a few weeks in order to observe correlations with COVID deaths a few weeks later. Interestingly, @tlowdon reports that the best single predictor of actual COVID deaths over the course of a few weeks is the sum of the %CLI and the percentage of ER patients presenting symptoms of influenza-like illness (%ILI). Perhaps adding %ILI to %CLI strengthens the correlation because the symptoms of the flu and COVID are often mistaken for one another.

The chart below reproduces the orange bars from above representing deaths at actual dates of death. Also plotted are the %Positivity from COVID tests (shifted forward 2 weeks), %CLI (3 weeks), the %ILI (3 weeks), and the sum of %CLI and %ILI (3 weeks, the solid blue line). My guess is that %ILI contributes to the correlation with deaths mainly because %ILI’s early peak (which occurred in March) led the peak in deaths in April. Otherwise, there is very little variation in %ILI. That might change with the current onset of the flu season, but as I noted in my last post, the flu has been very subdued since last winter.

What About November?

So where does that leave us? The chart above ends with our leading indicator, CLI + ILI, brought forward from the first half of October. What’s happened to CLI + ILI since then? And what does that tell us to expect in November? The chart below is from the CDC’s web site. The red line is %CLI and the yellow line is %ILI. The sum of the two isn’t shown. However, there is no denying the upward trend in CLI, though the slope of CLI + ILI would be more moderate.

As of 10/31, CLI + ILI has increased by almost 40% since it’s low in early October. If the previous relationship holds up, that implies an increase of almost 40% in actual weekly COVID deaths from about 4,000 per week to about 5,500 per week by November 21 (a little less than 800 per day).

FiveThirtyEight has a compilation of 13 different forecast models with projections of deaths by the end of November. The estimate of 5,500 per week by November 21, or perhaps slightly less per week over the full month of November, would put total COVID deaths at the top of the range of the MIT, UCLA, Iowa State, and University of Texas models, but below or near the low end of ranges for eight other models. However, those models are based on reported deaths, so the comparison is not strictly valid. Reported deaths are still likely to exceed actual deaths by the end of November, and the actual death prediction would be squarely in the range of multiple reported death predictions. That reinforces the expectation an upward trend in actual deaths.

Third Wave States

States in the upper Midwest and upper Mountain regions have had the largest increases in cases per capita over the past few weeks. Using state abbreviations, the top ten are ND, SD, WI, IA, MT, NE, WY, UT, IL, and MN, with ID at #11 (according to the CDC’s COVID Data Tracker). One factor that might mediate the increase in cases, and ultimately deaths, is the possibility of early herd immunity: in the earlier COVID waves, the increase in infections abated once seroprevalence (the share of the population with antibodies from exposure) reached a level of 15% to 25%.

Unfortunately, estimates of seroprevalence by state are very imprecise. Thus far, reliable samples have been limited to states and metro areas that had heavy infections in the first and second waves. One rule of thumb, however, is that seroprevalence is probably less than 10x the cumulative share of a population having tested positive. To be very conservative, let’s assume a seroprevalence of four times cumulative cases. On that basis, half the states in the “top ten” listed above would already have seroprevalence above 15%. Those states are ND, SD, WI, IA, and NE. The others are mostly in a range of 12% to 15%, with MI coming in the lowest at about 9%.

This gives some cause for optimism that the wave in these states and others will abate fairly soon, but there are a number of uncertainties: first, the estimates of seroprevalence above, while conservative, are very imprecise, as noted above; second, the point at which herd immunity might cause the increase in new cases to begin declining is real guesswork (though we might have confirmation in a few states before long); third, we are now well into the fall season, with lower temperatures, lower humidity, less direct sunlight, and diminishing vitamin D levels. We do not have experience with COVID at this time of year, so we don’t know whether the patterns observed earlier in the year will be repeated. If so, new cases might begin to abate in some areas in November, but that probably wouldn’t be reflected in deaths until sometime in December. And if the flu comes back with a corresponding increase in CLI + ILI, then we’d expect further increases in actual deaths attributed to COVID. That is only a possibility given the weakness in flu numbers in 2020, however.

Closing Thoughts

I was excessively optimistic about the course of the pandemic in the U.S. in the spring. While this post has been moderately pessimistic, I believe there are reasons to expect fewer deaths than previous relationships would predict. We are far better at treating COVID now, and the vulnerable are taking precautions that have reduced their incidence of infections relative to younger and healthier cohorts. So if anything, I think the forecasts above will err on the high side.

Pesticides Preferable To Pests, Damaged Crops

08 Thursday Jan 2015

Posted by Nuetzel in Uncategorized

≈ Leave a comment

Tags

Autism, Biofortified, Coyote Blog, Discover, Facebook GMO Skepti-Forum, Glyphosate, Huffington Post, Kevin Drum, MIT, National Public Radio, pesticdes, Stephanie Seneff, Synthetic vs. natural pesticides, Warren Meyer

10269496_10152643243618460_6812219241634879386_n

The chart above is something of a joke, but it has a serious point: it provides evidence every bit as solid as some research making the rounds on social media. Bad science finds easy footholds on the internet, but more shocking is the ease with which it is tolerated and even promoted within academe. But according to Warren Meyer, we live in the age of “post-modern science“:

“It means that certain data, or an analysis, or experiment was somehow wrong or corrupted or failed typical standards of scientific rigor, but was none-the-less (sic) ‘accurate’. How can that be? Because accuracy is not defined as logical conformance to observations. It has been redefined as ‘consistent with the narrative.’”

Here is a particularly egregious example of scientific swill that I have seen posted several times over the past few days: “MIT Researcher: Glyphosate Herbicide will Cause Half of All Children to Have Autism by 2025“. The headline itself is more than sufficient to sound the BS alarm. This MIT “researcher”, Stephanie Seneff, is not a biologist, chemist, or geneticist. As it happens, she is a computer scientist (with advanced degrees in electrical engineering) who specializes in “text mining.” Her work, apart from serving as an activist, involves finding correlations between the appearance of words and “adverse outcomes” in reports and literature. She has a reputation in the scientific community as a bit of a “quack”. In this case, HuffPo goes so far as to say that her glyphosate research is “dumb.” Discover has also objected to Seneff’s work, and MIT’s tolerance of it.

A frequent refrain in critiques of research is that correlation is not causation, a fact that is demonstrated by the chart above and Seneff’s research. At best, Seneff presents evidence of correlation between the uses of certain words, the selection of which may be subject to severe bias. In addition, there is no convincing evidence that autism is increasing, but there is plenty  of evidence that the definition and diagnosis of autism have expanded dramatically. There is increasing evidence that autism is often of purely genetic origin.

Here are a couple of other useful links debunking Seneff’s work:

“Medical Doctors weigh in on Glyphosate Claims”

“Stephanie Seneff: Following the Geiers dumpster-diving in the VAERS database”

Synthetic pesticides like glyphosate are applied to crops in low concentrations that are unlikely to cause harm. So-called natural pesticides are often applied more heavily because they are less effective at controlling pests. It is not clear that one is safer than the other. Here is a nice piece on synthetic vs. natural pesticides.

Kevin Drum has asserted that the internet contributes to “cognitive inequality”. That is, it “makes smart people smarter and dumb people dumber”. The spread of disinformation like Seneff’s research via social media is a good case study of the latter part of Drum’s claim.

A big hat tip to members of the Facebook GMO Skepti-Forum for many of the links above.

Follow Sacred Cow Chips on WordPress.com

Recent Posts

  • Immigration and Merit As Fiscal Propositions
  • Tariff “Dividend” From An Indigent State
  • Almost Looks Like the Fed Has a 3% Inflation Target
  • Government Malpractice Breeds Health Care Havoc
  • A Tax On Imports Takes a Toll on Exports

Archives

  • December 2025
  • November 2025
  • October 2025
  • September 2025
  • August 2025
  • July 2025
  • June 2025
  • May 2025
  • April 2025
  • March 2025
  • February 2025
  • January 2025
  • December 2024
  • November 2024
  • October 2024
  • September 2024
  • August 2024
  • July 2024
  • June 2024
  • May 2024
  • April 2024
  • March 2024
  • February 2024
  • January 2024
  • December 2023
  • November 2023
  • August 2023
  • July 2023
  • June 2023
  • May 2023
  • April 2023
  • March 2023
  • February 2023
  • January 2023
  • December 2022
  • November 2022
  • October 2022
  • September 2022
  • August 2022
  • July 2022
  • June 2022
  • May 2022
  • April 2022
  • March 2022
  • February 2022
  • January 2022
  • December 2021
  • November 2021
  • October 2021
  • September 2021
  • August 2021
  • July 2021
  • June 2021
  • May 2021
  • April 2021
  • March 2021
  • February 2021
  • January 2021
  • December 2020
  • November 2020
  • October 2020
  • September 2020
  • August 2020
  • July 2020
  • June 2020
  • May 2020
  • April 2020
  • March 2020
  • February 2020
  • January 2020
  • December 2019
  • November 2019
  • October 2019
  • September 2019
  • August 2019
  • July 2019
  • June 2019
  • May 2019
  • April 2019
  • March 2019
  • February 2019
  • January 2019
  • December 2018
  • November 2018
  • October 2018
  • September 2018
  • August 2018
  • July 2018
  • June 2018
  • May 2018
  • April 2018
  • March 2018
  • February 2018
  • January 2018
  • December 2017
  • November 2017
  • October 2017
  • September 2017
  • August 2017
  • July 2017
  • June 2017
  • May 2017
  • April 2017
  • March 2017
  • February 2017
  • January 2017
  • December 2016
  • November 2016
  • October 2016
  • September 2016
  • August 2016
  • July 2016
  • June 2016
  • May 2016
  • April 2016
  • March 2016
  • February 2016
  • January 2016
  • December 2015
  • November 2015
  • October 2015
  • September 2015
  • August 2015
  • July 2015
  • June 2015
  • May 2015
  • April 2015
  • March 2015
  • February 2015
  • January 2015
  • December 2014
  • November 2014
  • October 2014
  • September 2014
  • August 2014
  • July 2014
  • June 2014
  • May 2014
  • April 2014
  • March 2014

Blogs I Follow

  • Passive Income Kickstart
  • OnlyFinance.net
  • TLC Cholesterol
  • Nintil
  • kendunning.net
  • DCWhispers.com
  • Hoong-Wai in the UK
  • Marginal REVOLUTION
  • Stlouis
  • Watts Up With That?
  • Aussie Nationalist Blog
  • American Elephants
  • The View from Alexandria
  • The Gymnasium
  • A Force for Good
  • Notes On Liberty
  • troymo
  • SUNDAY BLOG Stephanie Sievers
  • Miss Lou Acquiring Lore
  • Your Well Wisher Program
  • Objectivism In Depth
  • RobotEnomics
  • Orderstatistic
  • Paradigm Library
  • Scattered Showers and Quicksand

Blog at WordPress.com.

Passive Income Kickstart

OnlyFinance.net

TLC Cholesterol

Nintil

To estimate, compare, distinguish, discuss, and trace to its principal sources everything

kendunning.net

The Future is Ours to Create

DCWhispers.com

Hoong-Wai in the UK

A Commonwealth immigrant's perspective on the UK's public arena.

Marginal REVOLUTION

Small Steps Toward A Much Better World

Stlouis

Watts Up With That?

The world's most viewed site on global warming and climate change

Aussie Nationalist Blog

Commentary from a Paleoconservative and Nationalist perspective

American Elephants

Defending Life, Liberty and the Pursuit of Happiness

The View from Alexandria

In advanced civilizations the period loosely called Alexandrian is usually associated with flexible morals, perfunctory religion, populist standards and cosmopolitan tastes, feminism, exotic cults, and the rapid turnover of high and low fads---in short, a falling away (which is all that decadence means) from the strictness of traditional rules, embodied in character and inforced from within. -- Jacques Barzun

The Gymnasium

A place for reason, politics, economics, and faith steeped in the classical liberal tradition

A Force for Good

How economics, morality, and markets combine

Notes On Liberty

Spontaneous thoughts on a humble creed

troymo

SUNDAY BLOG Stephanie Sievers

Escaping the everyday life with photographs from my travels

Miss Lou Acquiring Lore

Gallery of Life...

Your Well Wisher Program

Attempt to solve commonly known problems…

Objectivism In Depth

Exploring Ayn Rand's revolutionary philosophy.

RobotEnomics

(A)n (I)ntelligent Future

Orderstatistic

Economics, chess and anything else on my mind.

Paradigm Library

OODA Looping

Scattered Showers and Quicksand

Musings on science, investing, finance, economics, politics, and probably fly fishing.

  • Subscribe Subscribed
    • Sacred Cow Chips
    • Join 128 other subscribers
    • Already have a WordPress.com account? Log in now.
    • Sacred Cow Chips
    • Subscribe Subscribed
    • Sign up
    • Log in
    • Report this content
    • View site in Reader
    • Manage subscriptions
    • Collapse this bar
 

Loading Comments...