
Tags
Andrew Cuomo, Anthony Fauci, Apple Mobility, Bill De Blasio, Centre for Economic Policy Research, Donald Trump, Externalities, Forbes, Foursquare, Heterogeneity, John Koetsier, Laissez Faire, Lockdowns, Nancy Pelosi, Points of Interest, Private Governance, Safegraph, Social Distancing, Social Welfare, Stay-at-Home Orders, Vitamin D, Wal Mart, WHO
My original post on the dominance of voluntary social distancing over the mandated variety appears below. That dominance is qualified by the greater difficulty of engaging in certain activities when they are outlawed by government, or when the natural locations of activities are declared off-limits. Nevertheless, as with almost all regulation, people make certain “adjustments” to suit themselves (sometimes involving kickbacks to authorities, because regulation does nothing so well as creating opportunities for graft). Those “adjustments” often lead to much less desirable outcomes than the original, unregulated state. In the case of a pandemic, however, it’s tempting to view such unavoidable actions as a matter of compromise.
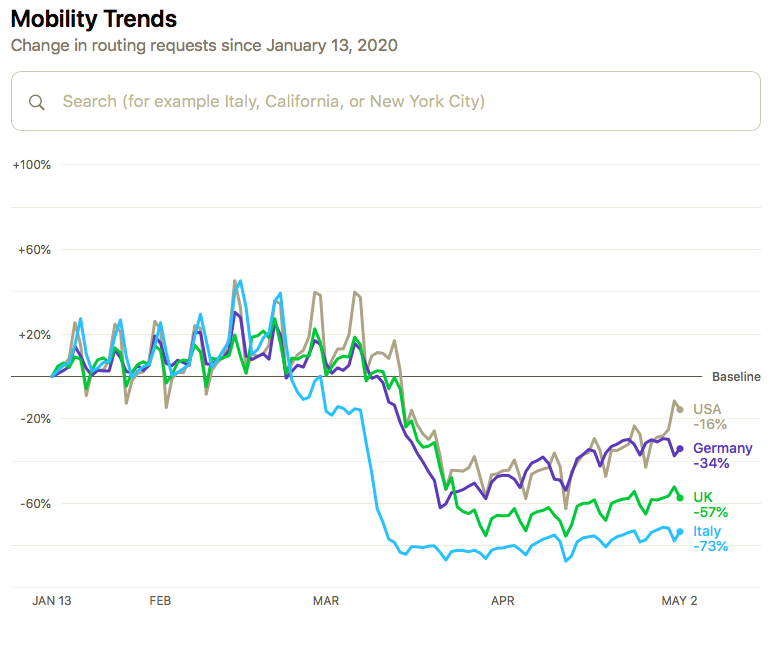
I say this now because the voluntary social distancing preceding most government lockdown orders in March (discussed in the post below) is subject to a degree of self-reversal. Apple Mobility Data suggests that something like that was happening throughout much of April, as shown in the chart at the top of this post. Now, in early May, the trend is likely to continue as some of the government lockdown mandates are being lifted, or at least loosened.
An earlier version of the chart above appeared in a Forbes article entitled, “Apple Data Shows Shelter-In-Place Is Ending, Whether Governments Want It To Or Not“. The author, John Koetsier, noted the Apple data are taken from map searches, so they may not be reliable indicators of actual movement. But he also featured some charts from Foursquare, which showed actual visits to various kinds of destinations, and some of theoe demonstrate the upward trend in activity.
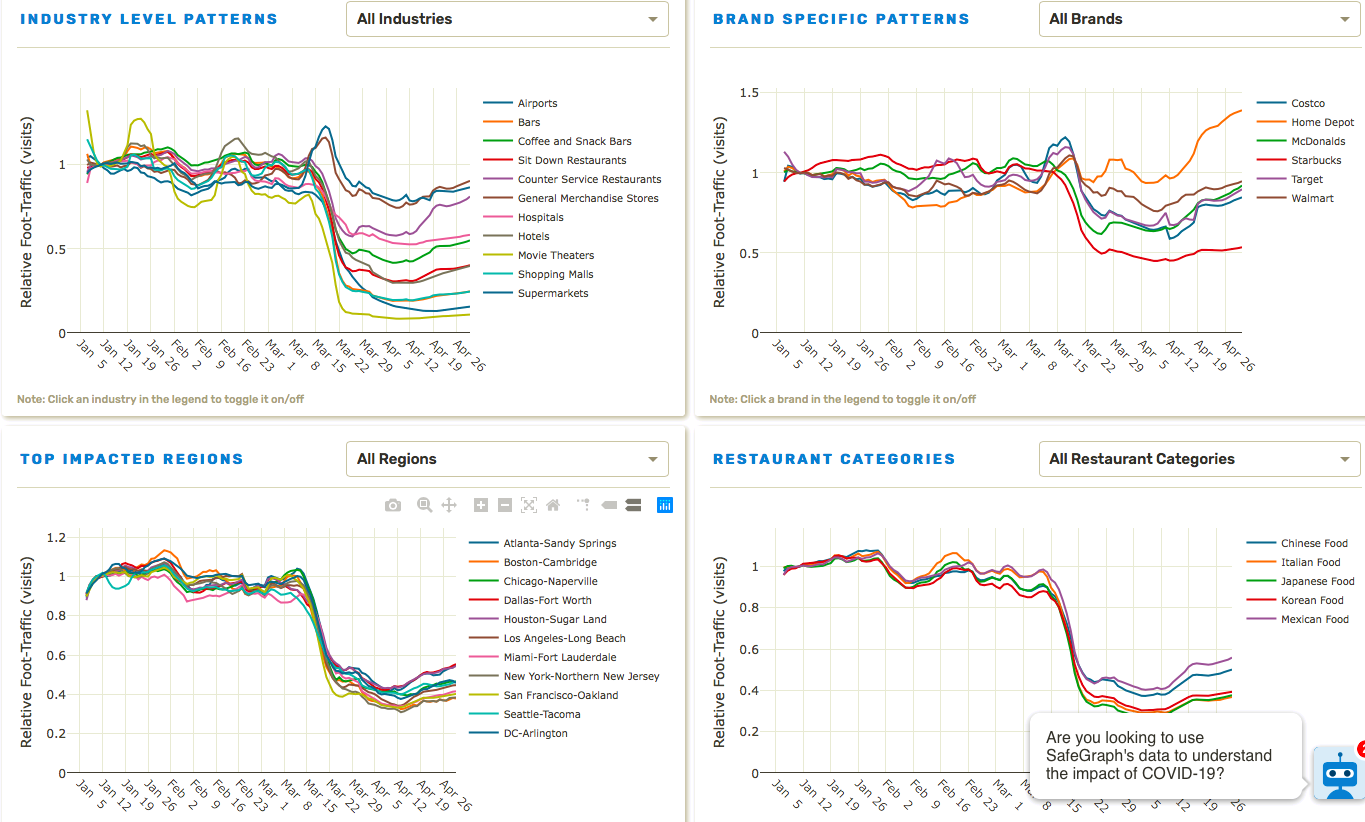
In the original post below, I used SafeGraph charts lifted from a paper I described there. The four charts below are available on the SafeGraph website, which offered the services of the friendly little robot in the lower right-hand corner, but I demurred. You’ll probably need to click on the image to read the detail. They show more granular information by industry, brand, region, and restaurant categories. The upward trends are evident in quite a few of the series.
I should qualify my interpretation of the charts above and those in my original post: First, nine states did not have stay-at-home orders, though a few of those had varying restrictions on individuals and on the operation of “non-essential” businesses. The five having no orders of any kind (that I can tell) are lightly-populated, very low-density states, so the vast majority of the U.S. population was subject to some sort of lockdown measure. Second, eight states began to ease or lift orders in the last few days of April, Georgia and Colorado being the largest. Therefore, at the tail end, a small part of the increase in activity could be related to those liberalizations. Then again, it might have happened anyway.
The authoritarian impulse to shut everything down was largely unnecessary, and it did not accomplish much that voluntary distancing hadn’t accomplished already (again, see below). Healthy people need to stop cowering and take action. That includes the non-elderly and those free of underlying health conditions. Sure, take precautions, keep your distance, but get out of your home if you can. Get some sunny Vitamin D.
Committing yourself to the existence of a shut-in is not healthy, not wise, and it might destroy whatever wealth you possess if you are a working person. The data above show that people are recognizing that fact. As much as the Left wishes it were so, government seldom “knows better”. It is least effective when it uses force to suppress voluntary behavior; it is most effective when it follows consensus, and especially when it protects the rights of individuals to make their own choices where no consensus exists.
Last week’s post follows:
~~~~~~~~~~~~~~~~~~~~~~~~~~~~~~~
How much did state and local governments accomplish when they decided to issue stay-at-home orders? Perhaps not much. That’s the implication of data presented by the authors of “Internal and external effects of social distancing in a pandemic” (starts on page 22 in the linked PDF). Social distancing began in the U.S. in a series of voluntary, private actions. Government orders merely followed and, at best, reinforced those actions, but often in ham-handed ways.
The paper has a broader purpose than the finding that social distancing is often a matter of private initiative. I’ll say a bit more about it, but you can probably skip the rest of this paragraph without loss of continuity. The paper explores theoretical relationships between key parameters (including a social distancing construct) and the dynamics of a pandemic over time in a social welfare context. The authors study several alternatives: a baseline in which behavior doesn’t change in any way; a “laissez faire” path in which actions are all voluntary; and a “socially optimal” path imposed by a benevolent and all-knowing central authority (say what???). I’d offer more details, but I’ll await the coming extension promised by the authors to a world in which susceptible populations are heterogenous (e.g., like Covid-19, where children are virtually unaffected, healthy working age adults are roughly as at-risk as they are to the flu, and a population of the elderly and health-compromised individuals for which the virus is much more dangerous than the flu). In general, the paper seems to support a more liberalized approach to dealing with the pandemic, but that’s a matter of interpretation. Tyler Cowen, who deserves a hat-tip, believes that reading is correct “at the margin”.
Let’s look at some of the charts the authors present early in the paper. The data on social distancing behavior comes from Safegraph, a vendor of mobility data taken from cell phone location information. This data can be used to construct various proxies for aggregate social activity. The first chart below shows traffic at “points of interest” (POI) in the U.S. from March 8 to April 12, 2020. That’s the blue line. The red line is the percentage of the U.S. population subject to lockdown orders on each date. The authors explain the details in the notes below the chart:
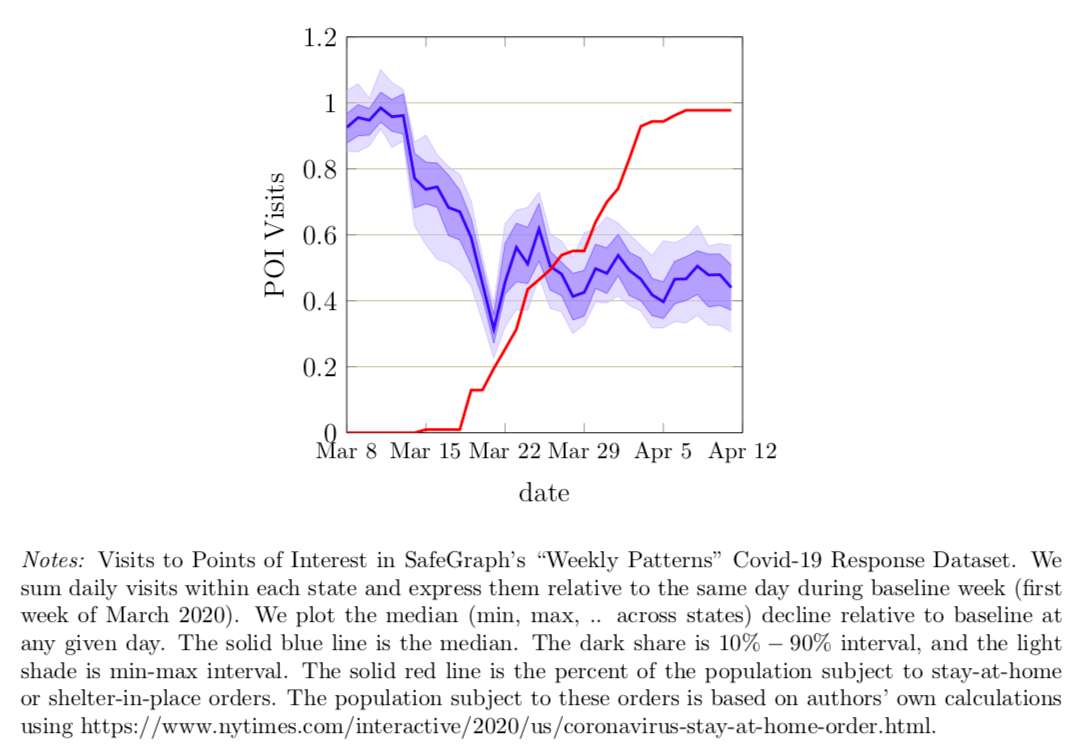
Clearly POI visits were declining sharply before any governments imposed their own orders. The next two charts show similar declines in the percent of mobile devices that leave “home” each day (“home” being the device’s dominant location during nighttime hours) and the duration over which devices were away from “home”, on average.
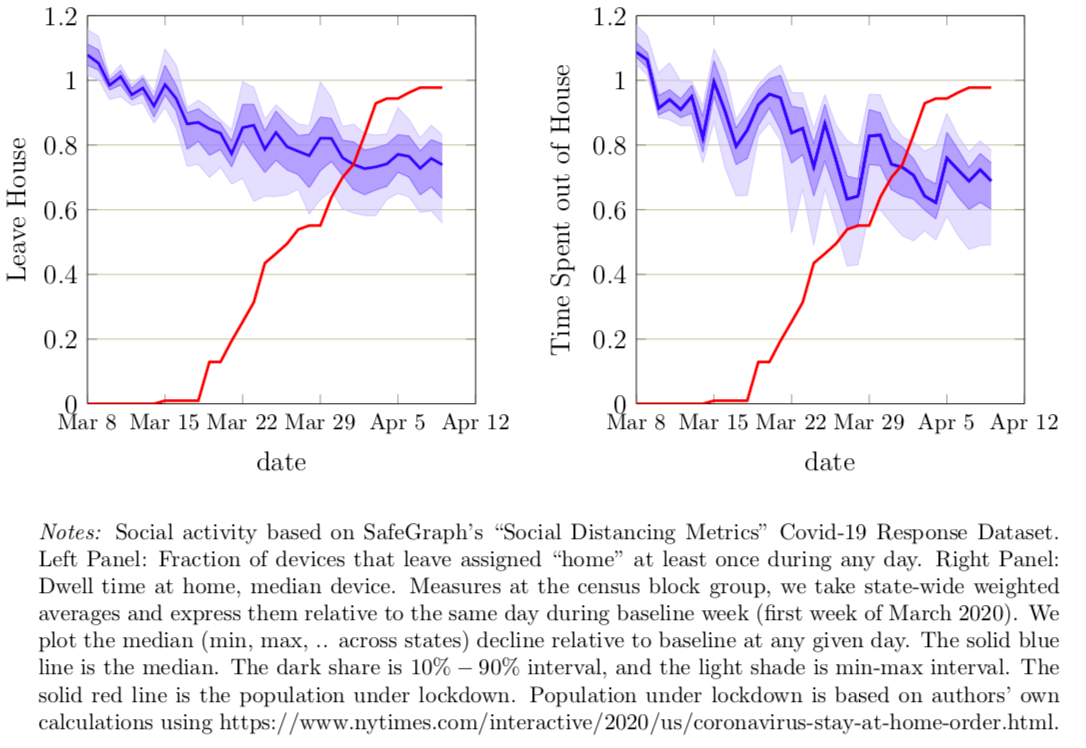
So all of these measures of social activity began declining well ahead of the government orders. The authors say private social distancing preceded government action in all 50 states. POI traffic was down almost 40% by the time 10% of the U.S. population was subject to government orders, and those early declines accounted for the bulk of the total decline through April 12. The early drops in the two away-from-home measures were 15-20%, again accounting for well over half of the total decline.
The additional declines beyond that time, to the extent they can be discerned, could be either trends that would have continued even in the absence of government orders or reinforcing effects the orders themselves. This does not imply that lockdown orders have no effects on specific activities. Rather, it means that those orders have minor incremental effects on measures of aggregate social activity than the voluntary actions already taken. In other words, the government lockdowns are largely a matter of rearranging the deck chairs, or, that is to say, their distribution.
Many private individuals and institutions acted early in response to information about the virus, motivated by concerns about their own safety and the safety of family and friends. The public sector in the U.S. was not especially effective in providing information, with such politicos as President Donald Trump, Nancy Pelosi, Andrew Cuomo, Bill De Blasio, and the mayor of New Orleans minimizing the dangers into the month of March, and some among them encouraging people to get out and celebrate at public events. Even Anthony Fauci minimized the danger in late February (not to mention the World Health Organization). In fact, “the scientists” were as negligent in their guidance as anyone in the early stages of the pandemic.
When lockdown orders were issued, they were often arbitrary and nonsensical. Grocery stores, liquor stores, and Wal Mart were allowed to remain open, but department stores and gun shops were not. Beaches and parks were ordered closed, though there is little if any chance of infection outdoors. Lawn care services, another outdoor activity, were classified as non-essential in some jurisdictions and therefore prohibited. And certain personal services seem to be available to public officials, but not to private citizens. The lists of things one can and can’t buy truly defies logic.
In March, John W. Whitehead wrote:
“We’re talking about lockdown powers (at both the federal and state level): the ability to suspend the Constitution, indefinitely detain American citizens, bypass the courts, quarantine whole communities or segments of the population, override the First Amendment by outlawing religious gatherings and assemblies of more than a few people, shut down entire industries and manipulate the economy, muzzle dissidents, ‘stop and seize any plane, train or automobile to stymie the spread of contagious disease,’…”
That is fearsome indeed, and individuals can accomplish distancing without it. If you are extremely risk averse, you can distance yourself or take other precautions to remain protected. You can either take action to isolate yourself or you can decide to be in proximity to others. The more risk averse among us will internalize most of the cost of voluntary social distancing. The less risk averse will avoid that cost but face greater exposure to the virus. Of course, this raises questions of public support for vulnerable segments of the population for whom risk aversion will be quite rational. That would certainly be a more enlightened form of intervention than lockdowns, though support should be offered only to those highly at-risk individuals who can’t support themselves.
Christopher Phelan writes of three rationales for the lockdowns: buying time for development of a vaccine or treatments; reducing the number of infected individuals; and to avoid overwhelming the health care system. Phelan thinks all three are of questionable validity at this point. A vaccine might never arrive, and Phelan is pessimistic about treatments (I have more hope in that regard). Ultimately a large share of the population will be infected, lockdowns or not. And of course the health care system is not overwhelmed at this point. Yes, those caring for Covid patients are under a great stress, but the health care system as a whole, and patients with other maladies, are currently suffering from massive under-utilization.
If you wish to be socially distant, you are free to do so on your very own. Individuals are quite capable of voluntary risk mitigation without authoritarian fiat, as the charts above show. While private actors might not internalize all of the external costs of their activities, government is seldom capable of making the appropriate corrections. Coercion to enforce the kinds of crazy rules that have been imposed during this pandemic is the kind of abuse of power the nation’s founders intended to prevent. Reversing those orders can be difficult, and the precedent itself becomes a threat to future liberty. Nevertheless, we see mounting efforts to resist by those who are harmed by these orders, and by those who recognize the short-sighted nature of the orders. Private incentives for risk reduction, and private evaluation of the benefits of social and economic activity, offer superior governance to the draconian realities of lockdowns.


