Asymptomatic cases of coronavirus have some important implications, both good and bad. Of course, it’s great that so many people are asymptomatic. It demonstrates an innate immunity or some other kind of acquired immunity to the virus. On the other hand, these individuals can still spread the virus while infected, and they are hard to identify.
Estimates of the share of asymptomatic cases vary tremendously, some reaching almost 90%. But being asymptomatic is a matter of degree: in some cases there might be no symptoms whatsoever, from initial infection to complete suppression. In others, the symptoms are mild and may not raise any alarm in one’s mind. That distinction implies that testing criteria should be broadened, especially as the cost of testing declines.
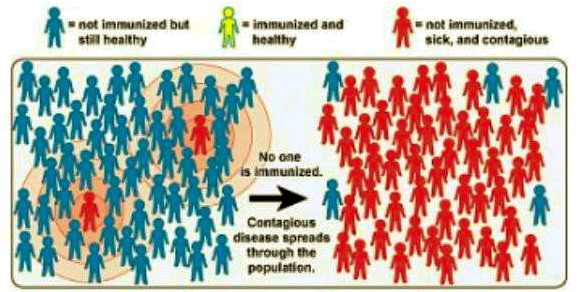
Here I show two simple examples of viral spread to demonstrate that some level of asymptomatic “pre-immunity” in the population reduces the threshold at which the impact of the virus reverses. Both examples involve a population of 100 people. In both cases, social interactions are such that an infected person infects an average of two others. That is, the initial reproduction rate (known as R0) is equal to two. In both examples, the process starts with one infected individual:
Example #1:
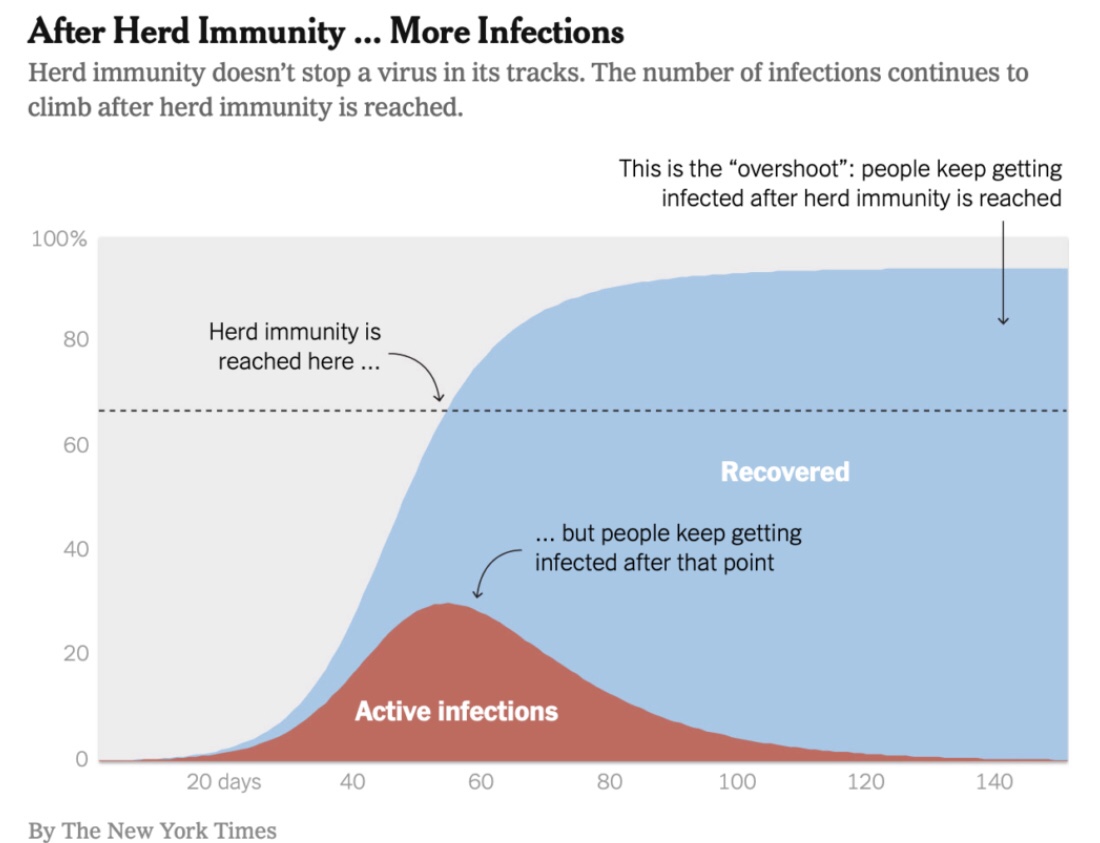
Everyone is susceptible, meaning that the virus will cause symptoms and illness in anyone who catches it. Condensing the timeline, let’s just say we go from the first infection to three infections; then #2 and #3 each infect two more, and we have a total of seven infections; then the extra four pass the virus along to another eight victims and we’re up to 15; and so on. This is the exponential growth that is characteristic of the early stage of an epidemic. But then other dynamics start to kick in: most of the infected people recover with adaptive immunity, though a few may die. By now, however, only 85 susceptible people remain in the population, so each infected person infects an average of less than two more. The reproduction rate R must fall from it’s initial value of R0 as the susceptible population shrinks. By the time 50 people are infected and 50 susceptible people remain, the value of R is halved. In this example, that’s where herd immunity is achieved: when 50% of the population has been infected.
For those who enjoy math, here is a useful relation:
Herd Immunity Threshold (HIT) = 1 – 1/R0.
The higher is R0, the initial reproduction rate, the more people must be infected to achieve herd immunity. The coronavirus is said to have an R0 somewhere in the mid-2s. If it’s 2.5, then 60% of the population must be infected to achieve herd immunity under the assumption of universal susceptibility. When 60% are infected, R is equal to one. More people will be infected beyond that time, but fewer and fewer. R continues to fall, and the contagion wanes.
While I’ve abstracted from the time dimension, the total number of people who will be infected depends on factors like the duration of an infection. It takes time for an infected individual to come into contact with new, susceptible hosts for the virus, and fewer hosts will be available as time passes. That means the virus will die out well before the full population has been infected.
Example #2:
Let’s say 40 of the 100 people are not susceptible to the virus, meaning they will experience few if any symptoms if they catch it. Those 40 are innately immune, or perhaps they retain some adaptive immunity from previous exposure to a non-novel coronavirus. Strictly speaking, the entire population can catch the virus and can transmit it to others, but only 60% the population is susceptible to illness. It’s still true that each infected person would infect two others at the start. However, only 1.2 of those newly infected people would get sick on average. I will call that value the effective R0, which is net of the immune cohort. By the time 17 people have been infected, and about 10 of them get sick, there are only 50 susceptible people remaining. The effective R is already down to one. Herd immunity is effectively achieved after less than 20 infections. The HIT is just 17% (rounded)! That means the number of symptomatic infections will begin declining beyond that point. In this case, again depending on the average duration of an infection, it’s likely that much less than half of the population is ultimately sickened by the virus.
To summarize thus far, what example #2 demonstrates is that the existence of prior immunity in some individuals reduces the effective HIT. We know that sub-groups have differing levels of prior immunity / susceptibility to the coronavirus. In fact, for the coronavirus, we know the non-susceptible share of the population is substantial, given the large number of individuals who have been exposed but were asymptomatic.
Other Impacts on Reproduction Rate
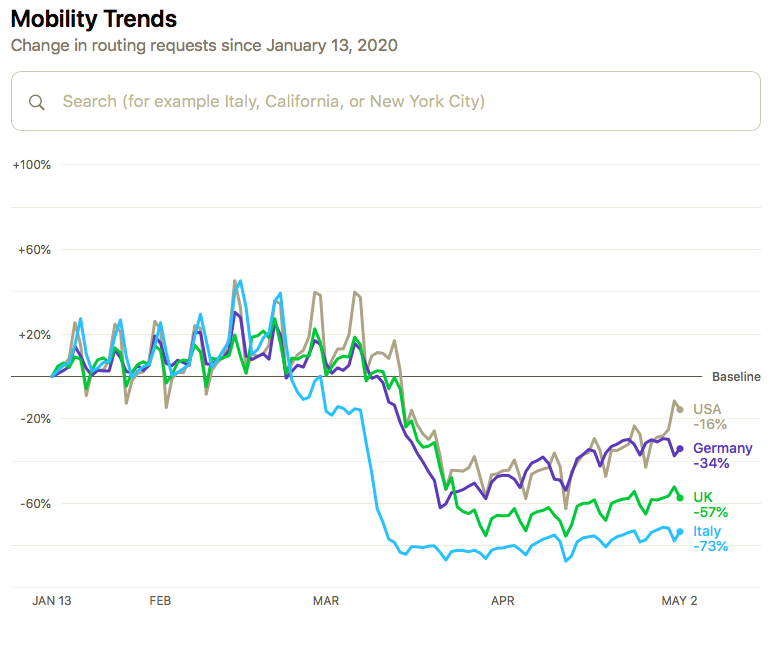
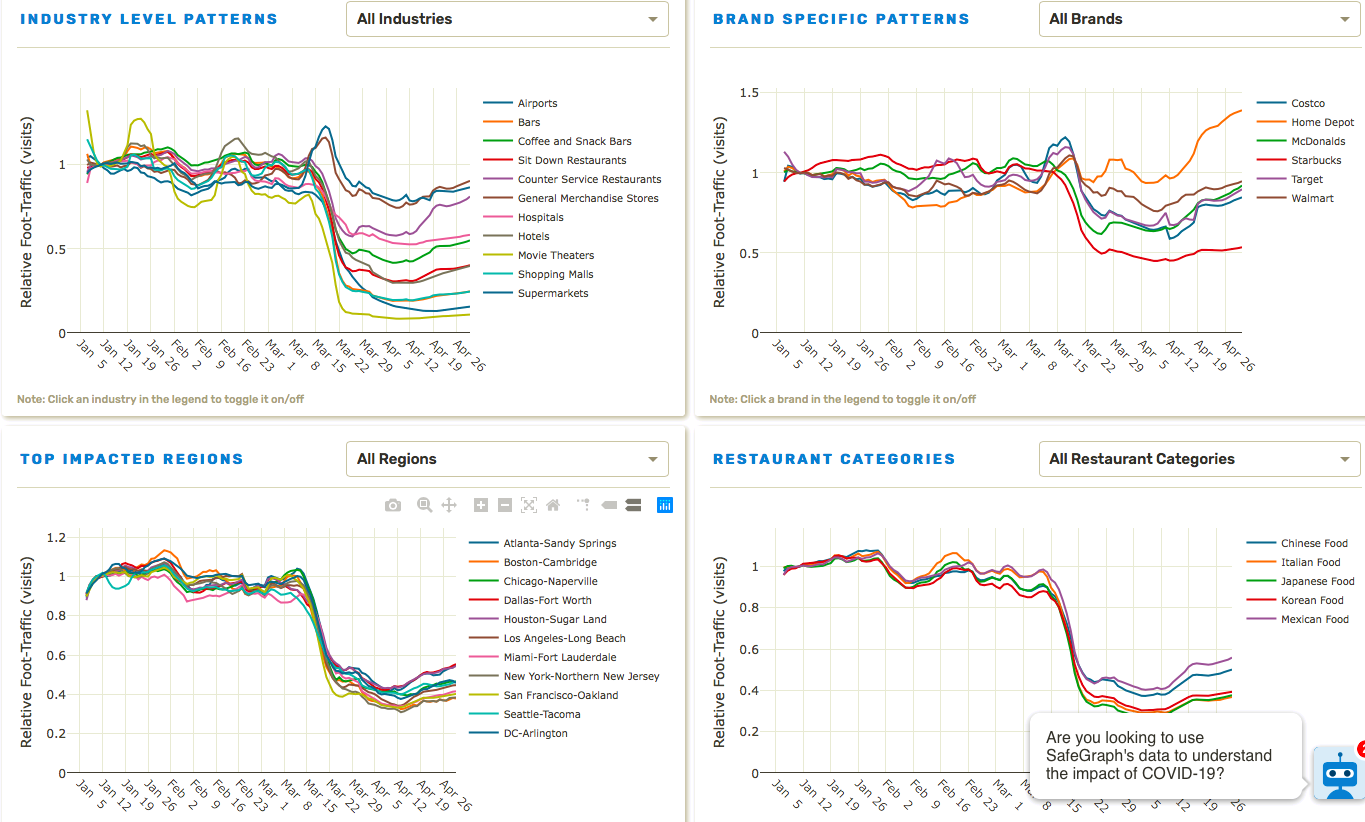
Other influences can inhibit the spread of a virus. Weather, for example (see the nice interactive tool in “Weather and Transmission Rates“). Social distancing, including avoidance of “super-spreader events“, reduces the average number of people anyone can come into contact with. Masks might reduce the spread to others as well. Quarantining infected individuals obviously eliminates contacts with other individuals. Quarantining susceptible individuals prevents them from being exposed. In all of these cases, R is reduced more drastically over time from it’s initial value R0. This reduces the effective HIT and the ultimate number of individuals infected. Those effects are incremental to the impact of a large, non-susceptible sub-group, as in example #2, And there are variations on the appeal to heterogeneity that are equally convincing, as described below.
New HIT Literature
So herd immunity is not as far out of reach as many believe. That question is now being addressed more intensively in the academic world. Herd immunity occurs in the context of a virus’s ability to spread from host to host, which is summarized by R. In my limited review, most of the articles addressing a lower HIT emphasize distancing or other practices that reduce R. However, herd immunity really means that given a set of social conditions, enough of the population has either an innate or an acquired immunity to cause the impact of a contagion to recede. Both the level of immunity and the social conditions can alter the effective HIT.
Jacob Sullum offers a nice summary of some of this work. One paper describing the impact of heterogeneity emphasizes the order in which individuals become infected. Here is Sullum’s description with a link to the paper:
“A couple of new reports speculatively lower the possible herd immunity threshold for the coronavirus to just 10 to 20 percent of the population. This conjecture depends chiefly on assumptions about just how susceptible and connected members of the herd are. In their preprint, a team of European epidemiologists led by the Liverpool School of Tropical Medicine mathematical bioscientist Gabriela Gomes explains how this might work.
If highly susceptible herd members become infected and thus immune first, the preprint says, their subsequent interactions with the still-uninfected will not result in additional cases. Basically, the virus stymies itself by disproportionately removing those most useful to it from contributing to its future transmission. In addition, if herd members are very loosely connected and interact with one another rarely, the virus will have a much harder time jumping to its next victims. Sustained social distancing aimed at flattening the curve of coronavirus infections and cases mimics this effect.”
The sequential explanation is of obvious importance, But don’t it’s not the fundamental mechanism at play in example #2, which is strictly the heterogeneity of the population.
Nick Spyropoulas of the Alma Economics Group describes reductions in the herd immunity threshold in “Notes on the Dynamics of Subsequent Epidemic Waves“. It’s a very nice write-up, but it only emphasizes social distancing.
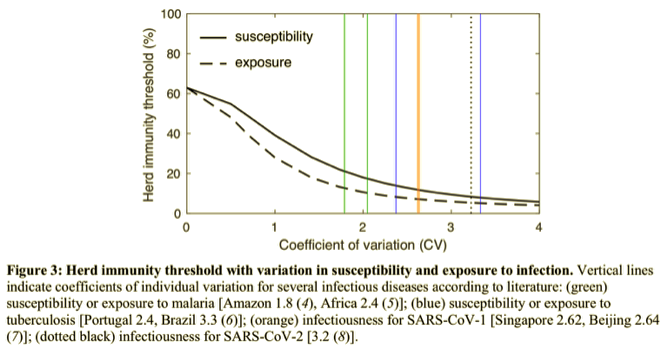
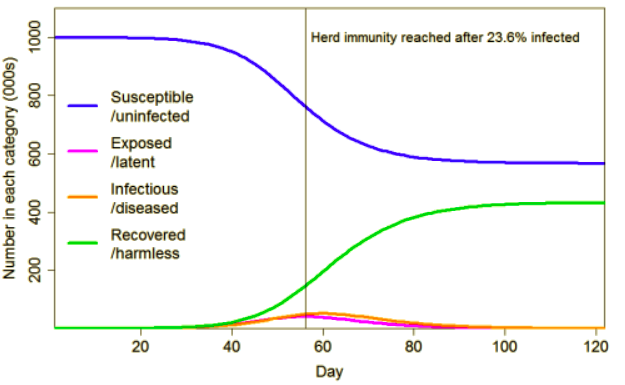
Judith Curry provides an excellent and well-referenced exposition of some herd immunity experiments. They are based on an even more extended approach to heterogeneity introducing: 1) variation in susceptibility across individuals; and 2) variation in the dispersion of transmission. The latter means, “… the extent to which infection happens through many spreaders or just a few“. She uses these mechanisms to modify a standard epidemiological model using prior estimates of variability to calibrate the model. Both experiments arrive at drastically lower HITs and total infections than her baseline experiment, which uses the standard model. The chart below shows her results with moderate heterogeneity. Her results with more extreme (though realistic) values of the heterogeneity metrics are even more remarkable. See the link above.
Check Against Real World
How does all this square with our experience to-date with the coronavirus? It’s difficult to tell with case counts, as the volume of testing keeps increasing and so many infected individuals are asymptomatic and remain undiagnosed. Estimates of R vary, but most states appear to have an R currently less than one. That means the virus is receding almost everywhere in the U.S. The same is true in much of the developed world, where the virus was most prevalent. Even Sweden, where achieving herd immunity is policy, diagnosed cases and deaths have been largely confined to vulnerable groups, and in total are less than many other (though not all) European countries.
Does that mean many areas in the U.S. and elsewhere have reached herd immunity? Locales that have had serological testing have thus far shown infection rates of anywhere from 2% to 10%, though New York City, where the outbreak was most severe, may have had more than 20% of its population infected as of a month ago. Different regions may have different HITs, so there is a chance that some areas, including NYC, are close to herd immunity.
Unfortunately, some of the reductions in R and in the effective HIT were won by social distancing, which will be reversed to some extent as the economy reopens. That’s the flip side of the “flat curve” we’ve managed to experience. The value of R may drift back toward or above one for a time. Diminished sunlight and humidity in the fall might have a similar effect. A second wave is not likely to be as bad as the first, however. That’s because: 1) we’ll now have more adaptive immunity in the population; 2) the most susceptible people are among those who already have acquired immunity or, more sadly, have died; 3) we’ll be better at coping with an outbreak in multiple ways; and 4) more speculatively, we’ll have identified the most effective treatments and, with less likelihood, a vaccine for those who want it.
Policy Lessons
In any outbreak, keeping R below one at least-cost is the objective. Given the alternatives, that rules out full-scale lockdowns because we know a large share of the population already has innate or acquired immunity. Forced shutdowns are unnecessarily costly relative to a targeted approach. But what form does that take?
Infected individuals must be quarantined until they recover, and their close contacts should be quarantined for up to a full incubation period. Large gatherings must be suspended temporarily. Testing capacity must be such that anyone with a fever or any symptom, mild or otherwise, can be tested. Regular testing of certain individuals like health care workers, teachers, and other first responders should take place. Simple screenings using infrared thermometers will be useful in high-traffic establishments. Precautions must be targeted at the most susceptible, and it’s pretty easy to identify them: the elderly and those with co-morbidities such as heart disease, diabetes, and lung conditions.
There are questions of civil liberties that must be addressed as well. Many high-risk individuals can live independently, so their freedoms must be weighed against their safety. Keeping this cohort quarantined is out of the question unless it’s voluntary. Regular testing should take place, and a subset of this group might already have the markers of immunity. Another question of civil liberties involves detailed contact tracing, which requires the establishment of an apparatus capable of great intrusion and abuse. I believe identification of close contacts should be an adequate precaution, though there may be degrees of tracing that I would find acceptable. Finally, a vaccine would be welcome, but it should not be mandatory