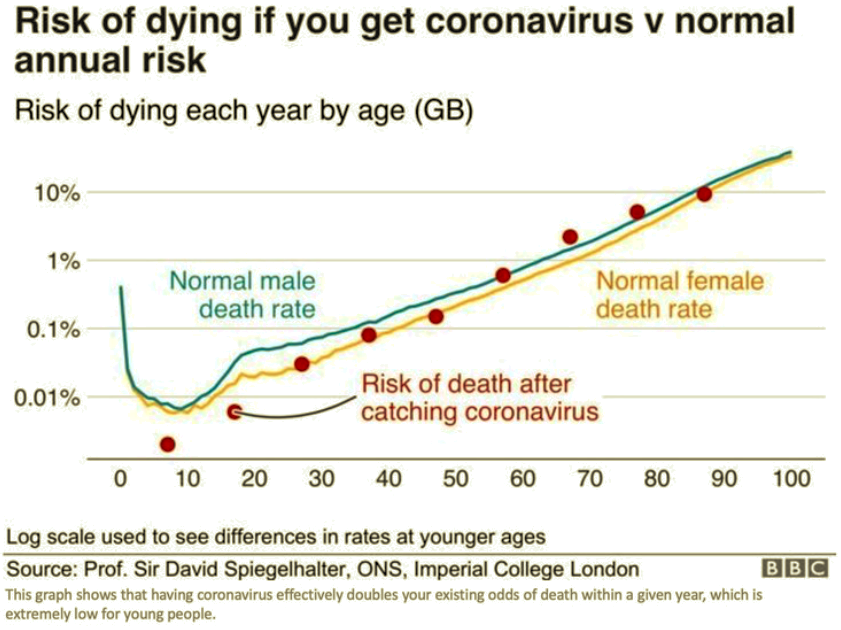
I visited my doctor last Wednesday. He’s a specialist but also serves as my primary care physician, and we share the same condition. He’s affiliated with a prestigious medical school and practices on the campus of a large research hospital. First thing, I asked him, “So what do you think of all this?” Without hesitation, he said he believes we’re witnessing the single greatest over-reaction in all of medical history. He elaborated at length, which I very much appreciated, and I was gratified that much of what he said was familiar to me and my readers. The risks of the coronavirus are highly concentrated among the elderly and the already-sick, and the damage that the panic and lockdowns have done to the delivery of other medical care is probably a bigger tragedy, to say nothing of the economic damage. Furthermore, the Covid-19 pandemic is certainly not more threatening than others the world has experienced since WW II.
But did we know all that in March? No one with any sense believed the low numbers coming out of China; major flip-flops and mistakes by public health officials in the U.S. did much to confuse matters and delay evaluation of the outbreak. Nevertheless, there were reasons to proceed more deliberately. The explosion of cases in Italy and elsewhere consistently indicated that risk was concentrated among the elderly, so a targeted approach to protecting the vulnerable would have made sense. Still, individuals took voluntary action to social distance even before governments initiated broad lockdowns.
The lockdowns, of course, were sold as a short-term effort to “flatten the curve” so that medical resources would not be overwhelmed. There was, no doubt, great stress on front-line health care workers in March and April, and there were short-term shortages of personal protective equipment as well as ventilators for the most severe cases (but it’s possible ventilators actually harmed some patients). But whether you credit government action, private action, or the fact that so much of the population was not susceptible to begin with, mission accomplished! The strains were concentrated in certain geographic regions, especially the New York City metro area, but even there, the virus is on the wane. There is always the possibility of a major second wave, but perhaps it can be handled more intelligently by the public and especially public servants.
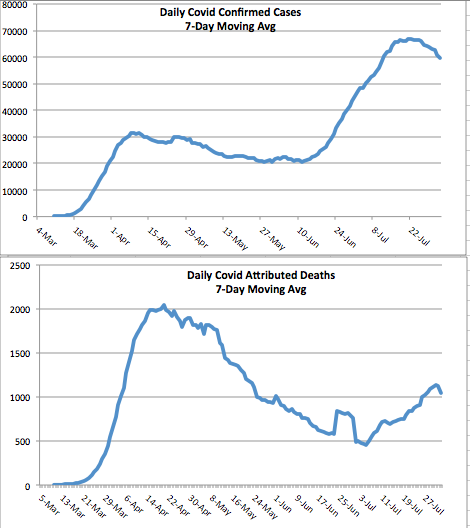
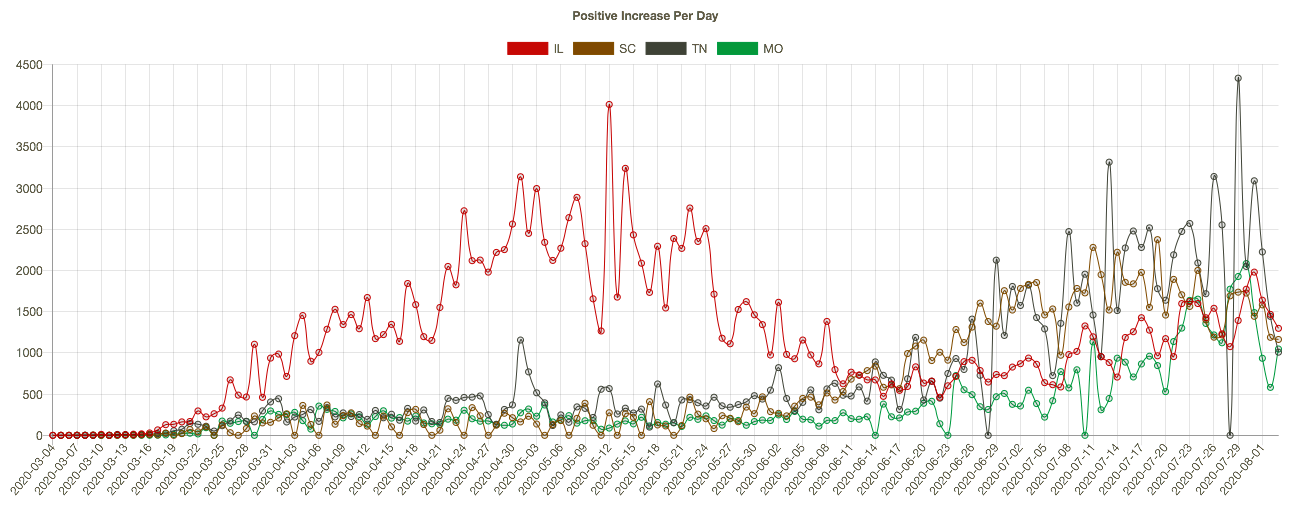
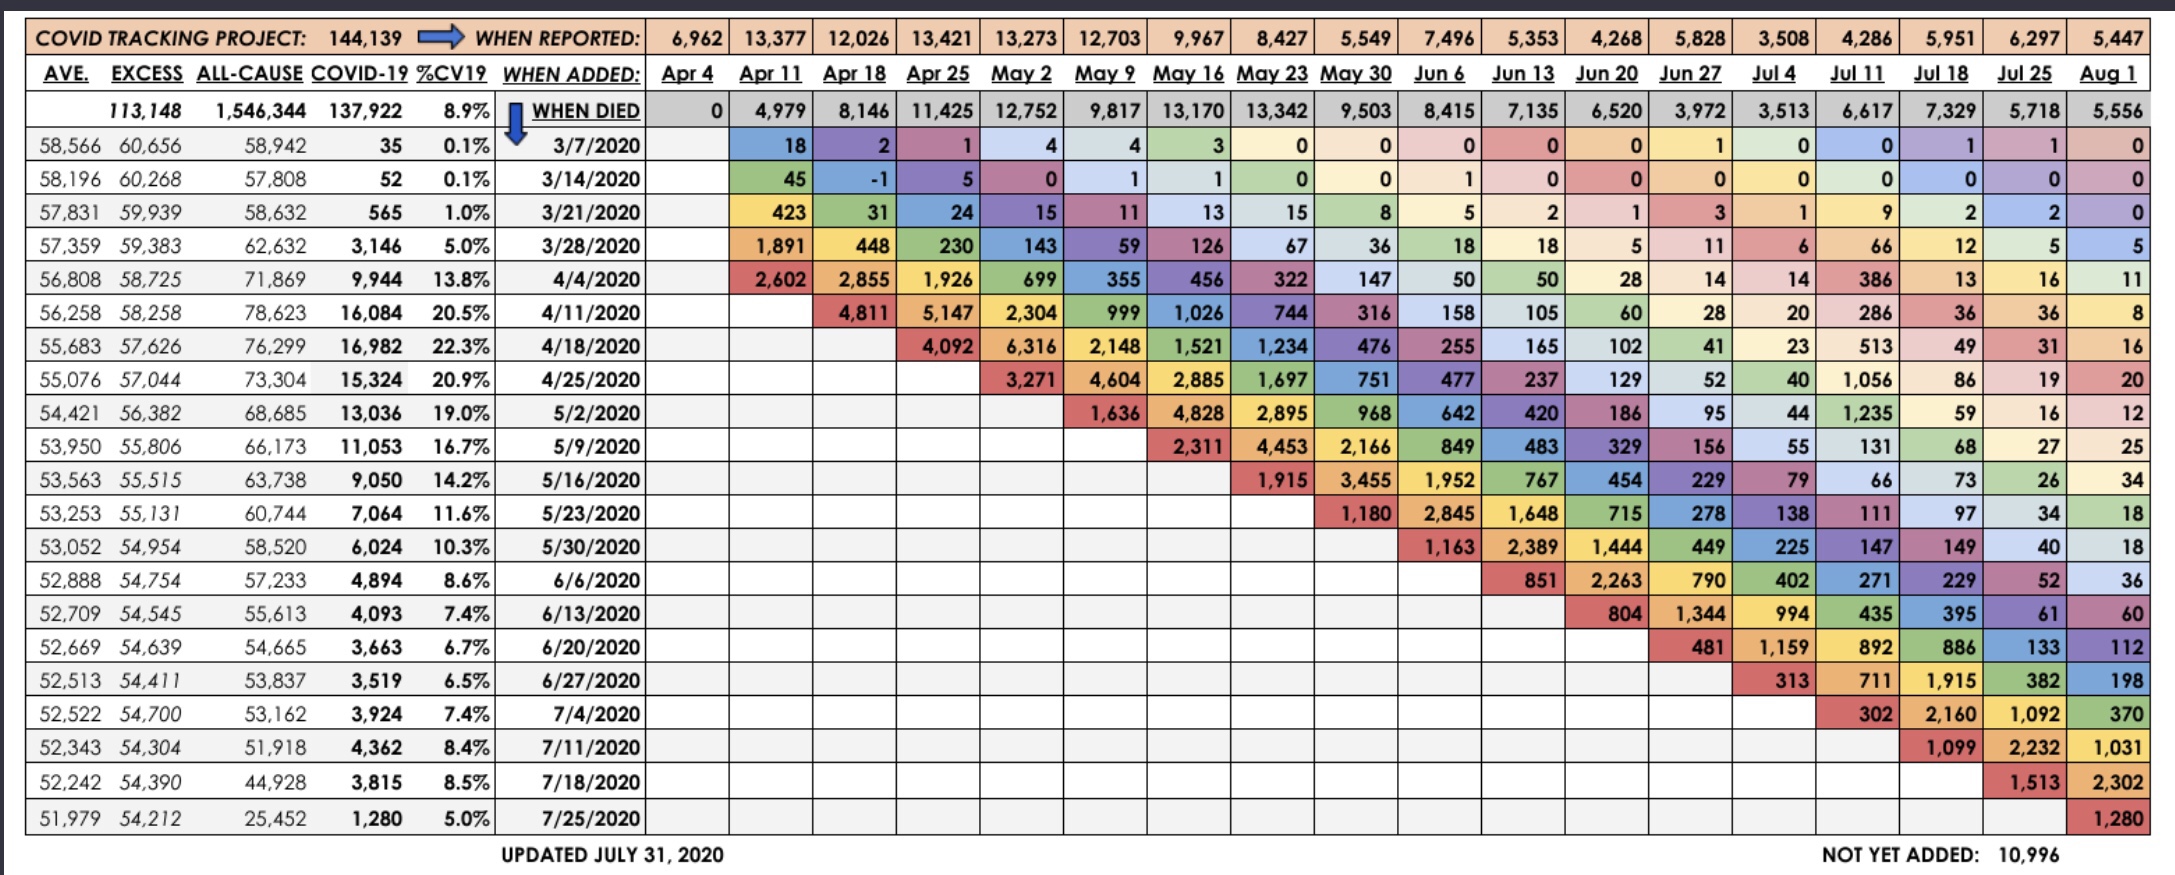
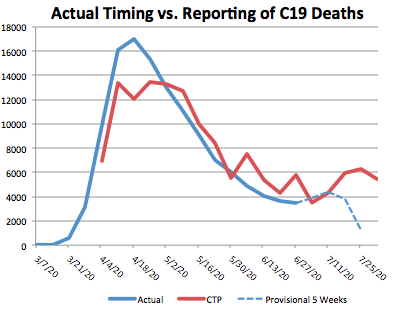
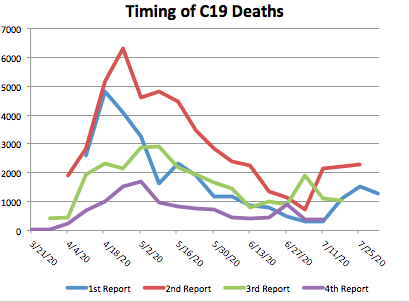
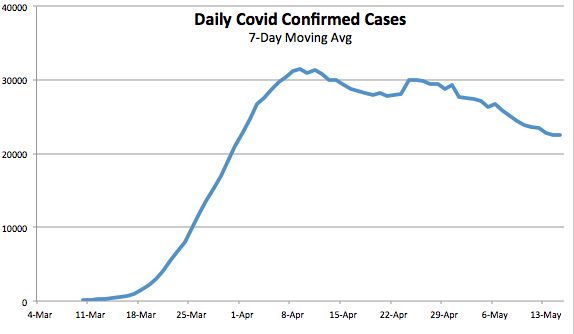
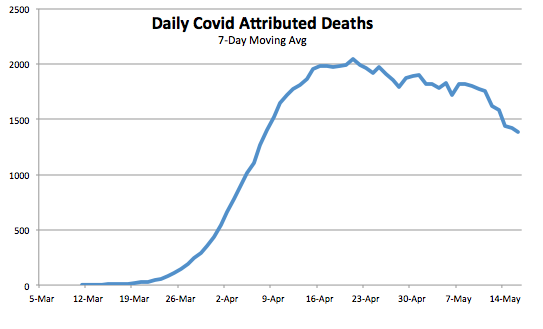
And now for some charts. Due to day-to-day volatility, and because the data on case numbers and deaths fluctuate on a weekly frequency, the charts below are on a 7-day moving average basis. It’s clear that the peak in U.S. daily confirmed cases was over five weeks ago, while the peak in Covid-attributed deaths was about three weeks ago.
Unfortunately, there is more doubt than ever about the legitimacy of the numbers. New York keeps “discovering” new deaths in nursing homes, a situation aggravated by a statewide order in March prohibiting homes from rejecting new or returning patients with active infections. There are reports from across the country of family deaths that were imminent, yet officially attributed to Covid. In one case, a death from severe alcohol poisoning was attributed to Covid. Colorado announced today that it was revising its death toll downward by about 24%.
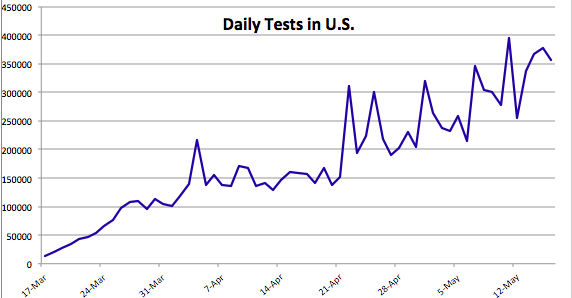
The data on confirmed cases are elevated because testing keeps expanding. The first chart below shows that the number of daily tests has more than doubled over the past 3½ weeks. At the same time, the second chart below shows that the rate of “positives” has declined steadily for over six weeks. That is likely due to a combination of expanded testing for screening purposes, as opposed to testing mainly individuals presenting symptoms, and fewer individuals presenting symptoms each day.
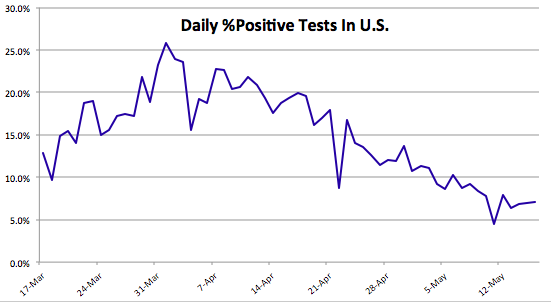
As Nate Silver said on Saturday:
“There are still *way* too many stories about big spikes in cases when the cause of those spikes was a big increase in tests. And remember, it’s a good thing when states start doing more tests!”
One commenter on Silver’s thread pointed out that more testing is likely to lead to more confirmed cases even if the true number of infections is declining.
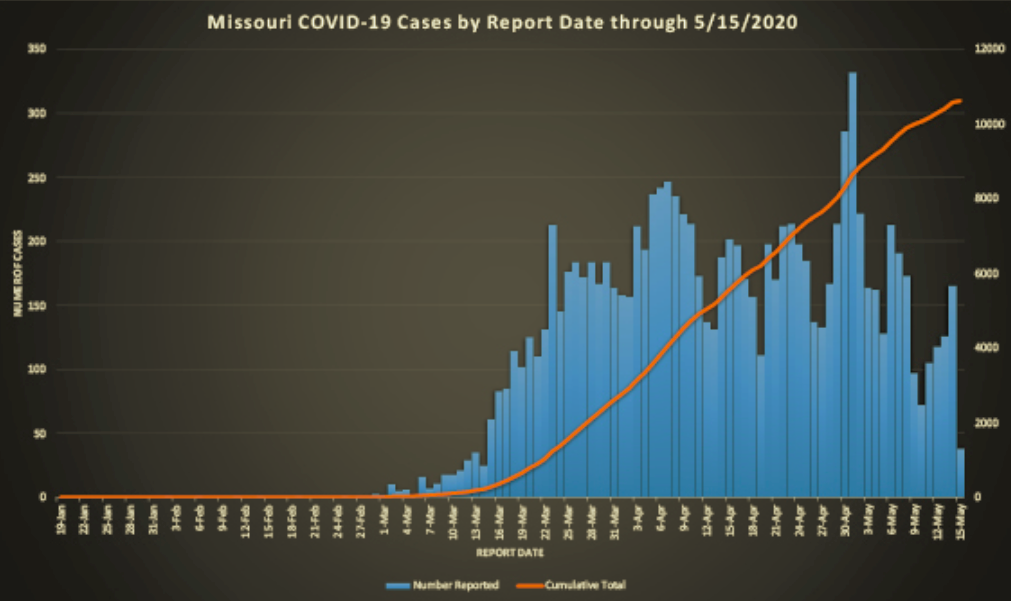
I’ll highlight just a few individual states. Missouri’s peak in cases appears to have occurred several weeks ago, though a spike at the end of April interrupted the trend. The spike was partly attributable to a flare-up at a single meat-packing plant (facilities that are particularly conducive to viral spread due to close conditions and aerosols).
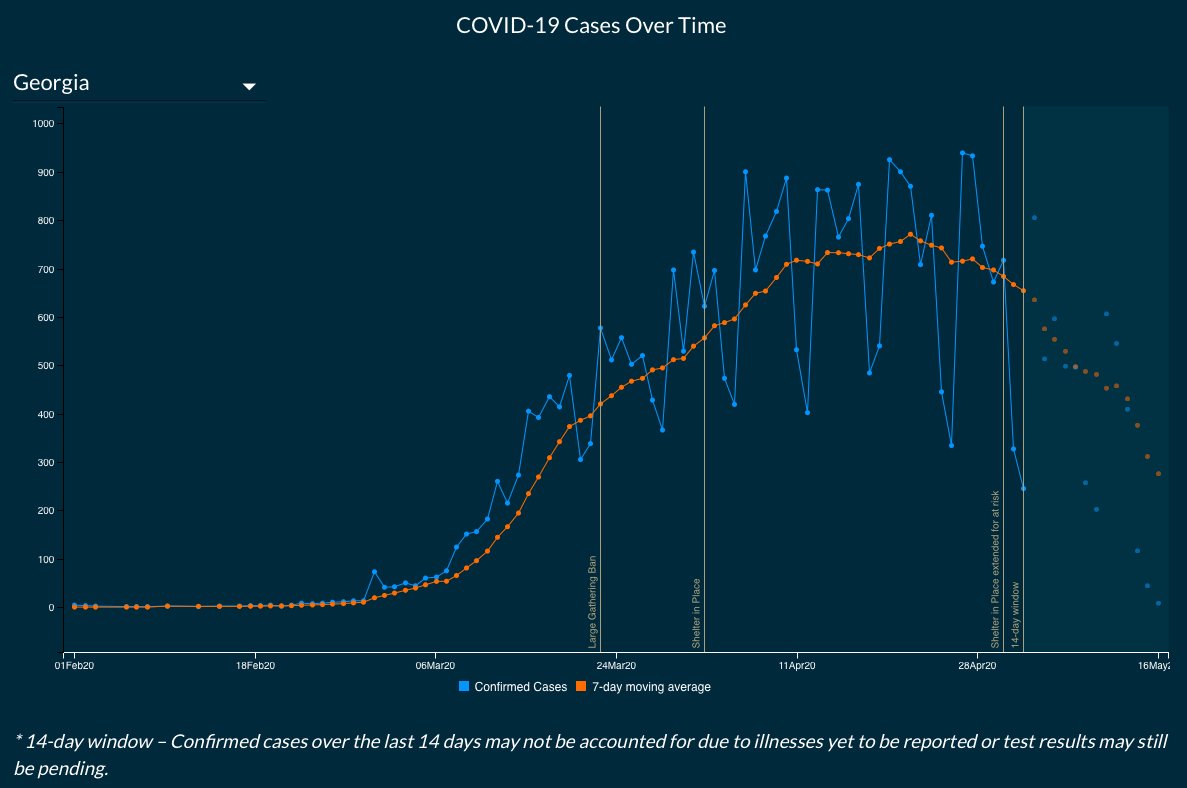
Here is Georgia, which began to reopen its economy on April 24. The pro-lockdown crowd confidently predicted the reopening would lead to a spike in cases within two weeks. Georgia is conservative in its reporting, so they don’t extend the lines in the chart beyond 14 days of the most recent reports due to potential revisions. Nevertheless, it’s clear that the trend in cases is downward.
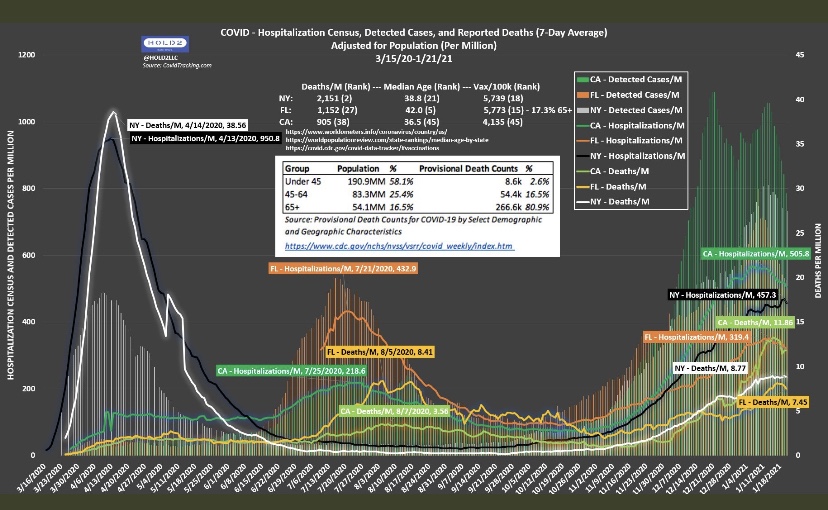
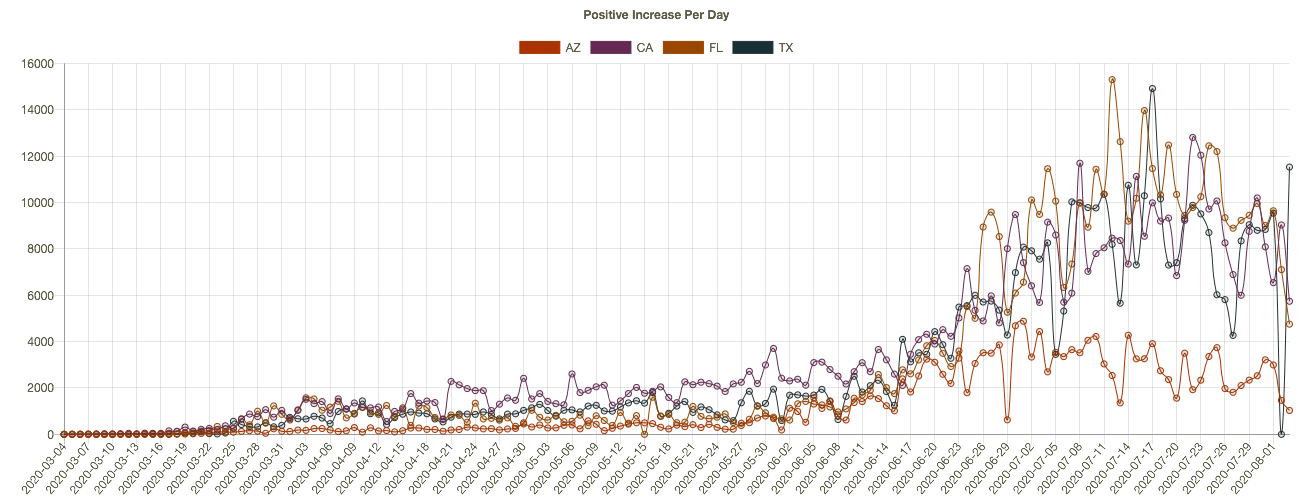
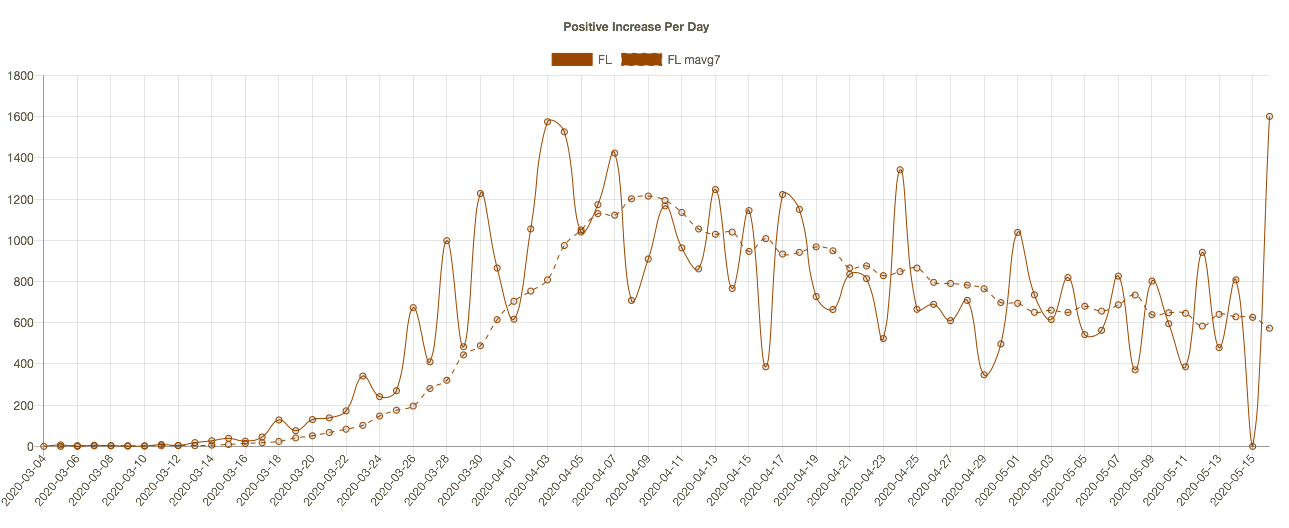
The pro-lockdown contingent predicted the same for Florida, but that has not been the case:
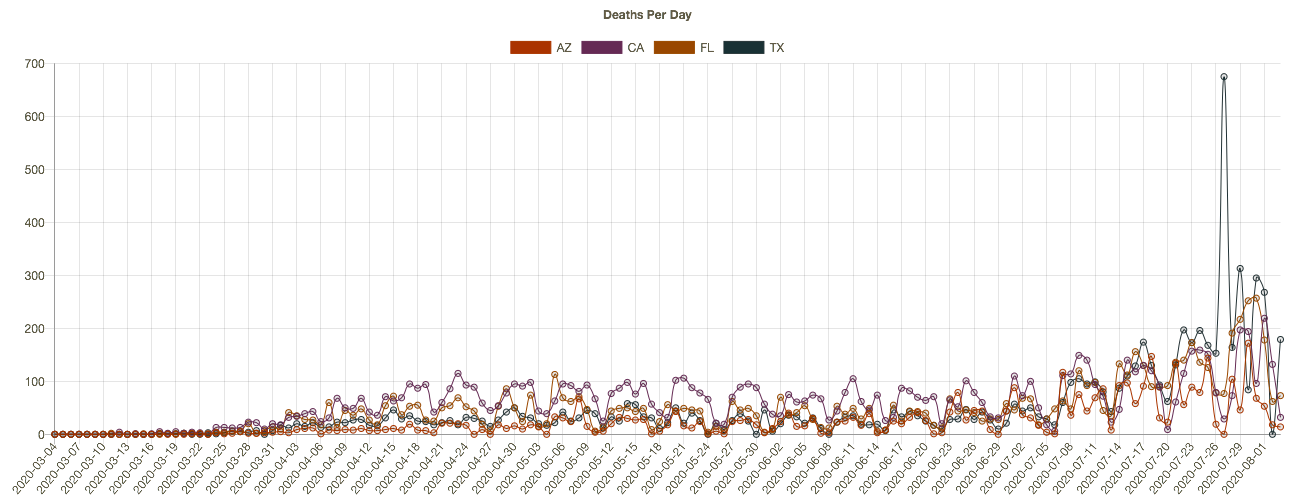
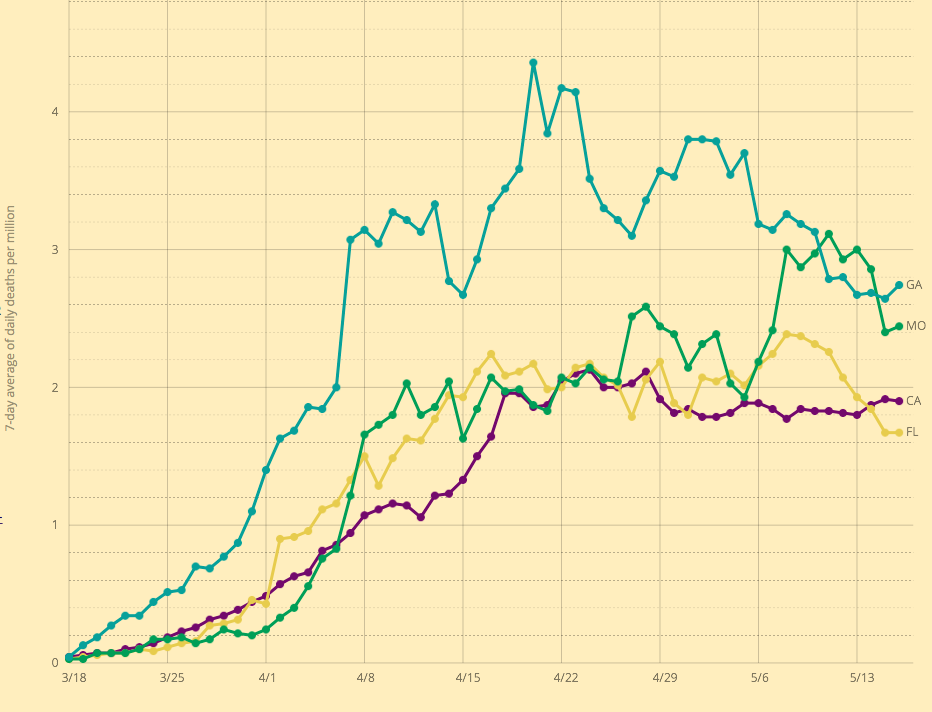
The next chart shows seven-day moving averages of deaths per million of population for four states: CA, FL, GA, and MO. The labels on the right might be hard to read, but MO is the green line. Deaths lag cases by a few weeks, and Missouri’s death rate was elevated more recently, again owing partly to the meat-packing plant. These death rates are all fairly low relative to the northeastern states around New York.
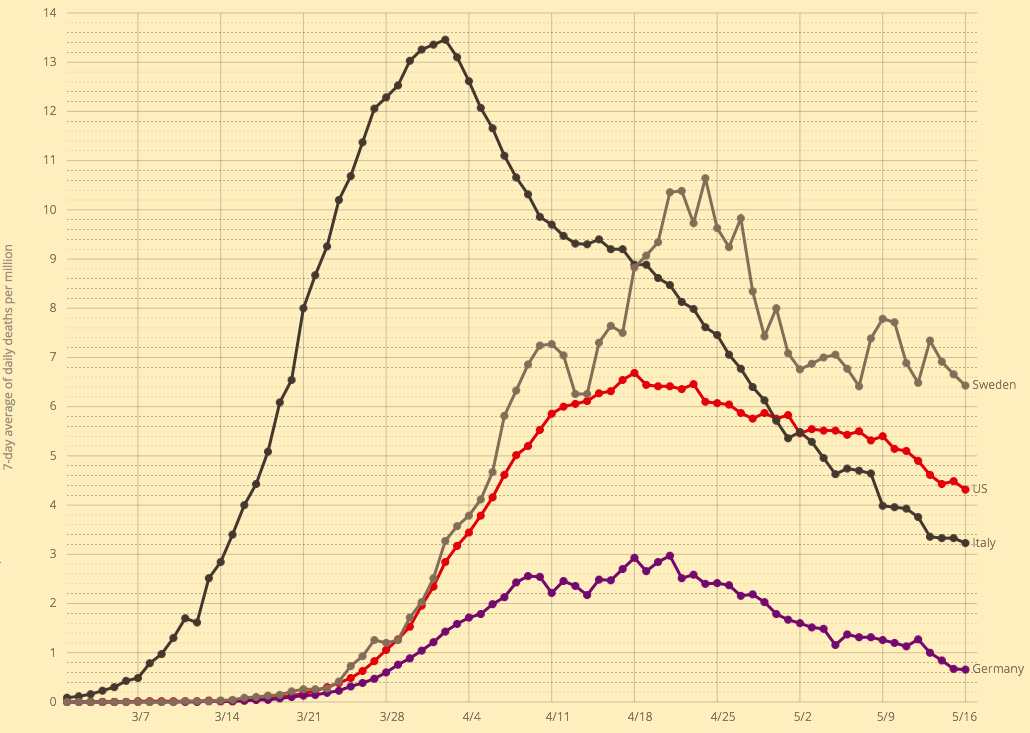
Finally, here are death rates per million of population for a few selected countries: Italy, Germany, Sweden, and the US. Italy had the large early spike, while Germany lagged and with a much lower fatality rate. The U.S. suffered more than twice the German death rate. Sweden, which has pursued a herd immunity strategy, has come in somewhat higher. The Italian and Swedish experiences both reflect high deaths in nursing homes, which might indicate a lack of preparedness at those institutions.
Here is a post from just a few days ago with a nice collection of charts for various countries.
Returning to the main gist of this “framing”, the Great Over-Reaction, the predictions setting off this panic were made by a forecaster, Neil Ferguson, who has had a rather poor track record of predicting the severity of earlier pandemics. The model he used is said to have been poorly coded and documented, and it is underdetermined such that many multiple forecast paths are possible. That means the choice of a “forecast” path is arbitrary.
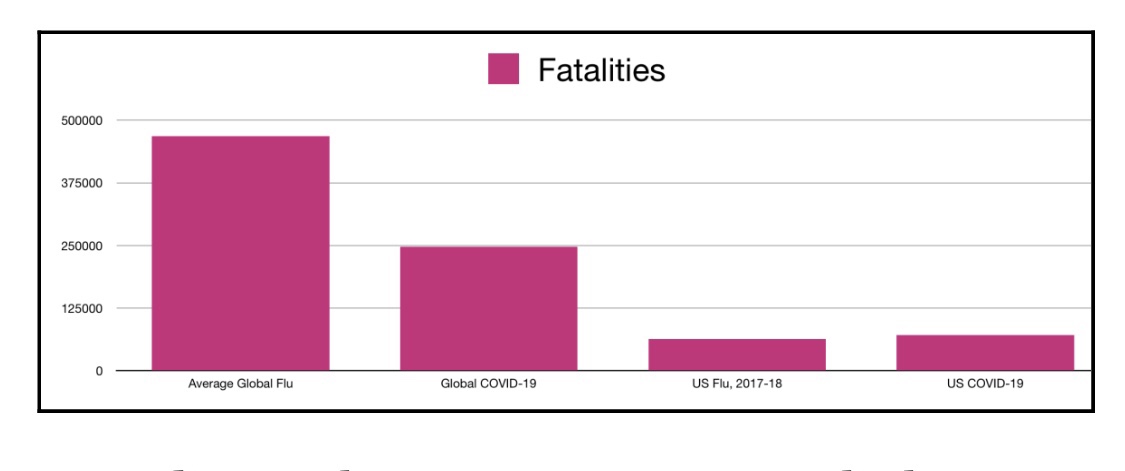
Make no mistake: Covid-19 is a serious virus. Ultimately, however, the Covid-19 pandemic might not reach the scale of a typical global flu: the current global death toll is only about two-thirds of the average flu season (global deaths from Covid-19 are now about 312,000—the chart below is a few days old). In the U.S., the death toll is modestly higher than the average flu season, but that is largely attributable to the New York City metro area. Worldwide, Covid19 deaths are now about 30% of the toll of the Hong Kong flu in 1969-70, 28% of the Asian flu in 1957-58, and far less than 1% of the Spanish flu at the end of WW I. Neither the Hong Kong flu nor the Asian flu were dealt with via widespread non-prescription health interventions like the draconian lockdowns instituted this time. The damage to the economy has been massive and unjustifiable, and the effective moratorium on medical care for other serious conditions is inflicting a large toll of its own.
Again, we can identify distinct groups that are highly vulnerable to Covid-19: the aged and individuals with co-morbidities most common among the aged. A large share of the population is not susceptible, including children and the vast bulk of the work force. The sensible approach is to target vulnerable groups for protection while minimizing interference with the liberties of those capable of taking care of themselves, especially their freedom to weigh risks. Nevertheless, those facing low risks should continue to practice extra-good manners…. er, social distancing, to avoid subjecting others to undue risk. Don’t be a close talker, don’t go out if you feel at all out of sorts, and cover your sneezes!