• About

Sacred Cow Chips

Sacred Cow Chips

Tag Archives: Operation Warp Speed

Let’s Do “First Doses First”

06 Wednesday Jan 2021

Posted by pnoetx in Coronavirus, Vaccinations

≈ Leave a comment

Tags

Alex Tabarrok, Covid-19, FDA, First Doses First, Herd Immunity, Herd Immunity Threshold, Moderna, Operation Warp Speed, Pfizer, Phil Kerpen, Vaccines

Both the Pfizer and the Moderna COVID vaccines require two doses, with an effectiveness of about 95%. But a single dose may have an efficacy of about 80% that is likely to last over a number of weeks without a second dose. There are varying estimates of short-term efficacy, and but see here, here, and here. The chart above is for the Pfizer vaccine (red line) relative to a control group over days since the first dose, and the efficacy grows over time relative to the control before a presumed decay ever sets in.

Unfortunately, doses are in short supply, and getting doses administered has proven to be much more difficult than expected. “First Doses First” (FDF) is a name for a vaccination strategy focusing on delivering only first doses until a sufficient number of the highly vulnerable receive one. After that, second doses can be administered, perhaps within some maximum time internal such as 8 – 12 weeks. FDF doubles the number of individuals who can be vaccinated in the short-term with a given supply of vaccine. Today, Phil Kerpen posted this update on doses delivered and administered thus far:

Dosing has caught up a little, but it’s still lagging way behind deliveries.

As Alex Tabbarok points out, FDF is superior strategy because every two doses create an average of 1.6 immune individuals (2 x 0.8) instead of just 0.95 immune individuals. His example involves a population of 300 million, a required herd immunity level of two-thirds (higher than a herd immunity threshold), and an ability to administer 100 million doses per month. Under a FDF regime, you’ve reached Tabarrok’s “herd immunity” level in two months. (This is not to imply that vaccination is the only contributor to herd immunity… far from it!) Under the two-dose regime, you only get halfway there in that time. So FDF means fewer cases, fewer deaths, shorter suspensions of individual liberty, and a faster economic recovery.

An alternative that doubles the number of doses available is Moderna’s half-dose plan. Apparently, their tests indicate that half doses are just as effective as full doses, and they are said to be in discussions with the FDA and Operation Warp Speed to implement the half-dose plan. But the disadvantage of the half-dose plan relative to FDF is that the former does not help to overcome the slow speed with which doses are being administered.

Vaccine supplies are bound to increase dramatically in coming months, and the process of dosing will no doubt accelerate as well. However, for the next month or two, FDF is too sensible to ignore. While I am not a fan of all British COVID policies, their vaccination authorities have recommended an FDF approach as well as allowing different vaccines for first and second doses.

Unfortunate COVID Follies

08 Wednesday Jul 2020

Posted by pnoetx in Government Failure, Pandemic

≈ Leave a comment

Tags

Arsenic and Old Lace, BAME, Black Asian and Minority Ethnics, BLM, CDC, Coronavirus, Covid-19, Dr. Einstein, Flattening the Curve, Hydroxychloraquine, Jonathan Brewster, Lockdowns, Masks, Operation Warp Speed, Vitamin D Deficiency, World Health Organization

This post is devoted to a few coronavirus policies and positions that trouble me. 

Counting Deaths: People have the general impression that counting COVID-19 cases and deaths is straightforward. The facts are more reminiscent of the following exchange in the film Arsenic and Old Lace, when Jonathan Brewster angrily insists he has offed more souls than his sweet little aunties have poisoned with elderberry wine:

Dr. Einstein: You cannot count the one in South Bend. He died of pneumonia!
Jonathan Brewster: He wouldn’t have died of pneumonia if I hadn’t shot him! 

Here, Dr. Einstein wears the shoes of public health authorities who claim that C19 deaths are undercounted. But lives counted as lost from C19, in many cases, are individuals who also had the flu, pneumonia, stroke, kidney failure, and a variety of other co-morbidities. Yes, other causes of death might be induced by the coronavirus, but like Johnny’s victim in South Bend, many would not have died from C19 if they hadn’t had a prior health event. In addition, otherwise unexplained deaths are often attributed to C19 with little justification.

In fact, the C19 death toll has been distorted by a perverse federal hospital reimbursement policy that rewards hospitals for COVID patients. Death certificates seem to list C19 as the cause for almost anyone who dies in or out of a hospital during the pandemic, whether they’ve been tested or not. In fact, deaths have been attributed to C19 despite negative test results when officials decided, for one reason or another, that the test must have been unreliable!

Lockdowns: almost all of the “curve flattening” in late March and April was accomplished by voluntary action, which I’ve covered before here. The lockdowns imposed by state and local governments were highly arbitrary and tragic for many workers and business owners who could have continued to operate as safely as many so-called “essential” businesses. Lockdowns in certain areas were also blatant violations of religious rights. There is little to no evidence that lockdowns themselves led to any actual abatement of the virus. And of course, people are fed up! 

The Beach: Right now I’m at a wonderful beach condo in Florida for a week. There are other people on the beach, mostly families and a few groups of friends, but there is plenty of open space. You will not catch the coronavirus on a beach like this. And there is almost zero chance you’ll catch it on any beach. In fact, the chance you’ll catch it anywhere outside is minuscule unless you’re jammed so tightly among hundreds of protesters that you can’t even turn around. Yet government officials have closed beaches in many parts of the country while allowing the protests to go on. Oh sure, they think people will CROWD onto beaches as if they’re at a BLM protest… except they’re not. Ah, then it must be banned! That takes a special kind of dumbass.     

Waiting for Results: How could we have spent trillions of dollars as a nation on economic stimulus, much of it skimmed off by grifters, but we can’t seem to get sufficient resources to make calls to those awaiting test results? This is a case of misplaced priorities. Even now, people are waiting more than a week for their results, and many are wandering around in the community without knowing their status. Wouldn’t you think we’d get that done? We can conduct well over a half million tests a day, but can’t we find a few bucks to deliver results via phone, email, or text within 24 hours of processing results. This is truly absurd. 

Vaccine Candidates: A similar point can be made about vaccine development: We are spending $5 billion on Operation Warp Speed to build capacity in advance for five promising vaccine candidates. These will be identified over the next few months, and it looks as if all five will come from established pharmaceutical majors. There are many more vaccine candidates, however, some being developed by smaller players using inventive new techniques. The OWS expenditure looks pretty meager when you compare it to the trillions in funds the federal government is spending on economic stimulus, especially when finding an effective vaccine would obviate much of the stimulus. 

Treatment: Hydroxycloroquine has been found to lower the death rate from COVID-19 in a large controlled trial. Congratulations, morons, for trashing HCQ as a potential treatment, solely because Trump mentioned it. Way to go, dumbasses, for banning the use of a potential treatment that could have saved many thousands of lives. 

Air Conditioning: I’m shocked that public health experts haven’t been more vocal about the potentially dangerous effects of running air conditioners at high levels in public buildings. The virus is known to thrive in cool, dry environments, which is exactly what AC creates, yet this seems to have been almost completely ignored.   

Vitamin D: Likewise, I think public health experts have been far too reticent about the connection between Vitamin D deficiencies and the severity of C19 (also see here and here). The accumulating evidence about this association offers an explanation for the disturbingly high severity of cases among Black, Asian and Minority Ethnics (BAME), not to mention a possible role in C19 deaths among the generally D-deficient nursing home population. For the love of God, get the word out to the community that Vitamin D supplements might help, and they won’t hurt, and otherwise, tell people to get some sun!

Masks: I’m not in favor of strict mask mandates, but I have trouble understanding the aversion to masks among certain friends. Of course, there’s been way too much mixed messaging on the benefits of masks, and it didn’t all come from politicians! Scientists, the CDC, and the World Health Organization seemingly did everything possible to squander their credibility on this and other issues. However, a consensus now seems to have developed that masks protect others from the wearer and seem to protect the wearer from others as well. It should be obvious that masks offer a middle ground on which the economy can be restarted while mitigating the risks of further contagion. But even if you don’t believe masks protect the wearer, but only protect others from an infected wearer, donning a mask inside buildings, and when social distancing is impossible, still qualifies as a mannerly thing to do.  


Coronavirus Framing #7: Second Wave Uncertainty

19 Friday Jun 2020

Posted by pnoetx in Pandemic

≈ 1 Comment

Tags

Air Conditioning, Asian Flu, Case Fatality Rate, CDC, Coronavirus, COVID Time Series, Covid Tracking Project, Effective Herd Immunity, George Floyd, HHS, High Cholesterol, Hong Kong Flu, Johns Hopkins, Operation Warp Speed, Pooled Testing, Reverse Seasonal Effect, Rich Lowry, Social Distancing, Testing, Vitamin D Deficiency

We’re now said to be on the cusp of a “second wave” of coronavirus infections. It’s become a new focus of media attention in the past week or so. Increased infections have been reported across a number of states, especially in the south, but I’m not especially alarmed at this point for reasons explained below. Either way, the public policy response will certainly be different this time, at least in most areas. We’ve learned that a more targeted approach to managing coronavirus risk is far less costly, which means eschewing general lockdowns in favor of focusing resources on protecting the most vulnerable. That approach is supported by research weighing the costs and benefits of the alternatives (also see here and here).

The targeted approach I’ve advocated does not call for any less caution on the part of individuals. That means avoiding prolonged, close contact with others, especially indoors. I don’t mind wearing a mask when inside stores or public buildings, but I believe it should be voluntary. I do my best to stay out of close proximity to most others in public places anyway, masked or otherwise. This is voluntary social distancing. I also believe public health authorities should be more active in disseminating information on known correlates of coronavirus severity, such as Vitamin D deficiency, high LDL cholesterol, and the “reverse seasonal effect” caused by low humidity in air-conditioned spaces. I would also strongly agree that the effort to identify and mass produce vaccine candidates, known as Operation Warp Speed, should be ramped up considerably, with heavier funding and more than five vaccine candidates.

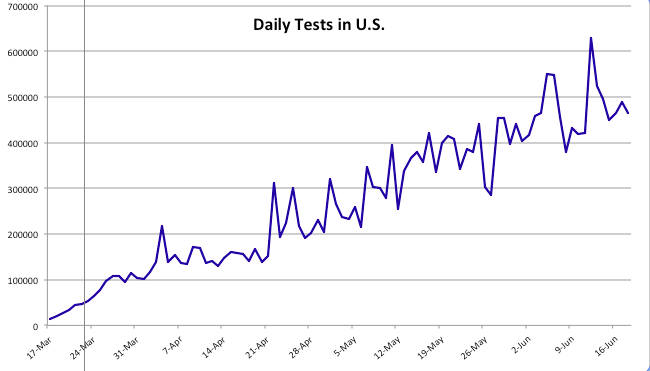
We’ve seen a continuing increase in coronavirus testing since my last “framing” post about a month ago. Testing has increased to a daily average of almost 500,000 over the past two weeks. At present we appear to have an excess supply of testing capacity in many areas, as Rich Lowry notes:

“The problem with testing nationally is becoming less a shortfall of availability of the tests and more a shortfall of people showing up to get tested. An insider in the diagnostics industry says that laboratories are reporting that they are ‘sample starved’ — i.e., they aren’t getting enough specimens. He notes, ‘We have all seen stories about sample-collection sites in some regions not seeing that many patients.’

An HHS official says that in May there was the capacity to do twice as many tests as were actually performed, calling it a function of ‘allocation and efficiency, but more just demand.’ Says Giroir, ‘We really see areas in the country now that there’s more tests available than people who want to get tested or the need for testing.'”

Before turning to some charts, a word about the data in the charts I’ve been using throughout the pandemic. Some of the nationwide information was directly from the CDC or the Johns Hopkins dashboard. In other cases, I’ve reported state level data and some nationwide data published by The COVID Tracking Project (CTP) and the COVID Time Series (CTS) dashboard, which uses state data from CTP. I first noticed a few discrepancies in the national totals in April, which have become larger with growth in the counts of cases and deaths. Here is a key part of CTP’s explanation:

“For many states, the CDC publishes higher testing numbers than the states themselves report, which raises questions about the structure and integrity of both state and federal data reporting. … Another point of contrast between the CDC’s new reporting and the official state data compiled by The COVID Tracking Project is that the CDC has not released historical, state-level testing data for the first three months of the outbreak.”

Thus, the CDC currently reports almost 120,000 U.S. deaths, while CTP reports about 112,000. Nevertheless, I will continue to report numbers from both sources for the sake of continuity, and I will try to remember to note the source in each case.

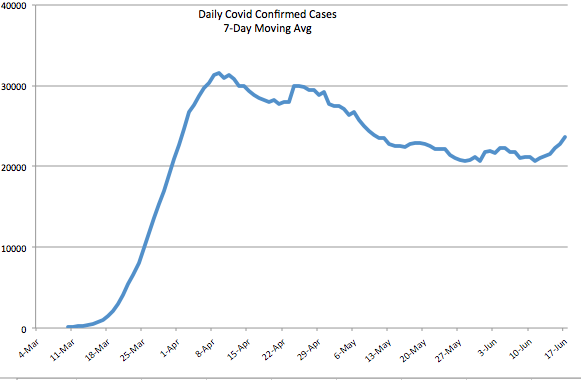
The first chart below shows the number of daily tests from CTP; the second chart shows the number of daily confirmed cases (CTP). Since mid-May, daily testing has increased by more than 50%, calculated on a moving average basis, and is now approaching half a million per day or more than 3 million per week. Pooled testing is coming, which will ultimately increase testing capacity several-fold. Daily confirmed cases have been hovered just above 20,000 since around Memorial Day, with a recent turn upward to around 24,000.

Early in the pandemic, I made the mistake of focusing too heavily on case numbers. Yes, I adjusted for population size and was aware that the initial shortage of tests was restraining diagnoses. Still, I did not foresee the great expansion in testing we’ve witnessed, the great transmissibility of the virus in some regions, nor the large number of asymptomatic cases that would ultimately be diagnosed.

The daily percentage of positive tests (CTP), which is smoothed in the chart below using a seven-day moving average to eliminate within-week variability, has declined gradually since early April to about 4% before the uptick in the last few days. Still, that’s a drop of about 75% from the peak when tests were in very short supply. Those were days when even heavily symptomatic individuals were having trouble getting tested.

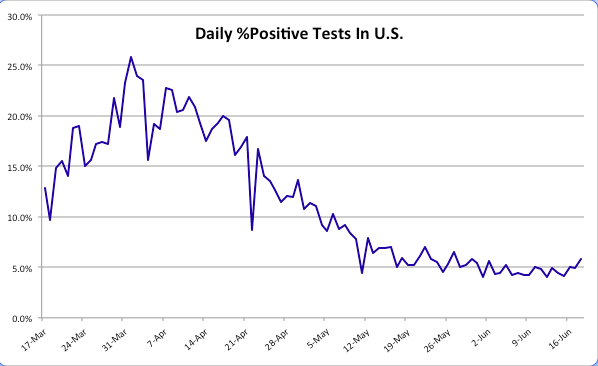
We’d hope to see a resumption in the decline of the positive percentage as testing continues to grow, but even with a relatively constant positivity rate, the number of daily confirmed cases must grow as testing expands. There may be several reasons the positivity rate has remained stubbornly near 5% over the past few weeks. One is the obvious reversal in social distancing as states have opened up. People became less fearful about the virus in general, and protesters jammed the streets after the George Floyd murder in Minneapolis. Another reason is that there are new areas of focus for testing that might be picking up cases. For example, hospitals in some states are now testing all admissions for COVID-19. This will tend to pick up more infections to the extent that individuals with co-morbidities are hospitalized at higher rates in general and are also more susceptible to the coronavirus. Finally, testing more broadly is likely to pick up a larger share of asymptomatic cases even as the “true rate” of infection declines.

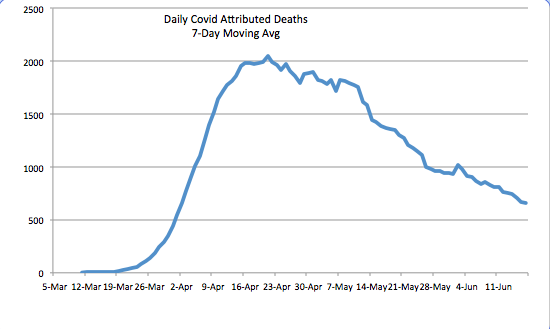
The daily death toll (CTP) attributed to coronavirus has continued to decline. See below. It is now running at about a third of the peak level it reached in mid-April. There are several reasons for the decline. One is the lower number of active cases, changes in which lead deaths by a few weeks. Awareness and testing capacity have undoubtedly led to earlier diagnosis of the most severe cases. There is also the strong possibility that the virus, having felled some of the most susceptible individuals, is now up against more hosts with effective immune responses. An ongoing degree of social distancing, more humid weather, and more direct sunlight have probably reduced initial viral loads from those experienced early-on, when the case load was escalating. Finally, treatment has improved in multiple ways, and there are now a few medications that have shown promise in shortening the duration and severity of infection.

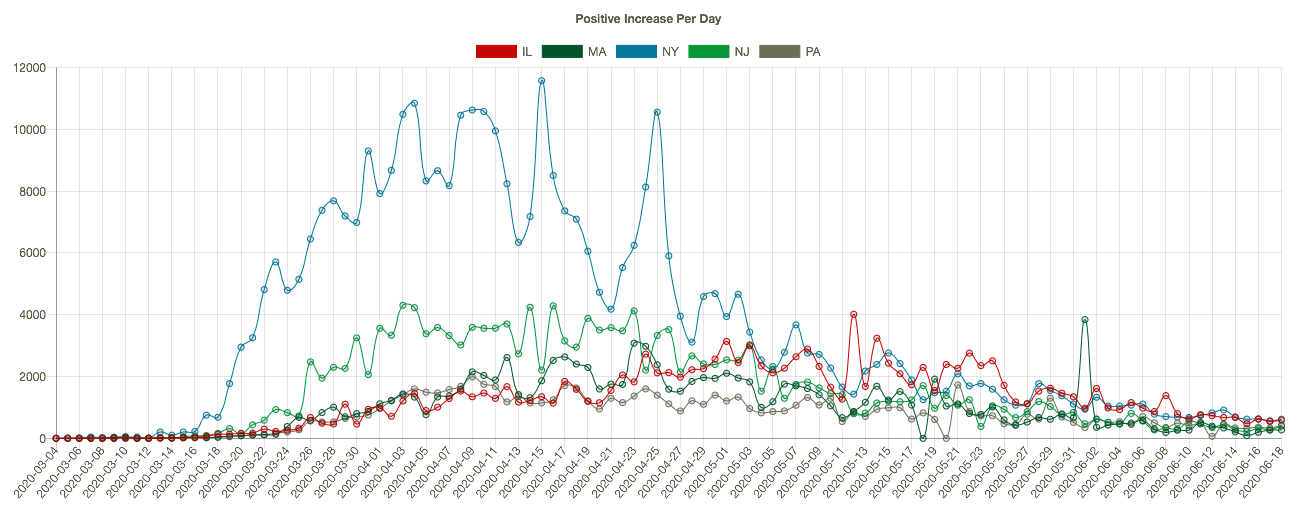
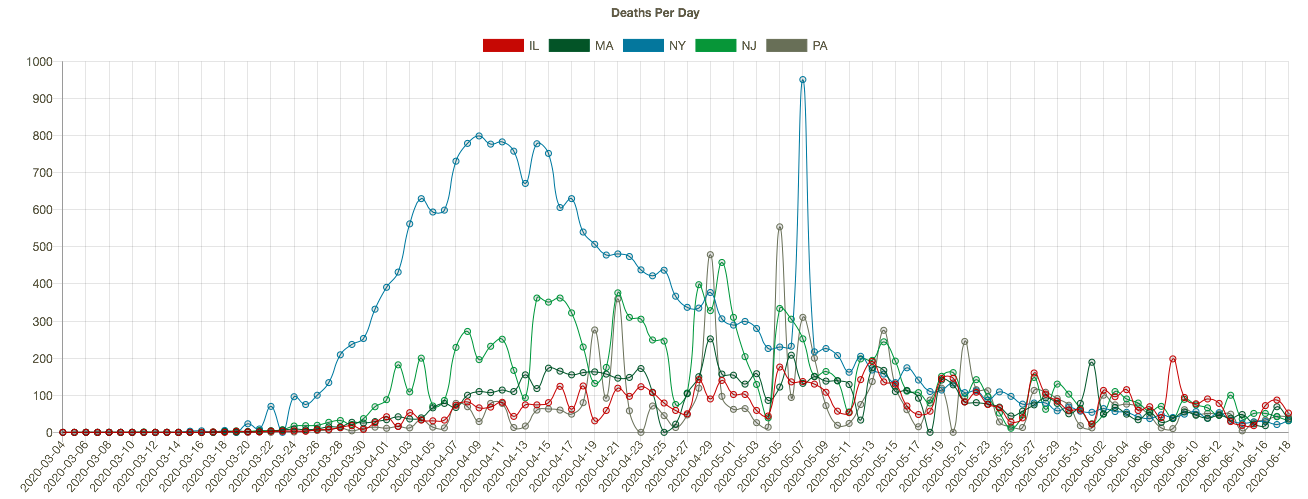
The course of the pandemic has varied greatly across countries and across regions of the U.S. The New York City area was especially hard hit along with several other large cities, as well as Louisiana. CTS shows that states with the highest cumulative number of coronavirus deaths (New York (blue line), New Jersey (green), Massachusetts, Illinois, and Pennsylvania in the charts below) have experienced downward trends in positive cases per day (the first chart below), leading daily deaths downward in May and early June (the second chart — NY’s downtrend began earlier). I apologize if the charts below are difficult to read, but they have resisted my efforts at resizing. Note: I’m mainly focused on trends here, and I have not shown these series on a per capita basis.

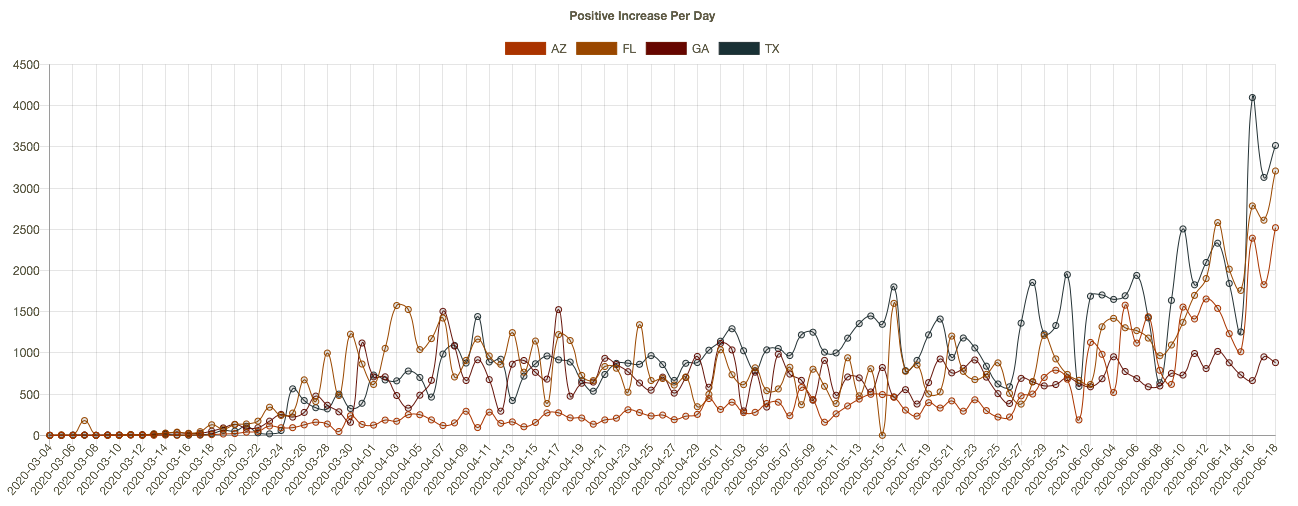
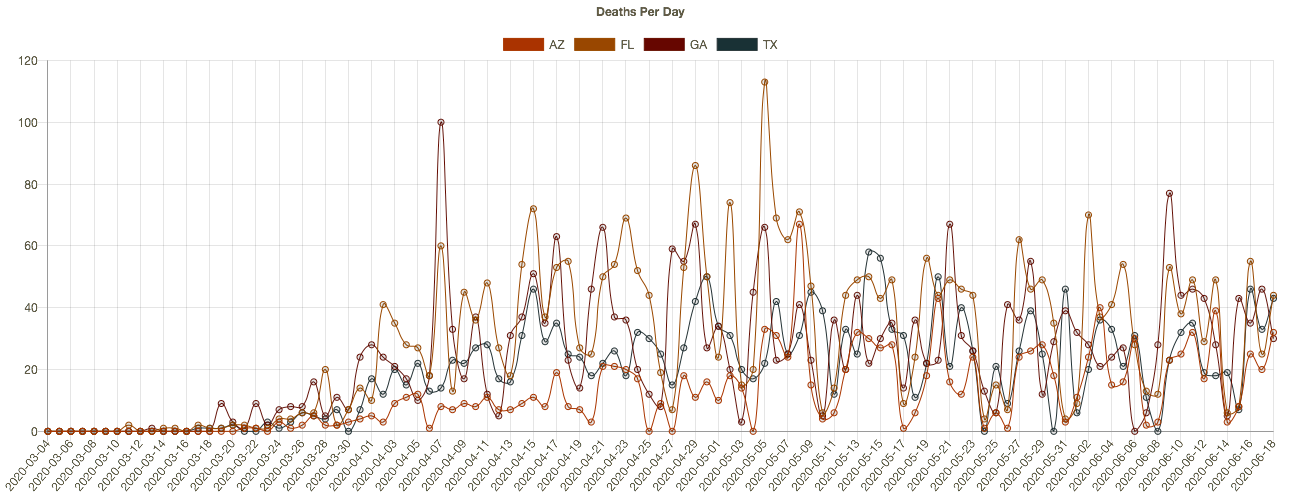
More recently, almost two dozen states have begun to see higher daily case diagnoses. Several of these had more favorable outcomes in the early months of the pandemic and were in more advanced stages of reopening. The charts below (CTS) show results for Arizona, Florida, Georgia, and Texas. The new “hot spots” in these states are mostly urban centers. It’s not clear that the reopenings are to blame, however. The protests after George Floyd’s murder may have contributed in cities like Houston, though no increase in New York is apparent as yet. The states in the chart are all in the south or southwest, so the increases have occurred despite sunny, warm conditions. It’s possible that hot weather has prompted more intensive use of air conditioning, which dries indoor environments and can promote the spread of the virus. These southern states have not yet experienced a corresponding increase in deaths, though that would occur with a lag. 

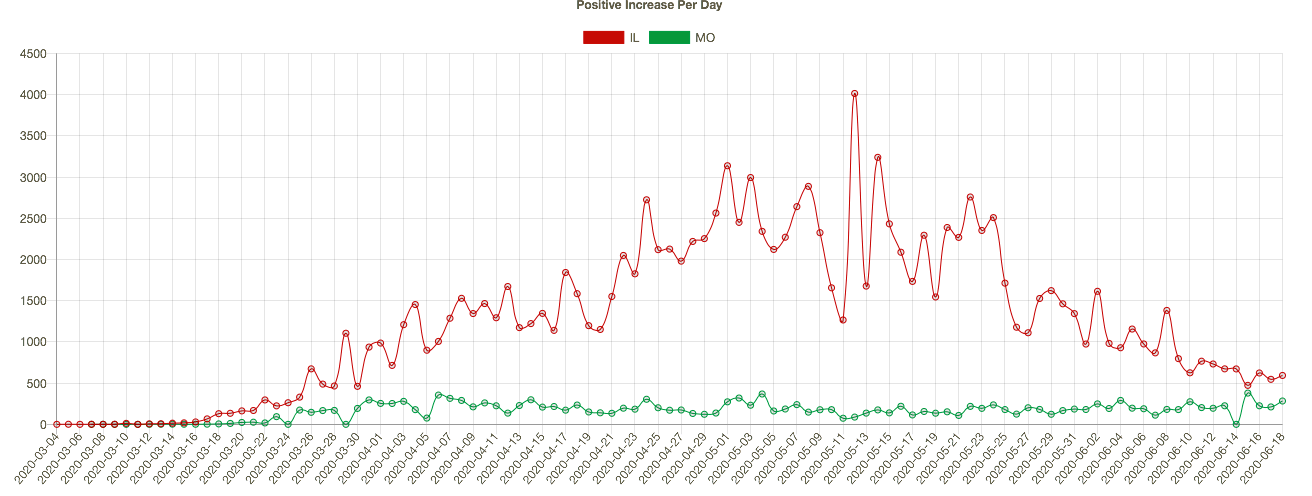
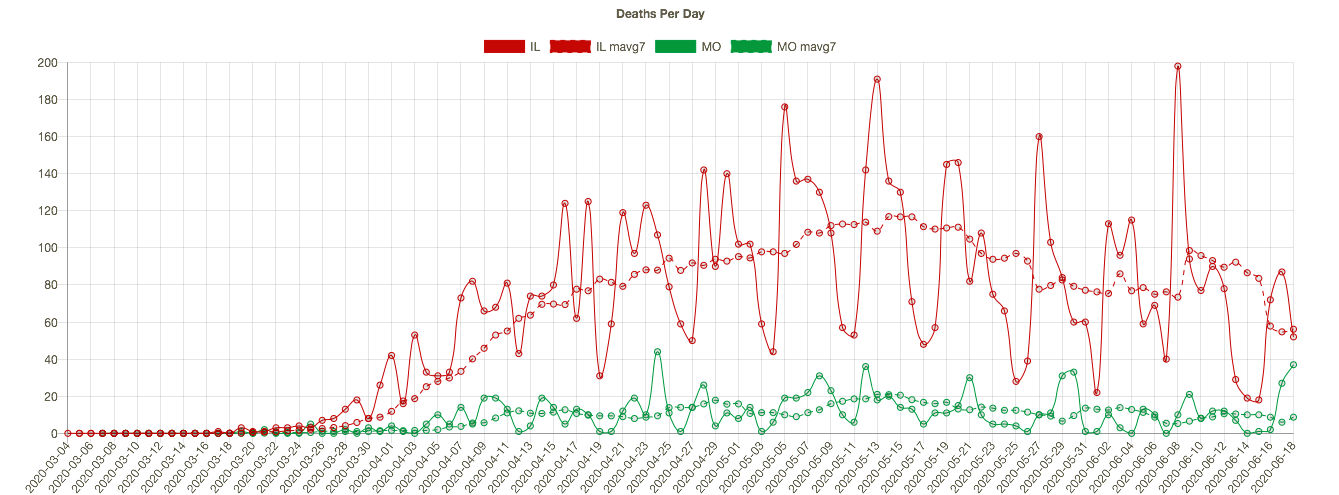
Missouri has seen an slow upward trend in its daily positive test count over the past four weeks, even though the state’s positive rate has trended down slowly since early May. I show MO’s confirmed cases per day below (in green) together with Illinois’ (because my hometown is on the border and the two states are a nice contrast). IL is much larger and has had a much higher case load, but the downward trend in new cases in IL is impressive. Coronavirus deaths per day are shown in the second chart below, with seven-day averages superimposed. Deaths have also trended down in both states, though MO has experienced a few bad days very recently, and MO’s case fatality rate is slightly higher than in IL.

We’ll know fairly soon whether we’re really headed for a second major wave. However, the case count, in and of itself, is not too informative. Testing has increased markedly, so we would expect to see more cases diagnosed. The percent of tests that are positive is a better indicator, and it has flattened at a still uncomfortable 5% for about a month, with a slight uptick in the past few days. Even more telling will be the future path of coronavirus deaths. My expectation is that more recent infections are likely to be less deadly, if only because of the lessons learned about protecting the care-bound elderly. I also believe we’re not too far from what I have called effective herd immunity. 

The pandemic has taken a heavy toll, especially among the aged. In fact, total deaths in the U.S. have now exceeded both the Hong Kong flu of the late 1960s and the Asian flu of the late 1950s. Unfortunately, risks will remain elevated for some time. However, any reasonable estimate of the life-years lost is considerably less than in those earlier pandemics due to the differing age profiles of the victims. In any case, the coronavirus pandemic has not been the kind of apocalyptic event that was originally feared and erroneously predicted by several prominent epidemiological models. It can be tackled effectively and at much lower cost by focusing resources on protecting vulnerable segments of the population. 

.

Follow Sacred Cow Chips on WordPress.com

Recent Posts

  • Long COVID: a Name For Post-Viral Syndrome
  • Cash Flows and Hospital Woes
  • Let’s Do “First Doses First”
  • Fauci Flubs Herd Immunity
  • Allocating Vaccine Supplies: Lives or “Justice”?

Archives

  • January 2021
  • December 2020
  • November 2020
  • October 2020
  • September 2020
  • August 2020
  • July 2020
  • June 2020
  • May 2020
  • April 2020
  • March 2020
  • February 2020
  • January 2020
  • December 2019
  • November 2019
  • October 2019
  • September 2019
  • August 2019
  • July 2019
  • June 2019
  • May 2019
  • April 2019
  • March 2019
  • February 2019
  • January 2019
  • December 2018
  • November 2018
  • October 2018
  • September 2018
  • August 2018
  • July 2018
  • June 2018
  • May 2018
  • April 2018
  • March 2018
  • February 2018
  • January 2018
  • December 2017
  • November 2017
  • October 2017
  • September 2017
  • August 2017
  • July 2017
  • June 2017
  • May 2017
  • April 2017
  • March 2017
  • February 2017
  • January 2017
  • December 2016
  • November 2016
  • October 2016
  • September 2016
  • August 2016
  • July 2016
  • June 2016
  • May 2016
  • April 2016
  • March 2016
  • February 2016
  • January 2016
  • December 2015
  • November 2015
  • October 2015
  • September 2015
  • August 2015
  • July 2015
  • June 2015
  • May 2015
  • April 2015
  • March 2015
  • February 2015
  • January 2015
  • December 2014
  • November 2014
  • October 2014
  • September 2014
  • August 2014
  • July 2014
  • June 2014
  • May 2014
  • April 2014
  • March 2014

Blogs I Follow

  • TLCCholesterol
  • Nintil
  • kendunning.net
  • DCWhispers.com
  • Hoong-Wai in the UK
  • Marginal REVOLUTION
  • CBS St. Louis
  • Watts Up With That?
  • Aussie Nationalist Blog
  • American Elephants
  • The View from Alexandria
  • The Gymnasium
  • Public Secrets
  • A Force for Good
  • ARLIN REPORT...................walking this path together
  • Notes On Liberty
  • troymo
  • SUNDAY BLOG Stephanie Sievers
  • Miss Lou Acquiring Lore
  • Your Well Wisher Program
  • Objectivism In Depth
  • RobotEnomics
  • Orderstatistic
  • Paradigm Library
  • Scattered Showers and Quicksand

Blog at WordPress.com.

TLCCholesterol

The Cholesterol Blog

Nintil

To estimate, compare, distinguish, discuss, and trace to its principal sources everything

kendunning.net

The future is ours to create.

DCWhispers.com

Hoong-Wai in the UK

A Commonwealth immigrant's perspective on the UK's public arena.

Marginal REVOLUTION

Small Steps Toward A Much Better World

CBS St. Louis

News, Sports, Weather, Traffic and St. Louis' Top Spots

Watts Up With That?

The world's most viewed site on global warming and climate change

Aussie Nationalist Blog

Commentary from a Paleoconservative and Nationalist perspective

American Elephants

Defending Life, Liberty and the Pursuit of Happiness

The View from Alexandria

In advanced civilizations the period loosely called Alexandrian is usually associated with flexible morals, perfunctory religion, populist standards and cosmopolitan tastes, feminism, exotic cults, and the rapid turnover of high and low fads---in short, a falling away (which is all that decadence means) from the strictness of traditional rules, embodied in character and inforced from within. -- Jacques Barzun

The Gymnasium

A place for reason, politics, economics, and faith steeped in the classical liberal tradition

Public Secrets

A 93% peaceful blog

A Force for Good

How economics, morality, and markets combine

ARLIN REPORT...................walking this path together

PERSPECTIVE FROM AN AGING SENIOR CITIZEN

Notes On Liberty

Spontaneous thoughts on a humble creed

troymo

SUNDAY BLOG Stephanie Sievers

Escaping the everyday life with photographs from my travels

Miss Lou Acquiring Lore

Gallery of Life...

Your Well Wisher Program

Attempt to solve commonly known problems…

Objectivism In Depth

Exploring Ayn Rand's revolutionary philosophy.

RobotEnomics

(A)n (I)ntelligent Future

Orderstatistic

Economics, chess and anything else on my mind.

Paradigm Library

OODA Looping

Scattered Showers and Quicksand

Musings on science, investing, finance, economics, politics, and probably fly fishing.

Cancel