• About

Sacred Cow Chips

Sacred Cow Chips

Tag Archives: Herd Immunity Threshold

CDC Makes a Bum Lead Steer: Alternate Reality vs. The Herd

16 Sunday May 2021

Posted by pnoetx in Herd Immunity, Pandemic

≈ 2 Comments

Tags

Adam Kucharski, Andy Slovitt, Anthony Fauci, CDC, Degrees of Separation, Herd Immunity, Herd Immunity Threshold, Joe Biden, Jordan Schachtel, Nathan D. Grawe, Obesity, Phil Kerpen, Pre-existing Immunity, Precautionary Principle, Reproduction Rate, Seroprevalence, Sub-Herds, Super-Spreader Events, Vaccinations, Vitamin D, Zero COVID

Jordan Schachtel enjoyed some schadenfreude last week when he tweeted:

“I am thoroughly enjoying the White House declaring COVID over and seeing the confused cultists having a nervous breakdown and demanding the continuation of COVID Mania.”

It’s quite an exaggeration to say the Biden Administration is “declaring COVID over”, however. They’re backpedaling, and while last week’s CDC announcement on masking is somewhat welcome, it reveals more idiotic thinking about almost everything COVID: the grotesquely excessive application of the precautionary principle (typical of the regulatory mindset) and the mentality of “zero COVID”. And just listen to Joe Biden’s tyrannical bluster following the CDC announcement:

“The rule is now simple: get vaccinated or wear a mask until you do.

The choice is yours.”

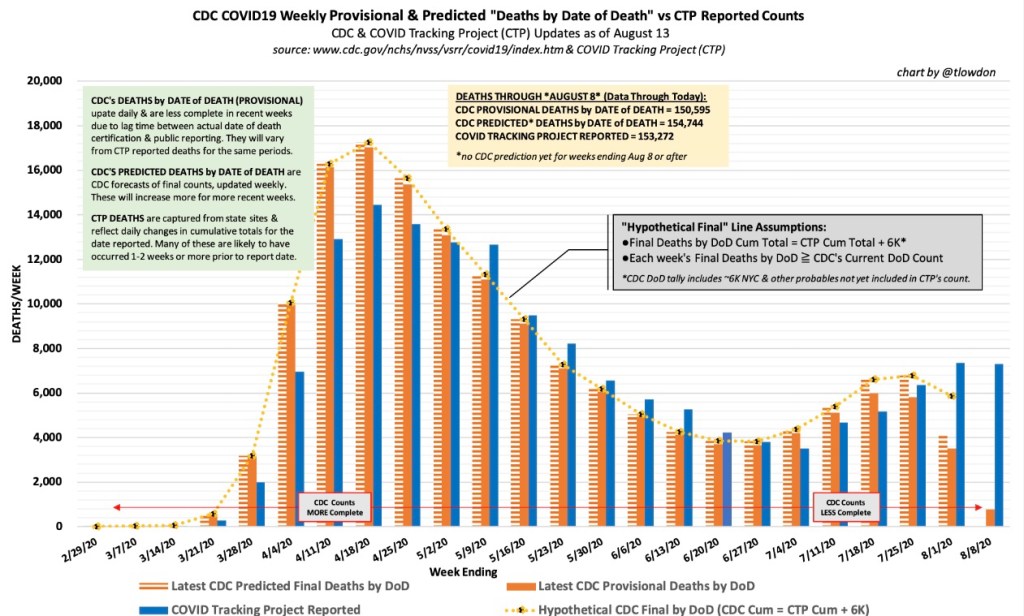
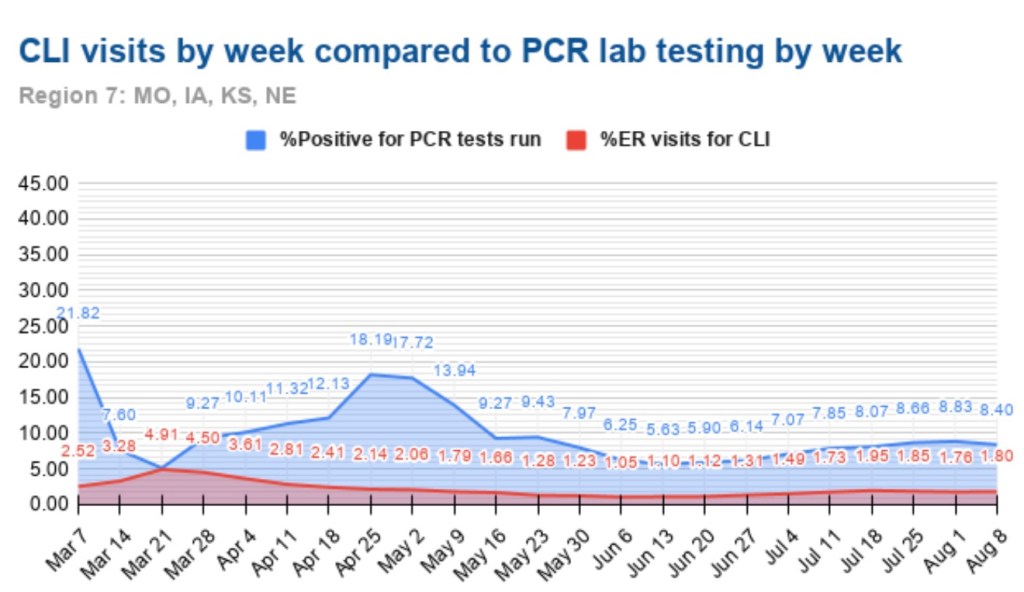
Is anyone really listening to this buffoon?Unfortunately, yes. But there’s no federal “rule”, unless your on federal property; it constitutes “guidance” everywhere else. I’m thankful our federalist system still receives a modicum of respect in the whole matter, and some states have chosen their own approaches (“Hooray for Florida”). Meanwhile, the state of the pandemic looks like this, courtesy of Andy Slavitt:

False Assertions

The CDC still operates under the misapprehension that kids need to wear masks, despite mountains of evidence showing children are at negligible risk and tend not to be spreaders. Here’s some evidence shared by Phil Kerpen on the risk to children:

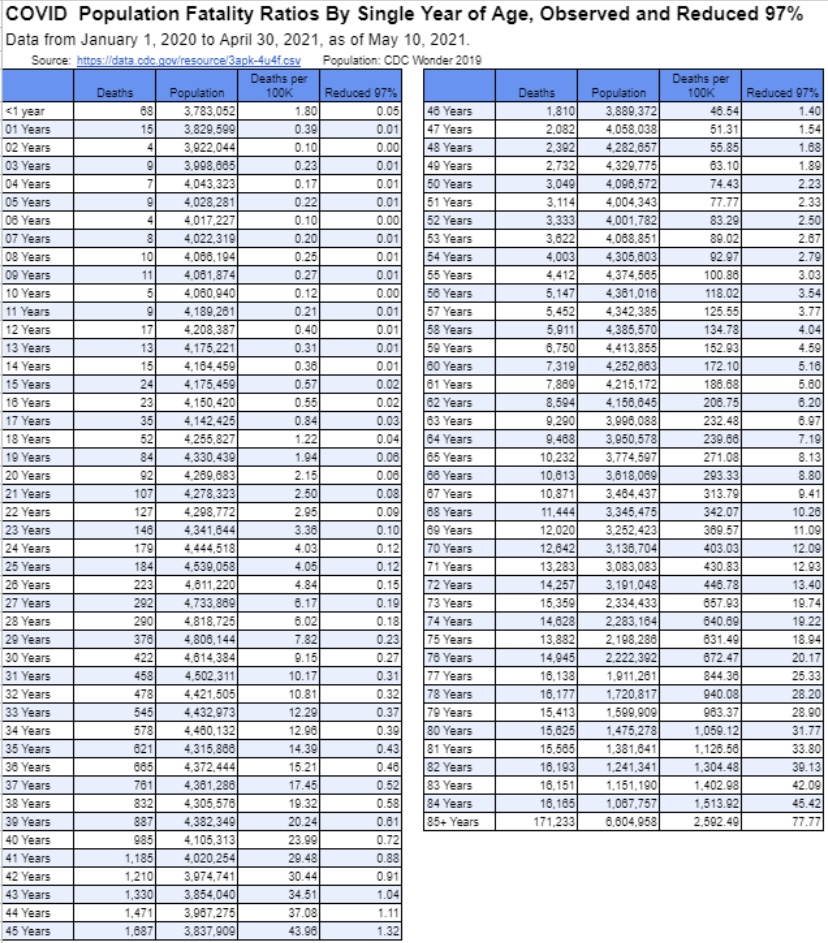
The chart shows the fatality risk by age (deaths per 100,000), and then under the assumption of a 97% reduction in that risk due to vaccination, which is quite conservative. Given that kind of improvement, an unvaccinated 9 year-old child has about the same risk as a fully vaccinated 30 year-old!

The CDC still believes the unvaccinated must wear masks outdoors, but unless you’re packed in a tight crowd, catching the virus outdoors has about the same odds as a piano falling on your head. And the CDC insists that two shots of mRNA vaccine (Pfizer or Moderna) are necessary before going maskless, but only one shot of the Johnson and Johnson vaccine, even though J&J’s is less effective than a single mRNA jab!

Other details in the CDC announcement are worthy of ridicule, but for me the most aggravating are the agency’s implicit position that herd immunity can only be achieved through vaccination, and its “guidance” that the unvaccinated should be dealt with coercively, even if they have naturally-acquired immunity from an infection!

Tallying Immunity

Vaccination is only one of several routes to herd immunity, as I’ve noted in the past. For starters, consider that a significant share of the population has a degree of pre-existing immunity brought on by previous exposure to coronaviruses, including the common cold. That doesn’t mean they won’t catch the virus, but it does mean they’re unlikely to suffer severe symptoms or transmit a high viral load to anyone else. Others, while not strictly immune, are nevertheless unlikely to be sickened due to protections afforded by healthy vitamin D levels or because they are not obese. Children, of course, tend to be fairly impervious. Anyone who’s had a bout with the virus and survived is likely to have gained strong and long-lasting immunity, even if they were asymptomatic. And finally, there are those who’ve been vaccinated. All of these groups have little or no susceptibility to the virus for some time to come.

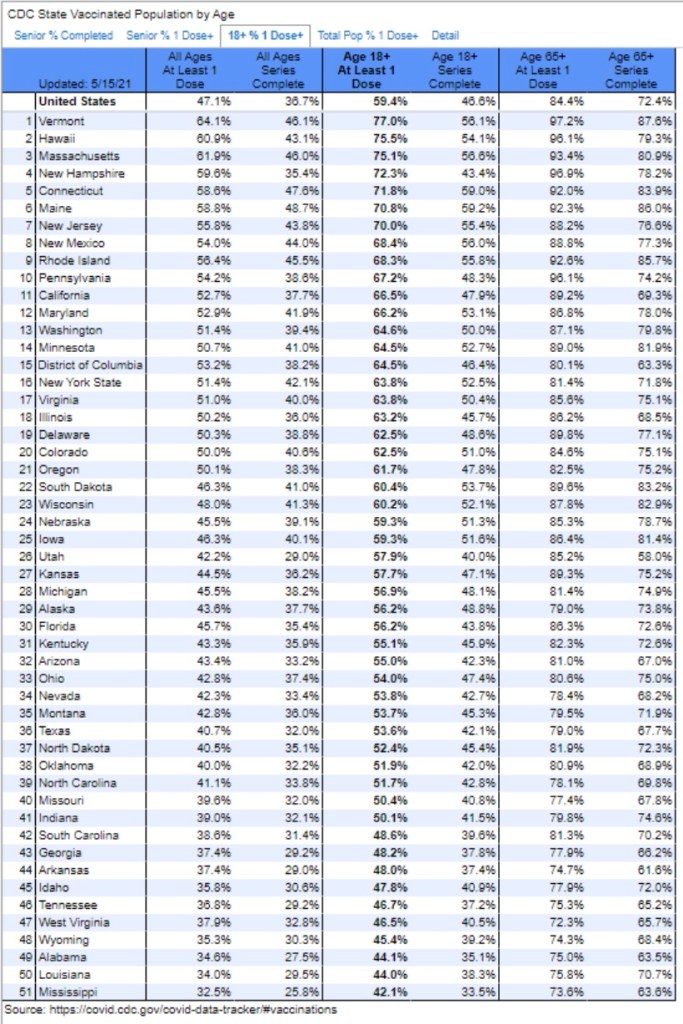
It’s not necessary to vaccinate everyone to achieve herd immunity, nor is it necessary to reach something like an 85% vax rate, as the fumbling Dr. Fauci has claimed. Today, almost 47% of the U.S. population has received at least one dose, or about 155 million adults. Here’s Kerpen’s vax update for May 14.

Another 33 million people have had positive diagnoses and survived, and estimates of seroprevalence would add perhaps another 30 million survivors. Some of those individuals have been vaccinated unnecessarily, however, and to avoid double counting, let’s say a total of 50 million people have survived the virus. Some 35 million children in the U.S. are under age 12. Therefore, even if we ignore pre-existing immunity, there are probably about 240 million effectively immune individuals without counting the remaining non-susceptibles. At the low end, based on a population of 330 million, U.S. immunity is now greater than 70%, and probably closer to 80%. That is more than sufficient for herd immunity, as traditionally understood.

The Herd Immunity Threshold

Here and in the following section I take a slightly deeper dive into herd immunity concepts.

Herd immunity was one of my favorite topics last year. I’m still drawn to it because it’s so misunderstood, even by public health officials with pretensions of expertise in the matter. My claim, about which I’m not alone, is that it’s unnecessary for a large majority of the population to be infected (or vaccinated) to limit the spread of a virus. That’s primarily because there is great variety in individuals’ degree of susceptibility, social connections, aerosol production, and viral load if exposed: call it heterogeneity or diversity if you like. Variation across individuals naturally limits a contagion relative to a homogeneous population.

Less than 1% of those who caught the virus died, while the others recovered and acquired immunity. The remaining subset of individuals most vulnerable to severe illness was thus reduced over time via acquired immunity or death. This is the natural dynamic that causes contagions to slow and ultimately peter out. In technical jargon, the virus reproduction rate “R” falls below a value of one. The point at which that happens is called the “herd immunity threshold” (HIT).

A population with lots of variation in susceptibility will have a lower HIT. Some have estimated a HIT in the U.S. as low as 15% -25%. Ultimately, total exposure will go much higher than the HIT, perhaps well more than doubling exposure, but the contagion recedes once the HIT is reached. So again, it’s unnecessary for anywhere near the full population to be immune to achieve herd immunity.

One wrinkle is that CIVID is now likely to have become endemic. Increased numbers of cases will re-emerge seasonally in still-susceptible individuals. That doesn’t contradict the discussion above regarding the HIT rate: subsequent waves will be quite mild by comparison with the past 14 months. But if the effectiveness of vaccines or acquired immunity wanes over time, or as healthy people age and become unhealthy, re-emergence becomes a greater risk.

Sub-Herd Immunity

A further qualification relates to so-called sub-herds. People are clustered by geographical, social, and cultural circles, so we should think of society not as a singular “herd”, but as a collection of sub-herds having limited cross-connectivity. The following charts are representations of different kinds of human networks, from Nathan D. Grawe’s review of “The Rules of Contagion, by Adam Kucharski:

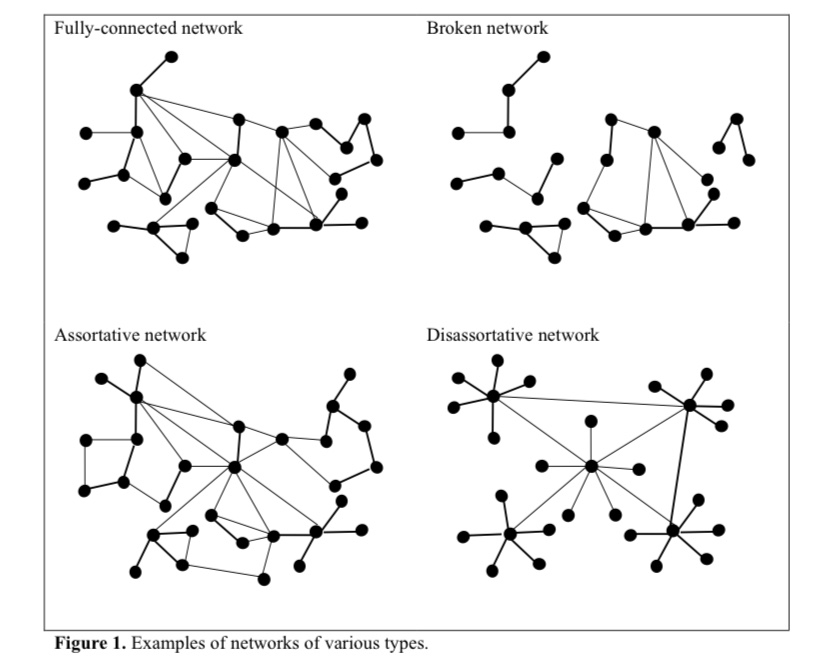
Sub-herd members tend to have more degrees of separation from individuals in other sub-herds than within their own sub-herd. The most extreme example is the “broken network” (where contagions could not spread across sub-herds), but there are identifiable sub-herds in all of the examples shown above. Less average connectedness across sub-herds implies barriers to transmission and more isolated sub-herd contagions.

We’ve seen isolated spikes in cases in different geographies, and there have been spikes within geographies among sub-herds of individuals sharing commonalities such as race, religious affiliation, industry affiliation, school, or other cultural affiliation. Furthermore, transmission of COVID has been dominated by “super-spreader” events, which tend to occur within sub-herds. In fact, sub-herds are likely to be more homogeneous than the whole of society, and that means their HIT will be higher than we might naively calculate based on higher levels of aggregation.

We have seen local, state, or regional contagions peak and turn down when estimates of total incidence of infections reach the range of 15 – 25%. That appears to have been enough to reach the HIT in those geographically isolated cases. However, if those geographical contagions were also concentrated within social sub-herds, those sub-herds might have experienced much higher than 25% incidence by the time new infections peaked. Again, the HIT for sub-herds is likely to be greater than the aggregate population estimates implied, The upshot is that some sub-herds might have achieved herd immunity last year but others did not, which explains the spikes in new geographic areas and even the recurrence of spikes within geographic areas.

Conclusion

It’s unnecessary for 100% of the population to be vaccinated or to have pre-existing immunity. Likewise, herd immunity does not imply that no one catches the virus or that no one dies from the virus. There will be seasonal waves, though muted by the large immune share of the population. This is not something that government should try to stanch, as that would require the kind of coercion and scare tactics we’ve already seen overplayed during the pandemic. People face risks in almost everything they do, and they usually feel competent to evaluate those risks themselves. That is, until a large segment of the population allows themselves to be infantalized by public health authorities.

COVID Now: Turning Points, Vaccines, and Mutations

20 Wednesday Jan 2021

Posted by pnoetx in Coronavirus, Pandemic, Vaccinations

≈ Leave a comment

Tags

Alex Tabarrok, Case Fatality Rate, CDC, CLI, Convalescent Plasma, Covid-19, COVID-Like Illness, Date of Death, Herd Immunity, Herd Immunity Threshold, Infection Fatality Rate, Ivermectin, Johns Hopkins, Monoclonal Antibodies, Phil Kerpen, Provisional Deaths, South African Strain, UK Strain, Vaccinations, Youyang Gu

The pandemic outlook remains mixed, primarily due to the slow rollout of the vaccines and the appearance of new strains of the virus. Nationwide, cases and COVID deaths rose through December. Now, however, there are several good reasons for optimism.

The fall wave of the coronavirus receded in many states beginning in November, but the wave started a bit later in the eastern states, in the southern tier of states, and in California. It appears to have crested in many of those states in January, even after a post-holiday bump in new diagnoses. As of today, Johns Hopkins reports only two states with increasing trends of new cases over the past two weeks: NH and VA, while CT and WY were flat. States shaded darker green have had larger declines in new cases.

A more detailed look at WY shows something like a blip in January after the large decline that began in November. Trends in new cases have clearly improved across the nation, though somewhat later than hoped.

While the fall wave has taken many lives, we can take some solace in the continuing decline in the case fatality rate. (This is not the same as the infection mortality rate (IFR), which has also declined. The IFR is much lower, but more difficult to measure). The CFR fell by more than half from its level in the late summer. In other words, without that decline, deaths today would be running twice as high.

Some of the CFR’s decline was surely due to higher testing levels. However, better treatments are reducing the length of hospital stays for many patients, as well as ICU admittance and deaths relative to cases. Monoclonal antibodies and convalescent plasma have been effective for many patients, and now Ivermectin is showing great promise as a treatment, with a 75% reduction in mortality according to the meta-analysis at the link.

Reported or “announced” deaths remain high, but those reports are not an accurate guide to the level or trend in actual deaths as they occur. The CDC’s provisional death reports give the count of deaths by date of death (DOD), shown below. The most recent three to four weeks are very incomplete, but it appears that actual deaths by DOD may have peaked as early as mid-December, as I speculated they might last month. Another noteworthy point: by the totals we have thus far, actual deaths peaked at about 17,000 a week, or just over 2,400 a day. This is substantially less than the “announced” deaths of 4,000 or more a day we keep hearing. The key distinction is that those announced deaths were actually spread out over many prior weeks.

A useful leading indicator of actual deaths has been the percentage of ER patients presenting COVID-like illness (CLI). The purple dots in the next CDC chart show a pronounced decline in CLI over the past three weeks. This series has been subject to revisions, which makes it much less trustworthy. A less striking decline in late November subsequently disappeared. At the time, however, it seemed to foretell a decline in actual deaths by mid-December. That might actually have been the case. We shall see, but if so, it’s possible that better therapeutics are causing the apparent CLI-deaths linkage to break down.

A more recent concern is the appearance of several new virus strains around the world, particularly in the UK and South Africa. The UK strain has reached other countries and is now said to have made appearances in the U.S. The bad news is that these strains seem to be more highly transmissible. In fact, there are some predictions that they’ll account for 30% of new cases by the beginning of March. The South African strain is said to be fairly resistant to antibodies from prior infections. Thus, there is a strong possibility that these cases will be additive, and they might or might not speedily replace the established strains. The good news is that the new strains do not appear to be more lethal. The vaccines are expected to be effective against the UK strain. It’s not yet clear whether new versions of the vaccines will be required against the South African strain by next fall.

Vaccinations have been underway now for just over a month. I had hoped that by now they’d start to make a dent in the death counts, and maybe they have, but the truth is the rollout has been frustratingly slow. The first two weeks were awful, but as of today, the number of doses administered was over 14 million, or almost 46% of the doses that have been delivered. Believe it or not, that’s an huge improvement!

About 4.3% of the population had received at least one dose as of today, according to the CDC. I have no doubt that heavier reliance on the private sector will speed the “jab rate”, but rollouts in many states have been a study in ineptitude. Even worse, now a month after vaccinations began, the most vulnerable segment of the population, the elderly, has received far less than half of the doses in most states. The following table is from Phil Kerpen. Not all states are reporting vaccinations by age group, which might indicate a failure to prioritize those at the greatest risk.

It might not be fair to draw strong conclusions, but it appears WV, FL, IN, AK, and MS are performing well relative to other states in getting doses to those most at risk.

Even with the recent increase in volume, the U.S. is running far behind the usual pace of annual flu vaccinations. Each fall, those average about 50 million doses administered per month, according to Alex Tabarrok. He quotes Youyang Gu, an AI forecaster with a pretty good track record thus far, on the prospects for herd immunity and an end to the pandemic. However, he uses the term “herd immunity” as the ending share of post-infected plus vaccinated individuals in the population, which is different than the herd immunity threshold at which new cases begin to decline. Nevertheless, in Tabarrok’s words:

“… the United States will have reached herd immunity by July, with about half of the immunity coming from vaccinations and half from infections. Long before we reach herd immunity, however, the infection and death rates will fall. Gu is projecting that by March infections will be half what they are now and by May about one-tenth the current rate. The drop will catch people by surprise just like the increase. We are not good at exponentials. The economy will boom in Q2 as infections decline.”

That sounds good, but Tabarrok also quotes a CDC projection of another 100,000 deaths by February. That’s on top of the provisional death count of 340,000 thus far, which runs 3-4 weeks behind. If we have six weeks of provisionals to go before February, with actual deaths at their peak of about 17,000 per week, we’ll get to 100,000 more actual deaths by then. For what it’s worth, I think that’s pessimistic. The favorable turns already seen in cases and actual deaths, which I believe are likely to persist, should hold fatalities below that level, and the vaccinations we’ve seen thus far will help somewhat.

Let’s Do “First Doses First”

06 Wednesday Jan 2021

Posted by pnoetx in Coronavirus, Vaccinations

≈ Leave a comment

Tags

Alex Tabarrok, Covid-19, FDA, First Doses First, Herd Immunity, Herd Immunity Threshold, Moderna, Operation Warp Speed, Pfizer, Phil Kerpen, Vaccines

Both the Pfizer and the Moderna COVID vaccines require two doses, with an effectiveness of about 95%. But a single dose may have an efficacy of about 80% that is likely to last over a number of weeks without a second dose. There are varying estimates of short-term efficacy, and but see here, here, and here. The chart above is for the Pfizer vaccine (red line) relative to a control group over days since the first dose, and the efficacy grows over time relative to the control before a presumed decay ever sets in.

Unfortunately, doses are in short supply, and getting doses administered has proven to be much more difficult than expected. “First Doses First” (FDF) is a name for a vaccination strategy focusing on delivering only first doses until a sufficient number of the highly vulnerable receive one. After that, second doses can be administered, perhaps within some maximum time internal such as 8 – 12 weeks. FDF doubles the number of individuals who can be vaccinated in the short-term with a given supply of vaccine. Today, Phil Kerpen posted this update on doses delivered and administered thus far:

Dosing has caught up a little, but it’s still lagging way behind deliveries.

As Alex Tabbarok points out, FDF is superior strategy because every two doses create an average of 1.6 immune individuals (2 x 0.8) instead of just 0.95 immune individuals. His example involves a population of 300 million, a required herd immunity level of two-thirds (higher than a herd immunity threshold), and an ability to administer 100 million doses per month. Under a FDF regime, you’ve reached Tabarrok’s “herd immunity” level in two months. (This is not to imply that vaccination is the only contributor to herd immunity… far from it!) Under the two-dose regime, you only get halfway there in that time. So FDF means fewer cases, fewer deaths, shorter suspensions of individual liberty, and a faster economic recovery.

An alternative that doubles the number of doses available is Moderna’s half-dose plan. Apparently, their tests indicate that half doses are just as effective as full doses, and they are said to be in discussions with the FDA and Operation Warp Speed to implement the half-dose plan. But the disadvantage of the half-dose plan relative to FDF is that the former does not help to overcome the slow speed with which doses are being administered.

Vaccine supplies are bound to increase dramatically in coming months, and the process of dosing will no doubt accelerate as well. However, for the next month or two, FDF is too sensible to ignore. While I am not a fan of all British COVID policies, their vaccination authorities have recommended an FDF approach as well as allowing different vaccines for first and second doses.

Auspicious COVID News for Thanksgiving

25 Wednesday Nov 2020

Posted by pnoetx in Coronavirus, Herd Immunity

≈ 1 Comment

Tags

Covid-19, COVID-LIke-Illness, Deaths by Date-of-Death, Flu Season, Herd Immunity, Herd Immunity Threshold, Influenza-Like Illness, Latitude, New Cases, Reproduction Rate, Seasonality, Seroprevalence

There are some hints of good news on the spread of the coronavirus in a few of the “hot spots“ that developed this fall. This could be very good news, but it’s a bit too early to draw definitive conclusions.

The number of new cases plateaued in Europe a few weeks ago. Of course, Europe’s average latitude is higher than in most of the U.S., and the seasonal spread began there a little earlier. It makes sense that it might ebb there a bit sooner than in the U.S. as well.

In the U.S., cases shot up in the upper Midwest four to six weeks ago, depending on the state. Now, however, new cases have turned down in Iowa, Nebraska, North Dakota, South Dakota, and Wisconsin (first chart below), and they appear to have plateaued in Illinois, Kansas, Minnesota, and Missouri (second chart below, but ending a few days earlier). These are the hottest of the recent hot states.

These plateaus and declines were preceded by a decline in the growth rates of new cases around 10 days ago, shown below.

The timing of these patterns roughly correspond to the timing of the spread in other regions earlier in the year. It’s been suggested that after seroprevalence reaches levels of around 15% – 25% that individuals with new antibodies, together with individuals having an existing pre-immunity from other coronaviruses, is enough to bring the virus reproduction rate (R) to a value of one or less. That means a breach of the effective herd immunity threshold. It’s possible that many of these states are reaching those levels. Of course, this is very uncertain, but the patterns are certainly encouraging.

Deaths lag behind new infections, and it generally takes several weeks before actual deaths by date-of-death are known with any precision. However, we might expect deaths to turn down within two to three weeks.

Deaths by date-of-death are strongly associated with emergency room patients from three weeks prior who presented symptoms of COVID-like illness (CLI) or influenza-like illness ((ILI). The following chart shows CLI and ILI separately for the entire U.S. (ILI is the lowest dashed line), but the last few observations of both series, after a peak on November 15th, suggest a downturn in CLI + ILI. If the relationship holds up, actual U.S. deaths by date-of-death should peak around December 7th, though we won’t know precisely until early in the new year.

As a side note, it continues to look like the flu season will be exceptionally mild this year. See the next chart. That’s tremendous because it should take some of the normal seasonable pressure off health care resources.

So Happy Thanksgiving!

-————————————————

Note: I saved all those charts over the last few days but lost track of the individual sources on Twitter. I’m too lazy and busy to go back and search through Twitter posts, so instead I’ll just list a few of my frequent sources here with links to recent posts, which are not necessarily apropos of the above: Don Wolt, Justin Hart, AlexL, The Ethical Skeptic, Aaron Ginn, and HOLD2.

COVID Immunity, Herd By Herd

01 Tuesday Sep 2020

Posted by pnoetx in Coronavirus, Herd Immunity

≈ Leave a comment

Tags

Antibodies, Coronavirus, Herd Immunity, Herd Immunity Threshold, Heterogeneity, Immunological Dark Matter, Infectives, Kyle Lamb, Miami, Seroprevalence, SIR Models, Stockholm New York City, Susceptibility, T-Cell Immunity, Transmissability, Yinon Weiss

Too many public health authorities remain in denial, but epidemiologists are increasingly convinced that heterogeneity implies a coronavirus herd immunity threshold (HIT) that is greatly reduced from traditional models and estimates. HIT is the share of the population that must be infected before the contagion begins to recede (and the transmission ratio R falls below one). Traditional models, based on three classes of individuals (Susceptibles, Infectives, and Recovered – SIR), predict a HIT of 60% or more. However, models that incorporate variation in susceptibility, transmissibility, and occupational or social behavior reduce the HIT substantially. Many of these more nuanced models show that the HIT could be in a range of just 15% to 25%. If that is the case, many regions are already there!

For background, I refer you to the first post I wrote about heterogeneity in late March, more detailed thoughts from early May, examples and more information on the literature later in May. I’ve referenced it repeatedly in other posts since then. And now, more than five months later, even the slow kids at the New York Times have noticed. The gist of it: if not everyone is equally susceptible, for example, a smaller share of the population needs to be “immunized via infection” to taper the spread of the virus.

Some supporting evidence appears in the charts below, courtesy of Kyle Lamb on Twitter. The first chart shows a seven-day average of C19 cases per million of population for ten states that reached an estimated 10% antibodies. These antibodies confer at least short-term immunity against C19. Most of these states saw cases/m climb at least through the day when the 10% level was reached, though Rhode Island appears to have been an exception.

The second chart shows the seven-day average of cases/m in the same states starting seven days after the 10% immunity level was reached. I’d prefer to see the days in the interim as well, but the changes in trend are still noteworthy. All of these states except Louisiana had a downturn in the seven-day average of new cases within a few weeks of breaching the 10% infection level (Louisiana had distinct and non-coincident outbreaks in different parts of the state). These striking similarities suggest that things turned as the infection level reached 15% or more, consistent with many of the epidemiological models incorporating heterogeneity.

Next, take a look at the states in which C19 surged most severely this summer. The new cases are not moving averages, so the charts are not quite comparable to those above. However, the peaks seem to occur prior to the breach of the 15% infection level.

Speculation about early herd immunity has been going on for several months with respect to various countries and even more “micro” settings such as cruise ships and military vessels, where populations are completely isolated. Early on, this “early” herd immunity was discussed under the aegis of “immunological dark matter”, but we know now that T-cell immunity has played an important role. In any case, anti-body expression (or seroprevalence) at around 20% has been linked to reversals in C19 cases and deaths in several countries. As Yinon Weiss notes, New York City and Stockholm were both C19 hotspots in the spring, both have seen deaths decline to low levels, and they have little in common in terms of public health policy. London as well. The one thing they share are similar levels of seroprevalence.

An important qualification is that herd immunity is not relevant at high levels of aggregation. That is, herd immunity won’t be achieved simultaneously in all regions. The New York City metro area might have reached its HIT in April, but Florida (or perhaps only Miami) might have reached a HIT in July. Many areas of the Midwest probably still aren’t there.

In the absence of a new mutation of C19, the final proof of herd immunity in many of the former hotspots will be in the fall and winter. We should expect at least a few cases in those areas, but if there are more intense contagions, they should be confined to areas that have not yet seen a level of seroprevalence near 15%.

COVID Seasonality and Latitudes

23 Sunday Aug 2020

Posted by pnoetx in Pandemic

≈ 2 Comments

Tags

Air Conditioning, Antibodies, Antigenic Drift, Bimodal, Coronavirus, Covid-19, Ethical Skeptic, Heidi J Zapata, Herd Immunity, Herd Immunity Threshold, Humidity, Immune Response, Justin Hart, Latitude and Seasonality, Proofreading enzymes, Robert Edgar Hope-Simpson, SARS, SARS-CoV-2, Seasonality, Sunlight, T-Cell Immunity, Temperature, Tropical Latitudes, Viral Load, Viral Mutation, Vitamin D Deficiency

The coronavirus (C19), or SARS-CoV-2, has a strong seasonal component that appears to closely match that of earlier SARS viruses as well as seasonal influenza. This includes the two distinct caseloads we’ve experienced in the U.S. 1) in the late winter/early spring; and 2) the smaller bump we witnessed this summer in some southern states and tropics. 

COVID Seasonal Patterns and Latitude

The Ethical Skeptic on Twitter recently featured the chart below. It shows the new case count of C19 in the U.S. in the upper panel, and the 2003 SARS virus in the lower panel. Both viruses had an initial phase at higher latitudes and a summer rebound at lower latitudes.


I particularly like the following visualizations from Justin Hart demonstrating the pandemic’s pattern at different latitudes (shown in the leftmost column). The first table shows total cases by week of 2020. The second shows deaths per 100,000 of population by week. Again, notice that lower latitudes have had a crest in the contagion this summer, while higher latitudes suffered the worst of their contagion in the spring. Based on deaths in the second table, the infections at lower latitudes have been less severe.

Viral Patterns in the South

Many expected the pandemic to abate this summer, including me, as it is well known that viruses don’t thrive in higher temperatures and humidity levels, and in more direct sunlight. So it is a puzzle that southern latitudes experienced a surge in the virus during the warmest months of the year. True, the cases were less severe on average, and sunlight and humidity likely played a role in that, along with the marked reduction in the age distribution of cases. However, the SARS pandemic of 2003 followed the same pattern, and the summer surge of C19 at southern latitudes was quite typical of viruses historically.

A classic study of the seasonality of viruses was published in 1981 by Robert Edgar Hope-Simpson. The next chart summarized his findings on influenza, seasonality, and latitude based on four groups of latitudes. Northern and southern latitudes above 30° are shown in the top and bottom panels, respectively. Both show wintertime contagions with few infections during the summer months. Tropical regions are different, however. The second and third panels of the chart show flu infections at latitudes less than 30°. Influenza seems to lurk at relatively low levels through most of the year in the tropics, but the respective patterns above and below the equator look almost like very muted versions of activity further to the north and south. However, some researchers describe the tropical pattern as bimodal, meaning that there are two peaks over the course of a year.   

So the “puzzle” of the summer surge at low latitudes appears to be more of an empirical regularity. But what gives rise to this pattern in the tropics, given that direct sunlight, temperature, and humidity subdue viral activity?

There are several possible explanations. One is that the summer rainy season in the tropics leads to less sunlight as well as changes in behavior: more time spent indoors and even less exposure to sunlight. In fact, today, in tropical areas where air conditioning is more widespread, it doesn’t have to be rainy to bring people indoors, just hot. Unfortunately, air conditioning dries the air and creates a more hospitable environment for viruses. Moreover, low latitudes are populated by a larger share of dark-skinned peoples, who generally are more deficient in vitamin D. That might magnify the virulence associated with the flight indoors brought on by hot and or rainy weather.   

Mutations and Seasonal Patterns

What makes the seasonal patterns noted above so reliable in the face of successful immune responses by recovered individuals? And shouldn’t herd immunity end these seasonal repetitions? The problem is the flu is highly prone to viral mutation, having segments of genes that are highly interchangeable (prompting so-called “antigenic drift“). That’s why flu vaccines are usually different each year: they are customized to prompt an immune response to the latest strains of the virus. Still, the power of these new viral strains are sufficient to propagate the kinds of annual flu cycles documented by Hope-Simpson.

With C19, we know there have been up to 100 mutations, mostly quite minor. Two major strains have been dominant. The first was more common in Southeast Asia near the beginning of the pandemic. It was less virulent and deadly than the strain that hit much of Europe and the U.S. Of course, in July the media misrepresented this strain as “new”, when in fact it had become the most dominant strain back in March and April.

What Lies Ahead

By now, it’s possible that the herd immunity threshold has been surpassed in many areas, which means that a surge this coming fall or winter would be limited to a smaller subset of still-susceptible individuals. The key question is whether C19 will be prone to mutations that pose new danger. If so, it’s possible that the fall and winter will bring an upsurge in cases in northern latitudes both among those still susceptible to existing strains, and to the larger population without immune defenses against new strains.

Fortunately, less dangerous variants are more more likely to be in the interest of the virus’ survival. And thus far, despite the number of minor mutations, it appears that C19 is relatively stable as viruses go. This article quotes Dr. Heidi J. Zapata, an infectious disease specialist and immunologist at Yale, who says that C19:

“… has shown to be a bit slow when it comes to accumulating mutations … Coronaviruses are interesting in that they carry a protein that ‘proofreads’ [their] genetic code, thus making mutations less likely compared to viruses that do not carry these proofreading proteins.”

The flu, however, does not have such a proofreading enzyme, so there is little to check its prodigious tendency to mutate. Ironically, C19’s greater reliability in producing faithful copies of itself should help ensure more durable immunity among those already having acquired defenses against C19.

This means that C19 might not have a strong seasonal resurgence in the fall and winter. Exceptions could include: 1) the remaining susceptible population, should they be exposed to a sufficient viral load; 2) regions that have not yet reached the herd immunity threshold; and 3) the advent of a dangerous new mutation, though existing T-cell immunity may effectively cross-react to defend against such a mutation in many individuals.


Evidence of Fading COVID Summer Surge

16 Sunday Aug 2020

Posted by pnoetx in Pandemic

≈ Leave a comment

Tags

CDC, CLI, Covid Tracking Project, Covid-19, COVID-Like Illness, Date of Death, FEMA, FEMA Regions, Herd Immunity Threshold, Hospitalizations, Kyle Lamb, PCR Test, Percent Positive, Provisional Deaths

Lately I’ve talked a lot about reported deaths each week versus deaths by actual date of death (DOD). Much of that information came from Kyle Lamb’s Twitter account, and he’s the source of the charts below as well. The first one provides a convenient summary of the data reported through last week. The blue bars are reported deaths each week from the COVID Tracking Project (CTP), which are an aggregation of deaths that actually occurred over previous weeks. Again, the blue bars do NOT represent deaths that occurred in the reporting week. The solid orange bars are “provisional” actual deaths by DOD. “Provisional” means that recent weeks are not complete, though most deaths by DOD are captured within three to four weeks. The CDC also produces a “forecast” of final death counts by DOD, shown by the hatched orange bars.   

Note that the recent surge in deaths has been much smaller than the one in the spring, which was driven by deaths in the northeast. The CDC “expects” actual deaths by DOD to have declined starting after the week of July 23rd. However, CTP was still reporting deaths of over 1,000 per day last week. The actual timing of those deaths in prior weeks, and the ultimate extent of the summer surge in COVID deaths, remains to be seen.

Certain leading indicators of deaths are signaling declines in actual deaths in August. Two of those indicators are 1) the positivity rate on standard PCR tests for infections; and 2) the share of emergency room visits made for symptoms of “COVID Like Illness” (CLI). The charts below show those indicators for FEMA regions that had the largest uptrends in cases in June and July. Florida is part of Region 4, shown in the next chart:

Here is the Region 6, which includes Texas:

Finally, Region 8 includes Arizona and California:

Out of personal interest, I’m also throwing in Region 7 with a few midwestern states, where cases have risen but not to the levels reached in Regions 4, 6, and 8:

With the exception of the last chart, the clear pattern is a peak or plateau in the positivity rate in late June through late July, followed by declines in subsequent weeks. The share or ER visits for CLI was not quite coincident with the positivity rate, but close. The decline in the CLI share is evident in Regions 4, 6 and 8. Again, these three regions include states that drove the nationwide increase in cases this summer (AZ, CA, FL, and TX), and the surge appears to have maxed out.     

Here is a chart showing the share of CLI visits to ERs for all ten FEMA region from mid-June through last week. Clearly, this measure is improving across the U.S.

Nationwide, the CLI percentage at ERs has decreased by about 47% over the past four weeks, and the positivity rate has decreased by about 28% in that time. In addition to these favorable trends, COVID hospitalizations have decreased by about 40% over the past three weeks. All of these trends bode well for a downturn in COVID-attributed deaths.

The summertime surge in the virus was not nearly as ravaging as in the spring, and it appears to be fading. We’ll await developments in the fall, but we’ve come a long way in terms of protecting the vulnerable, treating the infected, approaching herd immunity thresholds (which means reduced rates of transmission to susceptible individuals), and the real possibility that we can put the pandemic behind us. 

Follow Sacred Cow Chips on WordPress.com

Recent Posts

  • The Fed’s Balance Sheet: What’s the Big Deal?
  • Collectivism Is Not the “Natural” State
  • Social Insurance, Trust Fund Runoff, and Federal Debt
  • Critical Gender Theory and Trends in Gender Identity
  • Markets Deal With Scarcity, Left Screams “Price Gouging”

Archives

  • May 2022
  • April 2022
  • March 2022
  • February 2022
  • January 2022
  • December 2021
  • November 2021
  • October 2021
  • September 2021
  • August 2021
  • July 2021
  • June 2021
  • May 2021
  • April 2021
  • March 2021
  • February 2021
  • January 2021
  • December 2020
  • November 2020
  • October 2020
  • September 2020
  • August 2020
  • July 2020
  • June 2020
  • May 2020
  • April 2020
  • March 2020
  • February 2020
  • January 2020
  • December 2019
  • November 2019
  • October 2019
  • September 2019
  • August 2019
  • July 2019
  • June 2019
  • May 2019
  • April 2019
  • March 2019
  • February 2019
  • January 2019
  • December 2018
  • November 2018
  • October 2018
  • September 2018
  • August 2018
  • July 2018
  • June 2018
  • May 2018
  • April 2018
  • March 2018
  • February 2018
  • January 2018
  • December 2017
  • November 2017
  • October 2017
  • September 2017
  • August 2017
  • July 2017
  • June 2017
  • May 2017
  • April 2017
  • March 2017
  • February 2017
  • January 2017
  • December 2016
  • November 2016
  • October 2016
  • September 2016
  • August 2016
  • July 2016
  • June 2016
  • May 2016
  • April 2016
  • March 2016
  • February 2016
  • January 2016
  • December 2015
  • November 2015
  • October 2015
  • September 2015
  • August 2015
  • July 2015
  • June 2015
  • May 2015
  • April 2015
  • March 2015
  • February 2015
  • January 2015
  • December 2014
  • November 2014
  • October 2014
  • September 2014
  • August 2014
  • July 2014
  • June 2014
  • May 2014
  • April 2014
  • March 2014

Blogs I Follow

  • Passive Income Kickstart
  • OnlyFinance.net
  • TLC Cholesterol
  • Nintil
  • kendunning.net
  • DCWhispers.com
  • Hoong-Wai in the UK
  • Marginal REVOLUTION
  • CBS St. Louis
  • Watts Up With That?
  • Aussie Nationalist Blog
  • American Elephants
  • The View from Alexandria
  • The Gymnasium
  • Public Secrets
  • A Force for Good
  • ARLIN REPORT...................walking this path together
  • Notes On Liberty
  • troymo
  • SUNDAY BLOG Stephanie Sievers
  • Miss Lou Acquiring Lore
  • Your Well Wisher Program
  • Objectivism In Depth
  • RobotEnomics
  • Orderstatistic

Blog at WordPress.com.

Passive Income Kickstart

OnlyFinance.net

Financial Matters!

TLC Cholesterol

Nintil

To estimate, compare, distinguish, discuss, and trace to its principal sources everything

kendunning.net

The future is ours to create.

DCWhispers.com

Hoong-Wai in the UK

A Commonwealth immigrant's perspective on the UK's public arena.

Marginal REVOLUTION

Small Steps Toward A Much Better World

CBS St. Louis

News, Sports, Weather, Traffic and St. Louis' Top Spots

Watts Up With That?

The world's most viewed site on global warming and climate change

Aussie Nationalist Blog

Commentary from a Paleoconservative and Nationalist perspective

American Elephants

Defending Life, Liberty and the Pursuit of Happiness

The View from Alexandria

In advanced civilizations the period loosely called Alexandrian is usually associated with flexible morals, perfunctory religion, populist standards and cosmopolitan tastes, feminism, exotic cults, and the rapid turnover of high and low fads---in short, a falling away (which is all that decadence means) from the strictness of traditional rules, embodied in character and inforced from within. -- Jacques Barzun

The Gymnasium

A place for reason, politics, economics, and faith steeped in the classical liberal tradition

Public Secrets

A 93% peaceful blog

A Force for Good

How economics, morality, and markets combine

ARLIN REPORT...................walking this path together

PERSPECTIVE FROM AN AGING SENIOR CITIZEN

Notes On Liberty

Spontaneous thoughts on a humble creed

troymo

SUNDAY BLOG Stephanie Sievers

Escaping the everyday life with photographs from my travels

Miss Lou Acquiring Lore

Gallery of Life...

Your Well Wisher Program

Attempt to solve commonly known problems…

Objectivism In Depth

Exploring Ayn Rand's revolutionary philosophy.

RobotEnomics

(A)n (I)ntelligent Future

Orderstatistic

Economics, chess and anything else on my mind.

  • Follow Following
    • Sacred Cow Chips
    • Join 120 other followers
    • Already have a WordPress.com account? Log in now.
    • Sacred Cow Chips
    • Customize
    • Follow Following
    • Sign up
    • Log in
    • Report this content
    • View site in Reader
    • Manage subscriptions
    • Collapse this bar
 

Loading Comments...