• About

Sacred Cow Chips

Sacred Cow Chips

Tag Archives: Our World In Data

Sweden’s Pandemic Policy: Arguably Best Practice

14 Monday Nov 2022

Posted by Nuetzel in Health Care, Pandemic

≈ Leave a comment

Tags

Anders Tegnell, Closures, Coronavirus, Covid-19, Deaths of Despair, European Economic Area, Excess Deaths, Joakim Book, Johan Giesecke, Latitude, Lockdowns, Non-Pharmaceutical interventions, Nordic, NPIs, Our World In Data, Oxford Stringency Index, Pandemic, Quarantines, Sweden, Vitamin D

When Covid-19 began its awful worldwide spread in early 2020, the Swedes made an early decision that ultimately proved to be as protective of human life as anything chosen from the policy menu elsewhere. Sweden decided to focus on approaches for which there was evidence of efficacy in containing respiratory pandemics, not mere assertions by public health authorities (or anyone else) that stringent non-pharmaceutical interventions (NPIs) were necessary or superior.

The Swedish Rationale

The following appeared in an article in Stuff in late April, 2020,

“Professor Johan Giesecke, who first recruited [Sweden’s State epidemiologist Anders] Tegnell during his own time as state epidemiologist, used a rare interview last week to argue that the Swedish people would respond better to more sensible measures. He blasted the sort of lockdowns imposed in Britain and Australia and warned a second wave would be inevitable once the measures are eased. ‘… when you start looking around at the measures being taken by different countries, you find very few of them have a shred of evidence-base,’ he said.

Giesecke, who has served as the first Chief Scientist of the European Centre for Disease Control and has been advising the Swedish Government during the pandemic, told the UnHerd website there was “almost no science” behind border closures and school closures and social distancing and said he looked forward to reviewing the course of the disease in a year’s time.”

Giesecke was of the opinion that there would ultimately be little difference in Covid mortality across countries with different pandemic policies. Therefore, the least disruptive approach was to be preferred. That meant allowing people to go about their business, disseminating information to the public regarding symptoms and hygiene, and attempting to protect the most vulnerable segments of the population. Giesecke said:

“I don’t think you can stop it. It’s spreading. It will roll over Europe no matter what you do.”

He was right. Sweden had a large number of early Covid deaths primarily due to its large elderly population as well as its difficulty in crafting effective health messages for foreign-speaking immigrants residing in crowded enclaves. Nevertheless, two years later, Sweden has posted extremely good results in terms of excess deaths during the pandemic.

Excess Deaths

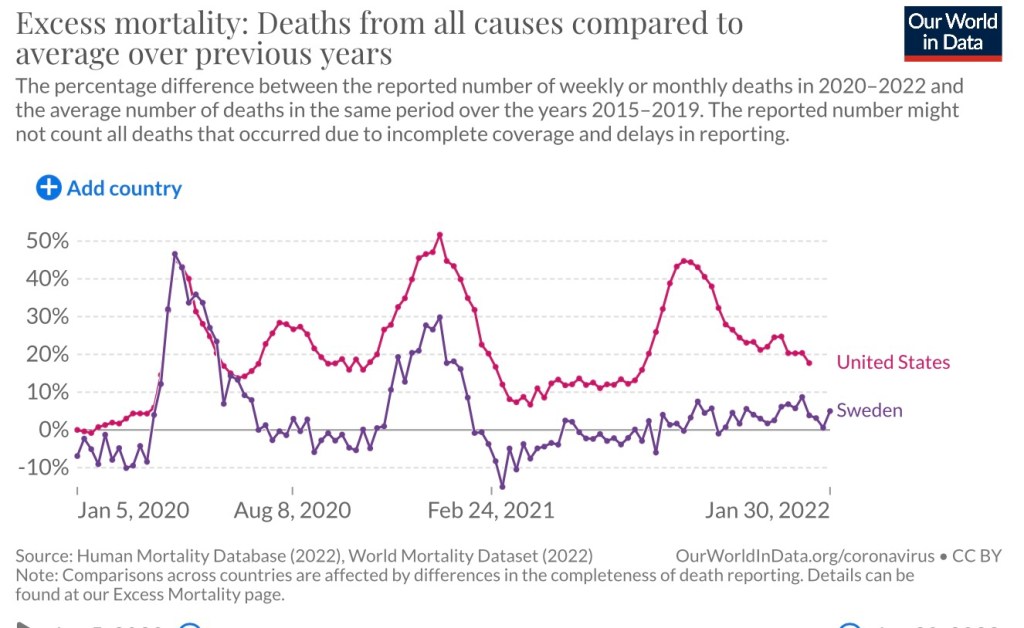
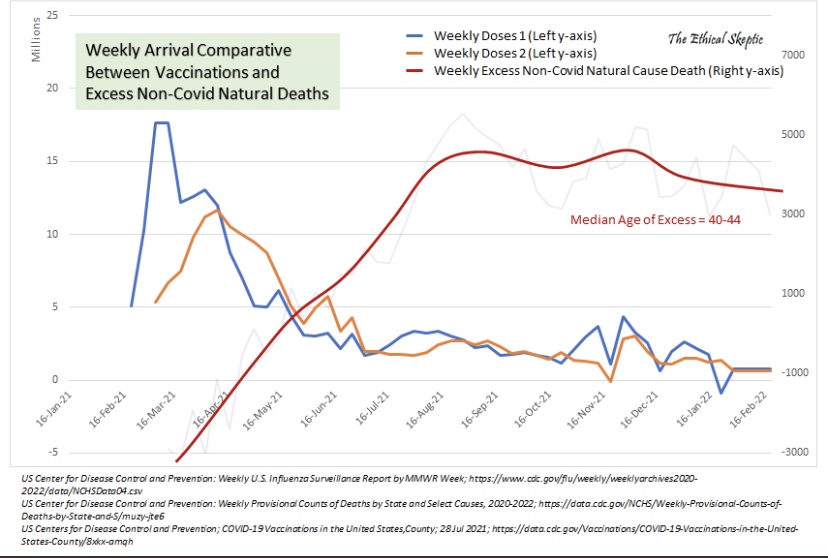
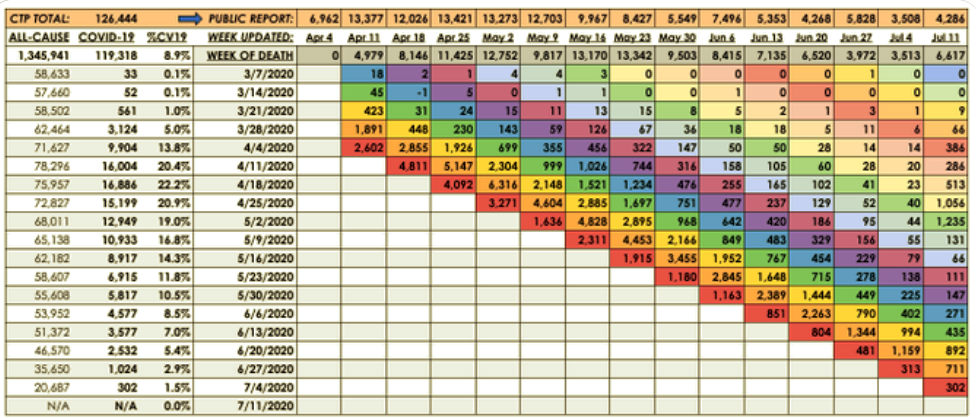
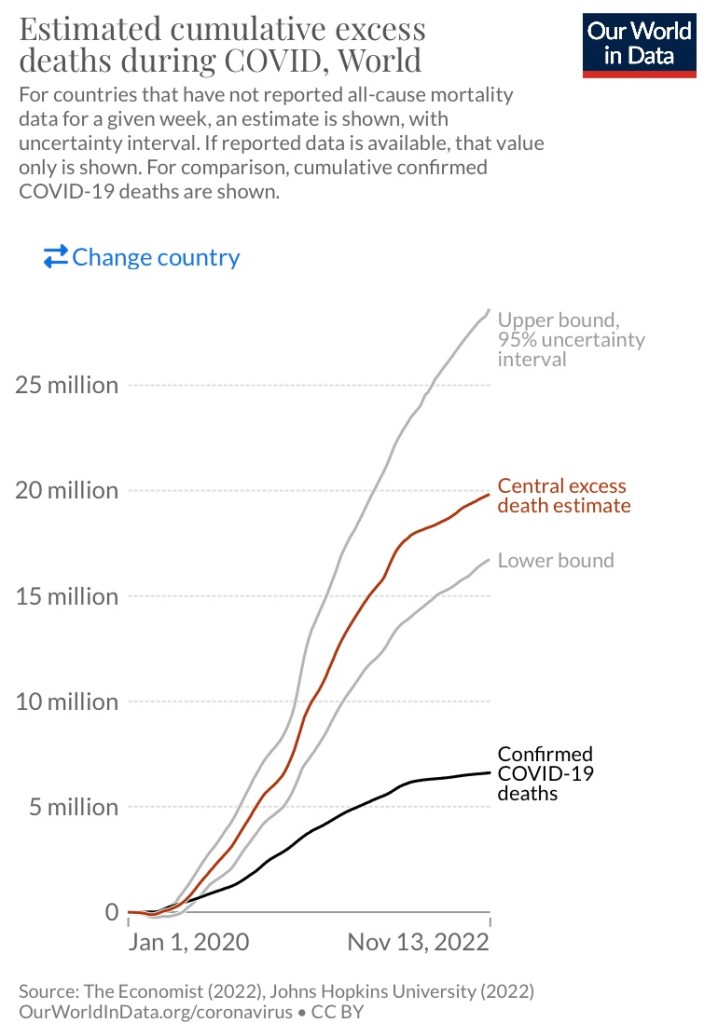
Excess deaths, or deaths relative to projections based on historical averages, are a better metric than Covid deaths (per million) for cross-country or jurisdictional comparisons. Among other reasons, the latter are subject to significant variations in methods of determining cause of death. Moreover, there was a huge disparity between excess deaths and Covid deaths during the pandemic, and the gap is still growing:

Excess deaths varied widely across countries, as illustrated by the left-hand side of the following chart:

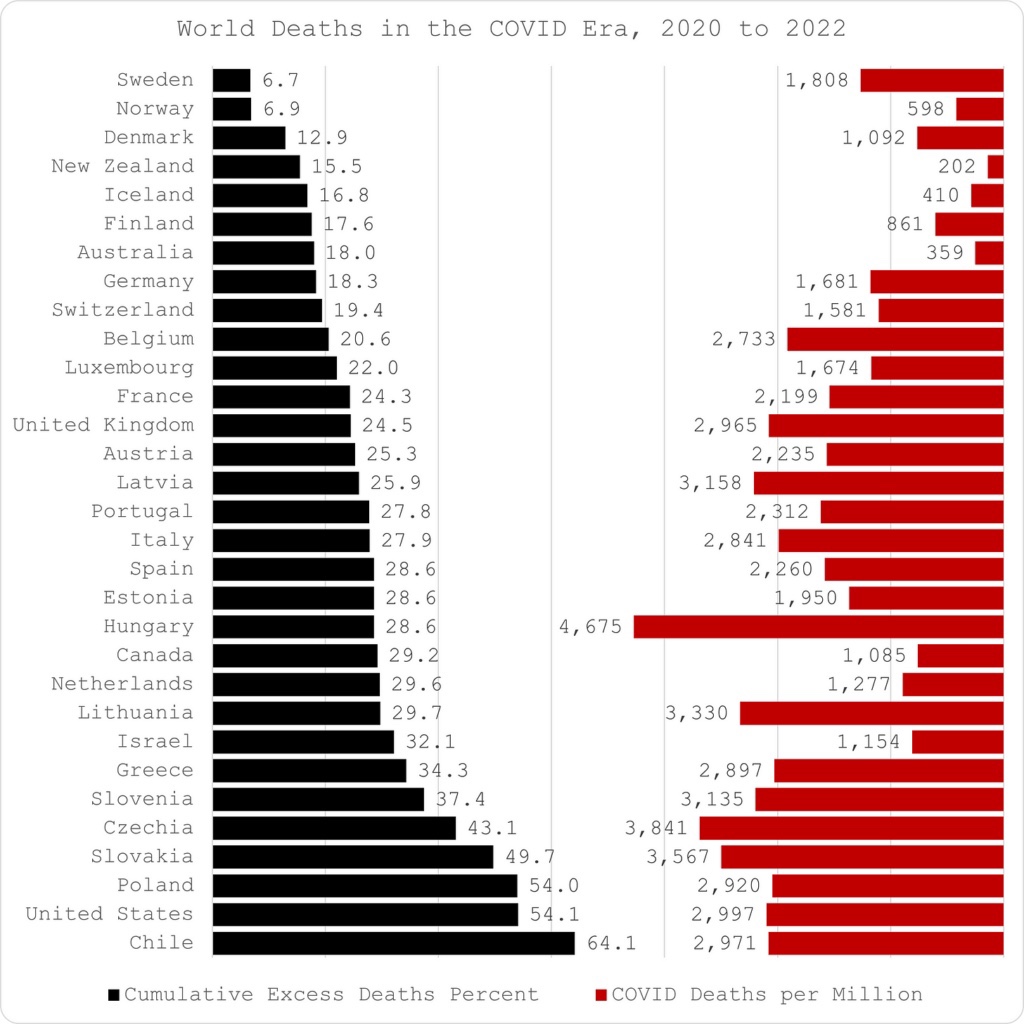
Interestingly, most of the lowest excess death percentages were in Nordic countries, but especially Sweden and Norway. That might be surprising in terms of high Nordic latitudes, which may have created something of a disadvantage in terms of sun exposure and potentially low vitamin D levels. Norway enacted more stringent public policies during the pandemic than Sweden. Globally, however, lockdown measures showed no systematic advantage in terms of excess deaths. Notably, the U.S. did quite poorly in terms of excess deaths at 8X the Swedish rate,
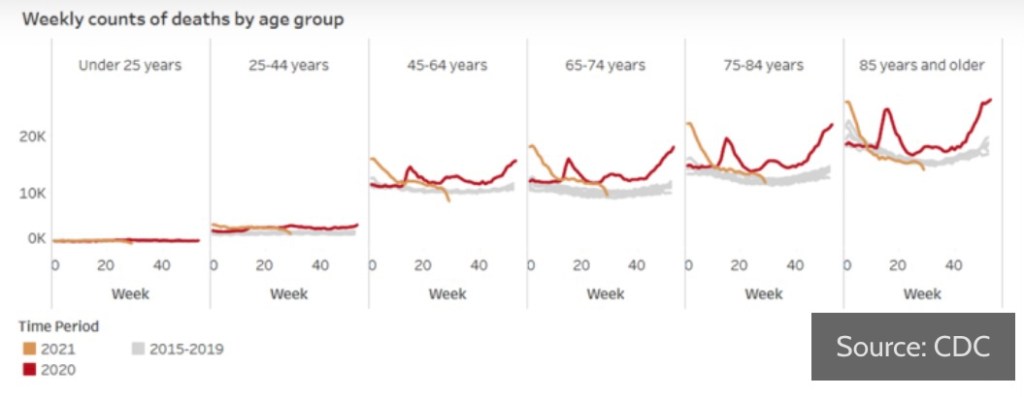
Covid Deaths

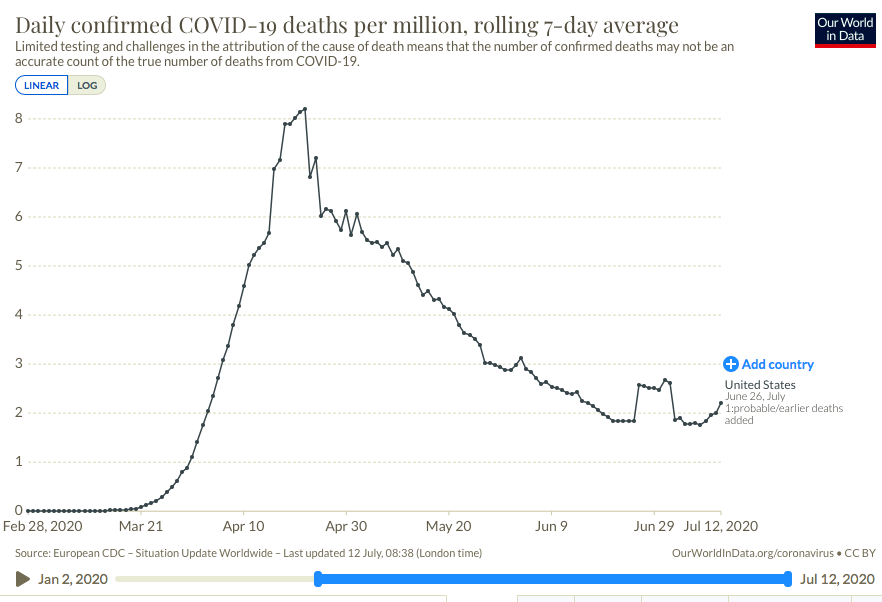
The right-hand side of the chart above shows that Sweden experienced a significant number of Covid deaths per million residents. The figure still compares reasonably well internationally, despite the country’s fairly advanced age demographics. Most Covid deaths occurred in the elderly and especially in care settings. Like other places, that is where the bulk of Sweden’s Covid deaths occurred. Note that U.S. Covid deaths per million were more than 50% higher than in Sweden.

NPIs Are Often Deadly

Perhaps a more important reason to emphasize excess deaths over Covid deaths is that public policy itself had disastrous consequences in many countries. In particular, strict NPIs like lockdowns, including school and business closures, can undermine public health in significant ways. That includes the inevitably poor consequences of deferred health care, the more rapid spread of Covid within home environments, the physical and psychological stress from loss of livelihood, and the toll of isolation, including increased use of alcohol and drugs, less exercise, and binge eating. Isolation is particularly hard on the elderly and led to an increase in “deaths of despair” during the pandemic. These were the kinds of maladjustments caused by lockdowns that led to greater excess deaths. Sweden avoided much of that by eschewing stringent NPIs, and Iceland is sometimes cited as a similar case.

Oxford Stringency Index

I should note here, and this is a digression, that the most commonly used summary measure of policy “stringency” is not especially trustworthy. That measure is an index produced by Oxford University that is available on the Our World In Data web site. Joakim Book documented troubling issues with this index in late 2020, after changes in the index’s weightings dramatically altered its levels for Nordic countries. As Book said at that time:

“Until sometime recently, Sweden, which most media coverage couldn’t get enough of reporting, was the least stringent of all the Nordics. Life was freer, pandemic restrictions were less invasive, and policy responses less strong; this aligned with Nordic people’s experience on the ground.”

Again, Sweden relied on voluntary action to limit the spread of the virus, including encouragement of hygiene, social distancing, and avoiding public transportation when possible. Book was careful to note that “Sweden did not ‘do nothing’”, but it’s policies were less stringent than its Nordic neighbors in several ways. While Sweden had the same restrictions on arrivals from outside the European Economic Area as the rest of the EU, it did not impose quarantines, testing requirements, or other restrictions on travelers or on internal movements. Sweden’s school closures were short-lived, and its masking policies were liberal. The late-2020 changes in the Oxford Stringency Index, Book said, simply did not “pass the most rudimentary sniff test”.

Economic Stability

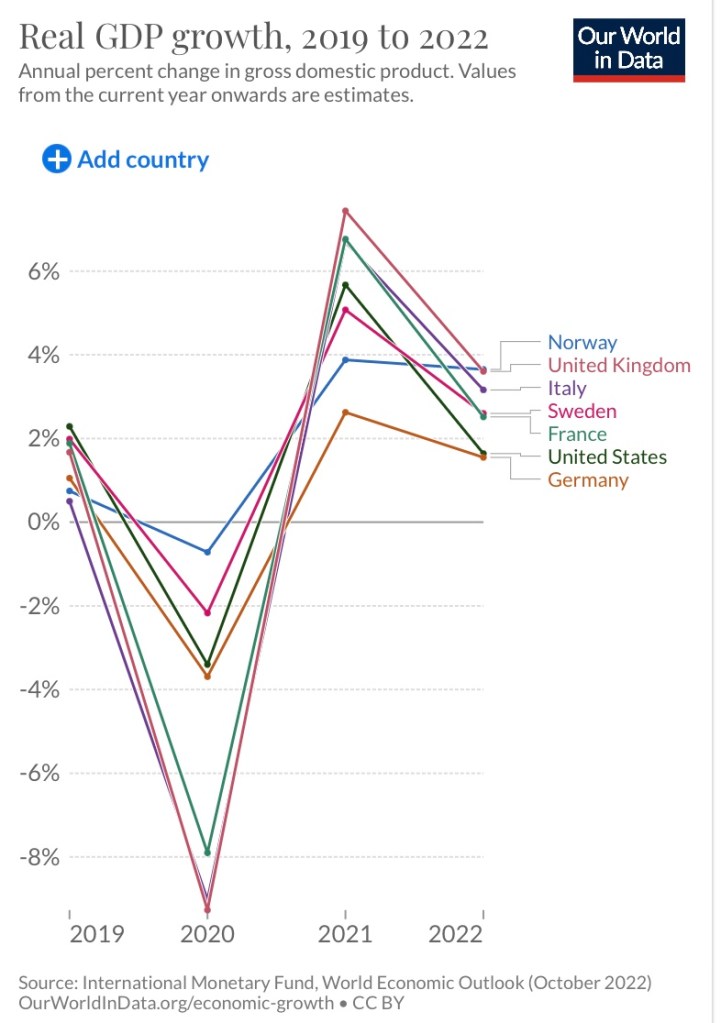
Sweden’s economy performed relatively well during the pandemic. The growth path of real GDP was smoother than most countries that succumbed to the excessive precautions of lockdowns. However, Norway’s economy appears to have been the most stable of those shown on the chart, at least in terms of real output, though it did suffer a spike in unemployment.

The Bottom Line

The big lesson is that Sweden’s “light touch” during the pandemic proved to be at least as effective, if not more so, than comparatively stringent policies imposed elsewhere. Covid deaths were sure to occur, but widespread non-Covid excess deaths were unanticipated by many countries practicing stringent intervention. That lack of foresight is best understood as a consequence of blind panic among public health “experts” and other policymakers, who too often are rewarded for misguided demonstrations that they have “done something”. Those actions failed to stop the spread in any systematic sense, but they managed to do great damage to other aspects of public health. Furthermore, they undermined economic well being and the cause of freedom. Johan Giesecke was right to be skeptical of those claiming they could contain the virus through NPIs, though he never anticipated the full extent to which aggressive interventions would prove deadly.

Excess Deaths and Avoidable Deaths

07 Monday Mar 2022

Posted by Nuetzel in Public Health

≈ Leave a comment

Tags

Adverse Events, Anti-Coagulants, Avoidable Deaths, Blood Clotting, Blood Thinners, CDC, Covid-19, Death of Expertise, Deaths of Despair, Deferred Care, Emergency Use Authorization, EUA Shadow Deaths, Excess Deaths, Incidental Infections, Lockdown Deaths, Omicron Variant, Our World In Data, Post-Mortem Testing, Prime Age Deaths, Randomized Control Trials, The Ethical Skeptic, USMortality.com, Vaccine Efficacy, Vascular Integrity

Understanding the severity of the coronavirus pandemic is more straightforward when measured in terms of excess deaths, rather than total Covid deaths. We’ve had a large number of excess deaths in the U.S., but not all of them can be attributed to Covid. It’s also worth asking whether some of the deaths were avoidable, because that reflects even more profoundly on the success or failure of public policy and the health care system in dealing with the challenge. Unfortunately, while the precise number of avoidable deaths the nation has suffered is speculative, it is nevertheless significant.

Bad Metrics

A huge problem with using total Covid deaths as a measure of pandemic severity is that no one is confident in the accuracy of official statistics. There are reasons to suspect over-counting in the U.S. due to financial incentives created for hospital systems by the CARES Act. These were exacerbated by the CDC’s absurd 2020 recommendations for the completion of death certificates. Essentially, any non-primary Covid entry on a death certificate was sufficient to count the death as from Covid. No other disease is or has ever been tallied like that.

There is an important distinction between deaths “with Covid” and deaths “from Covid” that has been acknowledged only recently by health authorities. A death “with Covid” can occur when a patient tests positive for Covid after being admitted to a hospital for another primary ailment. Thus, deaths from other causes like heart failure have been improperly coded as Covid deaths under the CDC’s guidelines. Even tragedies like auto fatalities have been coded as Covid deaths.

At the same time, some public health “elites” insist that many Covid deaths in the community have gone unreported. That might have been true in the early weeks of the pandemic. However, post-mortem testing by medical examiners began to spread by April 2020, though there was a shortage of tests, and the CDC issued guidelines to encourage it late in the year.

Counting excess deaths from all causes avoids these controversies, including differences across countries in the way they record Covid deaths. It’s also possible to break down excess death into broad categories of causes, though the task is complex.

How Many?

First some simple accounting. Let’s define all-cause mortality during a period (Mort) as Covid deaths (C) plus plus all other mortality (M), or Mort = C + M. Expected mortality in the absence of a pandemic would be Exp(Mort) = Exp(M). Usually this expected value is taken as an average of deaths over several previous years. Therefore, excess mortality during the pandemic is:

EM = C + M – Exp(M)

How many excess deaths have we actually seen during the pandemic? According to Our World In Data, the figure was 950,000 as of Jan 9th. USMortality.com puts the excess at about 965,000 through the end of 2021. So these two sources are in close agreement, which says a lot given the usual difficulty of getting pandemic numbers to tie-out across sources

Through 2021, cumulative Covid deaths (by date of death) were almost 850,000. That’s less than excess deaths, so it’s obvious that other factors have contributed to the excess. Interestingly, 2021 was worse for excess deaths than 2020 for all age groups except 85+. Some have suggested the most vulnerable in this highly vulnerable age group had already succumbed to Covid in 2020, but there may have been other reasons for the difference.

Non-Covid Excesses

As noted above, some of the Covid deaths were misattributions. If we understand C to include only deaths “from Covid”, then we must acknowledge that M includes deaths from other causes but “with Covid”, as well as all deaths without Covid diagnoses. For example, because of the confounded way in which Covid deaths have been counted, a death from heart disease could end up in the official count of C, but it should be included in M instead.

The figures above imply 100,000+ excess deaths during the pandemic not associated with Covid diagnoses. If we add to those the “with Covid”, incidental total, then perhaps 300,000 – 400,000 excess deaths during the pandemic were from non-Covid primary causes!

Lockdown effects are a prime suspect in these non-Covid deaths. For example, if health care was deferred because hospitals cancelled or delayed elective procedures, or because patients feared the hospital environment, that would certainly manifest in premature deaths. Deaths of despair or neglect were also in excess, as one should expect when populations are subjected to prolonged periods of isolation.

These kinds of deaths are so-called “lockdown” deaths because they could have been avoided without such stringent policy measures and the propagation of fear by public health authorities. Those who might protest this nomenclature should note that lockdowns have been unsuccessful in mitigating the pandemic (and see here). After all, in terms of excess deaths, the Swiss approach was quite successful!

Avoidable Deaths

Many of the excess pandemic deaths were avoidable. Prolonged lockdown policies were driven by politics rather than sound public health reasoning. However, within the Covid death totals there is another category of avoidable deaths, and it is every bit as controversial. This post from The Ethical Skeptic (TES) goes into great detail on the matter. He takes a strong position, and some of his assertions and his accounting are subject to challenge. I sometimes find that TES’s posts contain ambiguities, and the graphical evidence he presents is often poorly labeled. Still, he has proven correct on other controversial issues, such as the ancestry and surprisingly early “vintage” of the Omicron variant.

Most of the “avoidable” Covid deaths (again, as distinct from the non-Covid lockdown deaths) occurred well after the primary symptoms of the infection (fever, cough, and cytokine storm) had passed. In the end, the real killers were follow-on problems induced by Covid, primarily related to blood clotting and compromised vascular integrity from endothelial dysfunction. These deadly complications were known very early in the pandemic. The following schematic from TES shows a Covid “death timeline”. The figures listed under the schematic show the large share of clotting and vascular problems involved in these deaths.

Over the past two years, not all of these patients were placed on anticoagulants or blood thinners early in the course of their infections. Indeed, many of them were told to “go home and sleep it off”. This is what happened to TES as well as a number of commenters on his Twitter account. I know several individuals who received the same advice from medical professionals. Even among the hospitalized, many were not placed on these drugs in a timely fashion, or until it was too late. TES adds the wrinkle that his physician indicated he should have been vaccinated! Short of that, tough luck, said the healer.

TES blames this medical “malfeasance” on the CDC’s Emergency Use Authorizations (EUA) for the Covid vaccines. In fact, he calls these deaths “EUA Shadow Deaths”, citing legal requirements associated with EUAs that would appear to prohibit alternatives such as therapies and even tests or studies of alternatives. That contention seems questionable given the CDC’s issuance of other EUAs for certain treatments, and there was no shortage of published experiments conducted during 2020-21.

The vaccine EUAs were not issued until late 2020, but TES claims that forces leading up to those EUAs were responsible for the failure to put patients on anticoagulants/blood thinners even earlier in 2020. The schematic says more than half of Covid deaths through the end of 2021 involved blood coagulation issues, and I have no reason to doubt those figures, which TES sources from the CDC. But He uses a value of 50% of Covid deaths to estimate that 421,000 Covid deaths were avoidable.

I’m not sure about that total, or rather, the use of the term “avoidable” in all those cases. I am sure, however, that we’ve seen a remarkable under-emphasis on therapeutics (and see here and here) relative to the emphasis on vaccines. The news media contributed to the dysfunction by condemning certain promising therapies for political reasons.

I’m also sure that there have been a meaningful number of patients who should have received anticoagulants/thinning agents but did not. Why did they not? Plausibly, the restrictions imposed by the vaccine EUAs made a difference, but clearly the medical community was not tuned into what should have been an obvious treatment regimen.

How many Covid deaths were truly avoidable? TES’s estimate of 421,000 seems too high if only because we can’t expect the dissemination of information through the medical community to be perfect. Moreover, some of these patients were undoubtedly on blood thinners already, or there might have been contraindications preventing the use of anticoagulants/thinners.

Nevertheless, a substantial number of deaths could have been avoided by more timely use of therapeutics and less stringent lockdown measures. Here is a chart from a tweet by TES showing another accounting for excess deaths:

Here, TES uses a slightly longer time frame, through about February 5, 2022, so the “EUA Shadow Death” total is somewhat larger, about 437,000, than shown in the earlier schematic. He attributes about 800,000 excess deaths, or 77%, to Covid, most of which he believes were avoidable deaths.

Lockdown deaths account for some of the additional 236,000 excess deaths reported in the chart, and probably a large share of the roughly 90,000 non-natural deaths labeled #3 (SAAAAD = “Suicide Addiction Abandonment Abuse Accident & Despair”; the two other categories in #3 relate to non-Covid illnesses acquired in-hospital or adverse reactions to medications). The Unknown/Abnormal category may include some lockdown deaths, but more on that category below.

If TES is correct about shadow deaths, the “avoidable” pandemic death total might account for well over half of all excess deaths. I suspect it might account for half, but even if less, it’s clear that avoidable deaths have been a huge part of the pandemic’s toll.

Vaccine Adverse Events

There’s been much speculation about the large number of Unknown/Abnormal deaths that have been coded during the pandemic: more than 65,000 in the chart above. One caveat is that an “unknown” cause of death usually means the cause is ambiguous: there might have been several factors contributing to the death such that the medical examiner was unable to assign a definitive cause. That status can be temporary as well. Still, the surge is noteworthy.

Unfortunately, there were an unusual number of excess deaths in younger age brackets in 2021, especially in the second half of the year after vaccinations had reached a fairly large share of the population. The pace of those deaths hasn’t yet abated in 2022. The next chart, from USMortality.com, shows excess mortality in the 25 – 44 age bracket in 2020 – early 2022.

Many of these prime age deaths could be a continuing hangover from deferred medical care and depression. There are claims, however, that the vaccines themselves killed a significant number of individuals. The upsurge in excess deaths suggests to some that the vaccines have had a much greater number of “adverse events” than we’ve seen reported by the CDC and the news media.

Here is how TES presents the data on excess deaths and vaccinations. The chart title is his somewhat confusing attempt to summarize the meaning of the lines plotted. The left axis measures the pace of vaccinations by week and the right access measures weekly excess non-Covid natural-cause deaths.

I have no doubt as to the efficacy of the vaccines against serious Covid outcomes in high-risk groups, though vaccine efficacy has been drastically overstated by the Biden Administration. The balance of risks for older individuals is clearly in favor of vaccination. Still, I’ve long felt that vaccination is less compelling for people in younger age brackets, and it’s possibly a bad idea. That’s both because Covid is a much smaller risk to them and because of possible vaccine risks, such as myocarditis.

To the extent that natural-cause, non-Covid excess deaths among younger age cohorts have been driven by unnecessary vaccinations, those deaths were avoidable. I’m not convinced of the significance, and it’s clear that among hospitalized Covid patients, outcomes have been better among the vaccinated. The following chart is from the link in the previous paragraph:

That sort of pattern might mean more deaths among the unvaccinated could have been avoided, on balance, had they opted for the jab. In almost all things, however, I believe we should eschew blanket mandates and instead offer protection to those seeking it in the high-risk population.

Conclusion

As many as 30% of Covid deaths to date are likely misattributions in which Covid was not really the primary cause of death. Nevertheless, excess Covid deaths “from Covid” as the primary cause are probably approaching 700,000 today.

The pandemic was certainly bad enough without a slew of bad calls by the public health and medical establishments. Of the 950,000+ excess deaths that occurred through the end of 2021, over 100,000 were not attributed to Covid. If we include deaths mis-attributed to Covid, the non-Covid total is likely in excess of 300,000 and could be as high as 400,000. It’s time to acknowledge that lockdowns and fear-mongering led to a large number of those deaths, and most of those deaths were avoidable. However, while I am skeptical, the number of deadly adverse effects from vaccines in the prime age population is an open question.

Another class of avoidable deaths was a product of the underemphasis on Covid therapies by the medical establishment. There were many cases of promising, repurposed drugs that were shouted down after so-called experts insisted that their use must be withheld until adequate randomized control trials (RCTs) had confirmed their efficacy. Not only did this ignore the long history of clinical evidence as a guide to medical practice. It also ignored the frequent real-world inadequacies that plague RCTs.

At the same time, obvious complications of the vascular system, primarily blood clotting, were not treated in a timely way or as a precautionary treatment’s, at least prior to hospitalization. Adding a conservative allowance for these deaths to the other avoidable deaths probably means that at least half of the excess deaths during the pandemic were avoidable. As of March 2022, that’s over half a million deaths! We can chalk it up to mismanagement and miscommunication by the public health establishment with a dash of ignorance, and perhaps some malfeasance, by health care practitioners. The death of expertise, indeed!

Chill-Out Advisory: Pandemic to Endemic Means Live Again

13 Sunday Feb 2022

Posted by Nuetzel in Pandemic, Public Health, Uncategorized

≈ Leave a comment

Tags

Acquired Immunity, Biden Administration, CDC, Child Risks, Covid-19, Covid-Like Symptoms, Covidestim.org, Delta Variant, EU Visits, HOLD2, Hope-Simpson Seasonal Pattern, Hospital Utilization, Hospitalizations, Incidental Infections, John Tierney, Lockdowns, Mask Efficacy, Natural Immunity, Omicron BA.1, Omicron BA.2, Omicron Variant, Our World In Data, Phil Kerpen, Staffed Beds, Teachers Unions, Tradeoffs, Transmissability, Vaccine Efficacy, Vaccine Risks, Virulence

We might be just be done with the coronavirus pandemic. That is, it appears to be transitioning to a more permanent endemic phase. What follows are a few details about the Omicron wave and its current status, an attempt to put the risks of Covid in perspective, and a few public policy lessons that are now gaining broad currency but should have been obvious long ago.

What’s The Status?

The Omicron variant became the dominant U.S. strain of the coronavirus in December. Omicron outcompeted Delta, which was very good news because Omicron is far less severe. The chart below (from the CDC Data Tracker site) shows Omicron’s rapid ascendance and displacement of the Delta variant. The orange bar segments represent the proportion of cases of the Delta strain, while the purple and pink segments are Omicron sub-variants known as BA.1 and BA.2, respectively. BA.2 is even more transmissible than BA.1 and is likely to become dominant over the next month or so. However, the BA.2 sub-variant appears to be far less virulent than Delta, like BA.1.

Despite a record number of infections over a period of a month or so, the Omicron wave is tapering just as rapidly as it ramped up, as the next chart demonstrates. In fact, covidestim.org shows that cases are now receding in all states, DC, and Puerto Rico. Here are new cases per million people from Our World in Data:

Whether BA.2 causes cases to plateau for a while, or even a secondary Omicron “wavelet”, is yet to be seen. That would be consistent with the normal Hope-Simpson seasonal pattern of viral prevalence in the northern hemisphere (hat tip: HOLD2):

Data problems make the Omicron wave difficult to assess, however. We don’t know the share of incidental infections for the U.S. as a whole, but more than half of hospitalized Covid patients in Massachusetts and Rhode Island are classified with incidental infections. The proportion in the UK is estimated to be rising and approaching 30% of total cases, with much higher percentages in many regions of England, as shown below.

As I’ve emphasized in the past, case numbers should not be the primary gauge of the state of the pandemic, especially with a more highly contagious but relatively mild variant like Omicron. Hospitalizations are a better measure, but only if “incidental” infections are removed from the counts. That’s been acknowledged only recently by the public health establishment, and even the Biden Administration is emphasizing it as a matter of sheer political expediency. Another measure that might be more reliable for assessing the pandemic in the community as a whole is the number of emergency room patients presenting Covid-like symptoms. From the CDC Data Tracker:

There is no doubt that incidental infections create complications in caring for patients with other ailments. That has a bearing on the utilization of hospital capacity. Generally, however, strains on hospital capacity during the pandemic have been greatly exaggerated. This is not to diminish the hard work and risks faced by health care workers, and there have been spot shortages of capacity in certain localities. However, in general, staffed beds have been more than adequate to meet needs. This chart, like a few others below, is courtesy of Phil Kerpen:

With the more highly transmissible variants we have now, it’s not at all surprising to see a high proportion of incidental cases among inpatients. Incidental infections are likely to inflate counts of Covid deaths as well, given the exceptional and odd way in which Covid deaths are being recorded. It will be some time until we see full U.S. data on cases and deaths net of incidental infections. Moreover, many of the Covid deaths in December and January were from lingering Delta infections, which might still be a factor in the February counts.

How Are Your Odds?

The mild or asymptomatic nature of most Omicron cases, the large proportion of incidental hospitalizations, and the knowledge that Omicron is not a deep respiratory threat should offer strong reassurance to healthy individuals that the variant does not pose a great risk. According to a recent CDC report, in a sample of almost 700,000 vaccinated individuals aged 65 or less without co-morbidities, there were no Covid fatalities or ICU admissions during the 10 months from December 2020 through October 2021. There was only one fatality in the sample of healthy individuals older than 65. There were just 36 fatalities across the full sample of over 1.2 million vaccinated individuals, so COVID’s fatality risk was only about 0.3%. Of those deaths, 28 were among those with four or more risk factors (including co-morbidities and > 65 years). And this was before the advent of Omicron!

I have a few doubts about the CDC’s sample selection and vagaries around certain definitions used. Nevertheless, the results are striking. However, the study did not address risks to unvaccinated adults. Another more limited CDC study found that vaccinated patients were still less likely than the unvaccinated to require critical care during the Omicron wave.

A separate CDC study found a 91% reduction in the likelihood of death for Omicron relative to Delta. A study from the UK (see summary here) found that Omicron cases were 59% less likely than Delta cases to require hospitalization and 69% less likely to result in death within 28 days of a positive test. Omicron was far less deadly among both the vaccinated and the unvaccinated, and the latter had a larger reduction in the likelihood of death. The study was stratified by age as well, with less severe outcomes for Omicron among older cohorts except in the case of death, for which there was no apparent age gradient.

Another unnecessarily contentious issue has been the risk to children during the pandemic. Based on the data, there should never have been much doubt that these risks are quite low. Apparently, however, it was advantageous for teachers’ unions to insist otherwise. Phil Kerpen soundly debunks that claim with the following chart:

Covid has been less deadly to children from infancy through 17 years than the pre-pandemic flu going back to 2012! Oh yes, but teachers FEAR transmission from the children! That claim is just as silly, since children are known to be inefficient transmitters of the virus (and see here).

Now that Omicron has relegated the Delta variant to the history books, the risks going forward seem much more manageable. Omicron is less severe, especially for the vaccinated. Levels of acquired (natural) immunity from earlier infections are now much higher against older strains, and Omicron infections seem to be protective against Delta.

In commentary about the first CDC study discussed above, John Tierney lends perspective to the odds of death from pre-Omicron Covid:

“Those are roughly the same odds that in the course of a year you will die in a fire, or that you’ll perish by falling down stairs. Going anywhere near automobiles is a bigger risk: you’re three times more likely during a given year to be killed while riding in a car, and also three times more likely to be a pedestrian casualty. The 150,000-to-1 odds of a Covid death are even longer than the odds over your lifetime of dying in an earthquake or being killed by lightning.”

Yet with all this research confirming the low odds of death induced by Omicron, why have we seen recent deaths at levels approaching previous waves? First, many of those deaths are carried over from Delta infections. That means deaths should begin to taper rapidly as February reports roll in. And remember that daily reports do not show deaths by date of death. Deaths usually occur weeks or even months before they are reported. That also means some of the deaths reported might be “harvested” from much earlier fatalities. Second, given the high levels of incidental Omicron infections, some of those deaths are misattributed to Covid, an issue that is not new by any means. Finally, while Omicron is relatively mild for most people, the high rate of transmission means that a high number of especially vulnerable individuals may be infected with severe outcomes. We have seen much more severe consequences for the unvaccinated, of course, and for those with co-morbidities.

Things We Should Have Known

I’ll try to keep this last section brief, but as an introduction I’ll just say that it’s almost as if we’ve been allowing the lunatics to run the asylum. To paraphrase one comment I saw recently, if you wonder why there is so much dissent, you ought to consider the fact the much of what our governments have done (along with many private organizations) was to prohibit things that were demonstrably safe (e.g., going outside, using swing sets, or attending schools) and to encourage things that were demonstrably harmful (e.g., deferring medical care, or masking small children).

The following facts are only now coming into focus among those who’ve been “following the politics” rather than “the science”, despite pretensions to the latter.

  • Specific public health initiatives often face steep economic, emotional, social, and countervailing health tradeoffs.
  • Lockdowns do NOT work.
  • Masks do NOT work (despite the CDC’s past and recent confusion on the matter).
  • Children are at very low-risk from Covid.
  • Children do NOT present high risks to teachers.
  • Natural immunity is more protective than vaccines.
  • Vaccines do NOT “stop the spread”.
  • Vaccine risks might outweigh benefits for certain groups and individuals.
  • Vaccines should NOT be relied upon at the expense of treatments.
  • Don’t reject treatments based on politics.
  • Vaccine mandates are unethical.

Grow Up and Chill Out!

Life is full of risks, and nothing has changed to alter wisdom gained in earlier pandemics. For example, this pearl from a 2006 publication on disease mitigation measures should be heeded (hat tip: Phil Kerpen):

If there is one simple message everyone needs to hear, it is to stop allowing the virus bogeyman to rule your life. It will never go away completely, and it is likely to present risks that is are comparable to the flu going forward. In fact, it might well compete with the flu, which means we won’t be dealing with endemic Covid plus historical flu averages, but some smaller union of the two case loads.

So get out, go back to work, or go have some fun! Get back truckin’ on!

Effective Immunity Means IF YOU CATCH IT, You Won’t Get Sick

12 Thursday Aug 2021

Posted by Nuetzel in Coronavirus, Uncategorized, Vaccinations

≈ 5 Comments

Tags

Acquired Immunity, Aerosols, Alpha Variant, Antibodies, Base Rate Bias, Breakthrough Infections, Covid-19, Delta Variant, Immunity, Issues & Insights, Kappa Variant, Kelly Brown, Lambda Variant, Larry Brilliant, Mayo Clinic, Our World In Data, PCR Tests, Phil Kerpen, T-Cell Immunity, Vaccinations, WHO

Listen very carefully: immunity does NOT mean you won’t get COVID, though an infection is less likely. Immunity simply means your immune system will be capable of dealing with an infection successfully. This is true whether the immunity is a product of vaccination or a prior infection. Immunity means you are unlikely to have worse than mild symptoms, and you are very unlikely to be hospitalized. (My disclaimer: I am opposed to vaccine mandates, but vaccination is a good idea if you’ve never been infected.)

I emphasize this because the recent growth in case numbers has prompted all sorts of nonsensical reactions. People say, “See? The vaccines don’t work!” That is a brazenly stupid response to the facts. Even more dimwitted are claims that the vaccines are killing everyone! Yes, there are usually side effects, and the jabs carry a risk of serious complications, but it is minuscule.

Vaccine Efficacy

Right out of the gate, we must recognize that our PCR testing protocol is far too sensitive to viral remnants, so the current surge in cases is probably exaggerated by false positives, as was true last year. Second, if a large share of the population is vaccinated, then vaccinated individuals will almost certainly account for a large share of infected individuals even if they have a lower likelihood of being infected. It’s simple math, as this explanation of base rate bias shows. In fact, according to the article at the link:

“… vaccination confers an eightfold reduction in the risk of getting infected in the first place; a 25-fold reduction in risk of getting hospitalized; and a 25-fold reduction in the risk for death.”

The upshot is that if you are vaccinated, or if you have acquired immunity from previous exposure, or if you have pre-existing immunity from contact with an earlier COVID strain, you can still “catch” the virus AND you can still spread it. Both are less likely, and you don’t have as much to worry about for your own health as those having no immunity.

As for overall vaccine efficacy in preventing death, here are numbers from the UK, courtesy of Phil Kerpen:

The vertical axis is a log scale, so each successive gridline is a fatality rate 100x as large as the one below it. Obviously, as the chart title asserts, the “vaccines have made COVID-19 far less lethal.” Also, at the bottom, see the information on fatality among children under age 18: it is almost zero! This reveals the absurdity of claims that children must be masked for schools to reopen! In any case, masks offer little protection to anyone against a virus that spreads via fine aerosols. Nevertheless, many school officials are pushing unnecessary but politically expedient masking policies

Delta

Ah, but we have the so-called Delta variant, which is now dominant and said to be far more transmissible than earlier variants. Yet the Delta variant is not as dangerous as earlier strains, as this UK report demonstrates. Delta had a case fatality rate among unvaccinated individuals that was at least 40% less than the so-called Alpha variant. This is a typical pattern of virus mutation: the virus becomes less dangerous because it wants to survive, and it can only survive in the long run by NOT killing its hosts! The decline in lethality is roughly demonstrated by Kelly Brown with data on in-hospital fatality rates from Toronto, Canada:

The case numbers in the U.S. have been climbing over the past few weeks, but as epidemiologist Larry Brilliant of WHO said recently, Delta spreads so fast it essentially “runs out of candidates.” In other words, the current surge is likely to end quickly. This article in Issues & Insights shows the more benign nature of recent infections. I think a few of their charts contain biases, but the one below on all-cause mortality by age group is convincing:

The next chart from Our World In Data shows the infection fatality rate continuing its decline in the U.S. The great majority of recent infections have been of the Delta variant, which also was much less virulent in the UK than earlier variants.

Furthermore, it turns out that the vaccines are roughly as effective against Delta and other new variants as against earlier strains. And the newest “scary” variants, Kappa and Lambda, do not appear to be making strong inroads in the U.S. 

Fading Efficacy?

There have been questions about whether the effectiveness of the vaccines is waning, which is behind much of the hand-wringing about booster shots. For example, Israeli health officials are insisting that the effectiveness of vaccines is “fading”, though I’ll be surprised if there isn’t some sort of confounding influence on the data they’ve cited, such as age and co-morbidities. 

Here is a new Mayo Clinic study of so-called “breakthrough” cases in the vaccinated population in Minnesota. It essentially shows that the rate of case diagnosis among the vaccinated rose between February and July of this year (first table below, courtesy of Phil Kerpen). However, the vaccines appear only marginally less effective against hospitalization than in March (second table below).

The bulk of the vaccinated population in the U.S. received their jabs three to six months ago, and according to this report, evidence of antibodies remains strong after seven months. In addition, T-cell immunity may continue for years, as it does for those having acquired immunity from an earlier infection. 

Breakthroughs

It’s common to hear misleading reports of high numbers of “breakthrough” cases. Not only will these cases be less menacing, but the reports often exaggerate their prevalence by taking the numbers out of context. Relative to the size of the vaccinated population, breakthrough cases are about where we’d expect based on the original estimates of vaccine efficacy. This report on Massachusetts breakthrough hospitalizations and deaths confirms that the most vulnerable among the vaxed population are the same as those most vulnerable in the unvaxed population: elderly individuals with comorbidities. But even that subset is at lower risk post-vaccination. It just so happens that the elderly are more likely to have been vaccinated in the first place, which implies that the vaccinated should be over-represented in the case population.

Conclusion

The COVID-19 vaccines do what they are supposed to do: reduce the dangers associated with infection. The vaccines remain very effective in reducing the severity of infection. However, they cannot and were not engineered to prevent infection. They also pose risks, but individuals should be able to rationally assess the tradeoffs without coercion. Poor messaging from public health authorities and the crazy distortions promoted in some circles does nothing to promote public health. Furthermore, there is every reason to believe that the current case surge in Delta infections will be short-lived and have less deadly consequences than earlier variants.

Reported and “Actual” COVID Deaths

13 Monday Jul 2020

Posted by Nuetzel in Pandemic, Political Bias

≈ 2 Comments

Tags

Cause of Death, CDC, Coronavirus, Covid Tracking Project, COVID-Phobic Deaths, Death Toll, Hospital Reimbursements, Kyle Lamb, Lockdown Deaths, Our World In Data, Reclassified Deaths

I was updating my post from twelve days ago on the upward trend in new coronavirus cases when I came across a great tabular summary of a phenomenon that’s been underway since early April: significant delays in reporting deaths from COVID-19 (C19). Before I get to that, a quick word on what’s happened over the past 12 days. New coronavirus cases keep climbing in a number of states, and it’s been a grisly waiting game to see whether the severity and lethality of infections will follow the case counts upward. The following chart provides a very preliminary answer. It’s taken from Our World In Data, and it shows the seven-day moving average of C19 deaths in the U.S.

There has indeed been an upturn in reported deaths over the past week. Just prior to that, a temporary plateau in late June was caused by a set of “reclassifications” of earlier deaths in New Jersey (the “plateau effect is caused by seven-day averaging). These kinds of changes in reporting make it rather difficult to interpret trends accurately. Unfortunately, the reporting of deaths has been subject to continuing distortions that are even more difficult to discern than New Jersey’s spike.

Kyle Lamb provides the interesting table below, which might be difficult to read without either clicking on it or going to the link at Twitter. Here is another link to an annotated version of the table. The top row labeled “CTP Total” is the C19 death toll reported each week by the COVID Tracking Project. This is generally what the public sees. These reports show that deaths reached their highest levels during the weeks of April 11th through May 9th. However, the second column shows C19 deaths by their actual week of occurrence. This series shows a more distinct peak on April 18th with steady declines thereafter.

The weekly totals in the second column are not final, however. Take a look at the last reporting week in the far right column (July 11th). The CTP reported 4,286 deaths, an increase over the prior week consistent with the upturn in the first chart above. But the table shows that over half of that week’s reported deaths actually occurred in late April and early May! So the upturn in deaths is something of a mirage.

We won’t have a reasonable approximation of the death totals for the past several weeks (or how they compare) for at least several more weeks. In fact, one can argue that it might be a matter of months before we have a reasonable approximation of those deaths, but it’s worth noting that the vast bulk of “actual” C19 deaths tend to be reported within four weeks of the initial reporting week, and the additions or revisions to the two weeks in late April and early May in the last column were exceptionally large. Chances are we won’t see many more that big…. Or will we?

Aspects of this process hint at the ease with which the C19 death totals could be manipulated. The reported totals for all-cause mortality in the first column are incomplete; more recent weeks, especially, are not fully settled as to causes of death. Some of those fatalities are certain to be attributed to C19. Others might be reclassified as C19. And here is the scary part: the all-cause totals are certain to include a significant number of lockdown-related or COVID-phobic deaths: individuals who were unable or unwilling to seek medical care for urgent needs due to lockdowns or fears of rampant spread of C19 infections within hospital environments. To anyone with an interest in manipulating the C19 death toll, whether hospital officials seeking higher reimbursements, local or state officials seeking federal funds, or public officials at any level seeking to promote pandemic fears and/or political discord, these “extra” deaths might be tempting marks for reclassification.

I’m fairly confident that the uptrend of new cases will be far less severe than early in the pandemic. I believe much of the alarm I see on social and mainstream media is misplaced. More on that in a subsequent post, but for now I’ll simply note that those testing positive are concentrated in much lower ranges of the age distribution, and treatment has improved in a variety of ways. The table above shows that the downtrend in actual weekly C19 deaths is intact as of the admittedly incomplete July 11th reporting week. We won’t know the “actual” pattern of early-July C19 fatalities for another month or more. Even then, one might harbor suspicions that the totals are manipulated for economic or political reasons, but we can hope the reporting authorities are exercising the utmost objectivity in assigning cause of death.

Follow Sacred Cow Chips on WordPress.com

Recent Posts

  • The Case Against Interest On Reserves
  • Immigration and Merit As Fiscal Propositions
  • Tariff “Dividend” From An Indigent State
  • Almost Looks Like the Fed Has a 3% Inflation Target
  • Government Malpractice Breeds Health Care Havoc

Archives

  • January 2026
  • December 2025
  • November 2025
  • October 2025
  • September 2025
  • August 2025
  • July 2025
  • June 2025
  • May 2025
  • April 2025
  • March 2025
  • February 2025
  • January 2025
  • December 2024
  • November 2024
  • October 2024
  • September 2024
  • August 2024
  • July 2024
  • June 2024
  • May 2024
  • April 2024
  • March 2024
  • February 2024
  • January 2024
  • December 2023
  • November 2023
  • August 2023
  • July 2023
  • June 2023
  • May 2023
  • April 2023
  • March 2023
  • February 2023
  • January 2023
  • December 2022
  • November 2022
  • October 2022
  • September 2022
  • August 2022
  • July 2022
  • June 2022
  • May 2022
  • April 2022
  • March 2022
  • February 2022
  • January 2022
  • December 2021
  • November 2021
  • October 2021
  • September 2021
  • August 2021
  • July 2021
  • June 2021
  • May 2021
  • April 2021
  • March 2021
  • February 2021
  • January 2021
  • December 2020
  • November 2020
  • October 2020
  • September 2020
  • August 2020
  • July 2020
  • June 2020
  • May 2020
  • April 2020
  • March 2020
  • February 2020
  • January 2020
  • December 2019
  • November 2019
  • October 2019
  • September 2019
  • August 2019
  • July 2019
  • June 2019
  • May 2019
  • April 2019
  • March 2019
  • February 2019
  • January 2019
  • December 2018
  • November 2018
  • October 2018
  • September 2018
  • August 2018
  • July 2018
  • June 2018
  • May 2018
  • April 2018
  • March 2018
  • February 2018
  • January 2018
  • December 2017
  • November 2017
  • October 2017
  • September 2017
  • August 2017
  • July 2017
  • June 2017
  • May 2017
  • April 2017
  • March 2017
  • February 2017
  • January 2017
  • December 2016
  • November 2016
  • October 2016
  • September 2016
  • August 2016
  • July 2016
  • June 2016
  • May 2016
  • April 2016
  • March 2016
  • February 2016
  • January 2016
  • December 2015
  • November 2015
  • October 2015
  • September 2015
  • August 2015
  • July 2015
  • June 2015
  • May 2015
  • April 2015
  • March 2015
  • February 2015
  • January 2015
  • December 2014
  • November 2014
  • October 2014
  • September 2014
  • August 2014
  • July 2014
  • June 2014
  • May 2014
  • April 2014
  • March 2014

Blogs I Follow

  • Passive Income Kickstart
  • OnlyFinance.net
  • TLC Cholesterol
  • Nintil
  • kendunning.net
  • DCWhispers.com
  • Hoong-Wai in the UK
  • Marginal REVOLUTION
  • Stlouis
  • Watts Up With That?
  • Aussie Nationalist Blog
  • American Elephants
  • The View from Alexandria
  • The Gymnasium
  • A Force for Good
  • Notes On Liberty
  • troymo
  • SUNDAY BLOG Stephanie Sievers
  • Miss Lou Acquiring Lore
  • Your Well Wisher Program
  • Objectivism In Depth
  • RobotEnomics
  • Orderstatistic
  • Paradigm Library
  • Scattered Showers and Quicksand

Blog at WordPress.com.

Passive Income Kickstart

OnlyFinance.net

TLC Cholesterol

Nintil

To estimate, compare, distinguish, discuss, and trace to its principal sources everything

kendunning.net

The Future is Ours to Create

DCWhispers.com

Hoong-Wai in the UK

A Commonwealth immigrant's perspective on the UK's public arena.

Marginal REVOLUTION

Small Steps Toward A Much Better World

Stlouis

Watts Up With That?

The world's most viewed site on global warming and climate change

Aussie Nationalist Blog

Commentary from a Paleoconservative and Nationalist perspective

American Elephants

Defending Life, Liberty and the Pursuit of Happiness

The View from Alexandria

In advanced civilizations the period loosely called Alexandrian is usually associated with flexible morals, perfunctory religion, populist standards and cosmopolitan tastes, feminism, exotic cults, and the rapid turnover of high and low fads---in short, a falling away (which is all that decadence means) from the strictness of traditional rules, embodied in character and inforced from within. -- Jacques Barzun

The Gymnasium

A place for reason, politics, economics, and faith steeped in the classical liberal tradition

A Force for Good

How economics, morality, and markets combine

Notes On Liberty

Spontaneous thoughts on a humble creed

troymo

SUNDAY BLOG Stephanie Sievers

Escaping the everyday life with photographs from my travels

Miss Lou Acquiring Lore

Gallery of Life...

Your Well Wisher Program

Attempt to solve commonly known problems…

Objectivism In Depth

Exploring Ayn Rand's revolutionary philosophy.

RobotEnomics

(A)n (I)ntelligent Future

Orderstatistic

Economics, chess and anything else on my mind.

Paradigm Library

OODA Looping

Scattered Showers and Quicksand

Musings on science, investing, finance, economics, politics, and probably fly fishing.

  • Subscribe Subscribed
    • Sacred Cow Chips
    • Join 128 other subscribers
    • Already have a WordPress.com account? Log in now.
    • Sacred Cow Chips
    • Subscribe Subscribed
    • Sign up
    • Log in
    • Report this content
    • View site in Reader
    • Manage subscriptions
    • Collapse this bar
 

Loading Comments...