• About

Sacred Cow Chips

Sacred Cow Chips

Tag Archives: Cause of Death

The Favored Cause of Death

19 Monday Oct 2020

Posted by Nuetzel in Coronavirus, Public Health

≈ 3 Comments

Tags

All-Cause Mortality, Andrew Bostom, Andrew Cuomo, Cause of Death, Centers for Disease Control, Clinical Events, Coronavirus, Death Certificate, False Positives, Florida House of Representatives, Hospice Deaths, Justin Hart, Lockdown Deaths, Non-COVID Deaths. Co-Morbidities, PCR Tests, Specificity, Testing

The CDC changed its guidelines on completion of death certificates on April 5th of this year, and only for COVID-19 (C19), just as infections and presumed C19 deaths were ramping up. The substance of the change was to broaden the definition under which death should be attributed to C19. This ran counter to CDC guidelines followed over the previous 17 years, and the change not only makes the C19 death counts suspect: it also makes comparisons of C19 deaths to other causes of death unreliable, since only C19 is subject to the new CDC guidance. That’s true for concurrent and historical comparisons. The distortions are especially bad relative to other respiratory diseases, but also relative to other conditions that are common in mortality data.

The change in the CDC guidelines was noted in a recent report prepared for the Florida House of Representatives. It was brought to my attention by a retweet by Justin Hart linked to this piece on Andrew Bostom’s site. Death certificates are divided into two parts: Part 1 provides four lines in which causes of death are listed in reverse clinical order of events leading to death. Thus, the first line is the final clinical condition precipitating death. Prior clinical events are to be listed below that. The example shown above indicates that an auto accident, listed on the fourth line, initiated the sequence of events. Part 2 of the certificate is available for physicians or examiners to list contributing factors that might have played a role in the death that were not part of the sequence of clinical events leading to death.

The CDC’s change in guidelines for C19, and C19 only, made the criteria for inclusion in Part 1 less specific, and it essentially eliminated the distinction between Parts 1 and 2. The following appears under “Vital Records Criteria”:

“A death certificate that lists COVID-19 disease or SARS-CoV-2 as a cause of death or a significant condition contributing to death.”

How much difference does this make? For one thing, it opens the door to C19-attributed deaths in cases of false-positive PCR tests. When large cohorts are subject to testing — for example, all patients admitted to hospitals — there will always be a significant number of false positives even when test specificity is as high as 98 – 99%.

The elimination of any distinction between Parts 1 and 2 causes other distortions. A review of the Florida report is illustrative. The House staff reviewed almost 14,000 certificates for C19-19 attributed deaths. Over 9% of those did not list C19 among the clinical conditions leading to death. Instead, in those cases, C19 was listed as a contributing factor. Under the CDC’s previous guidelines, those would not have been counted as C19 deaths. The Florida House report is conservative in concluding that the new CDC guidelines inflated C19 deaths by only those 9% of the records examined.

There are reasons to think that the exaggeration was much greater, however. First, the Florida House report noted that nearly 60% of the certificates contained information “recorded in a manner inconsistent with state and national guidance”. In addition, almost another 10% of the fatalities were among patients already in hospice! Do we really believe the deaths of all those patients whose diseases had reached such an advanced stage should be classified as C19 fatalities? And another 1-2% listed non-C19 conditions as the immediate and underlying causes.

Finally, more than 20% of the certificates listed C19 alone as a cause of death despite a range of other contributing conditions or co-morbidities. This in itself may have been prompted by the change in the CDC’s guidelines, as the normal standards often involve a “comorbidity” as the initial reason for hospitalization — in that case a clinical event ordinarily listed in Part 1. The high rate of errors and the fact that roughly two-thirds of the deaths reviewed occurred in the hospital, where patients are all tested and often multiple times, raises the specter that up to 20% more of the C19 deaths were either erroneous and/or misclassified due to false positives.

(An exception may have occurred in New York, where an order issued in March by Governor Andrew Cuomo to return C19-positive residents of nursing homes (including suspected C19 cases) back to those homes, The order was made before the change in CDC guidelines and wasn’t rescinded until later in April. There is reason to believe that some of the C19 deaths among nursing home residents in New York were undercounted.)

All told, in the Florida data we have potential misclassification of deaths of 9% + 9% + 2% + 20% = 40%, or inflation relative to actual C19 deaths of up to 40%/60% = 67%! I strongly doubt it’s that high, but I would not consider a range of 25% – 50% exaggeration to be unreasonable.

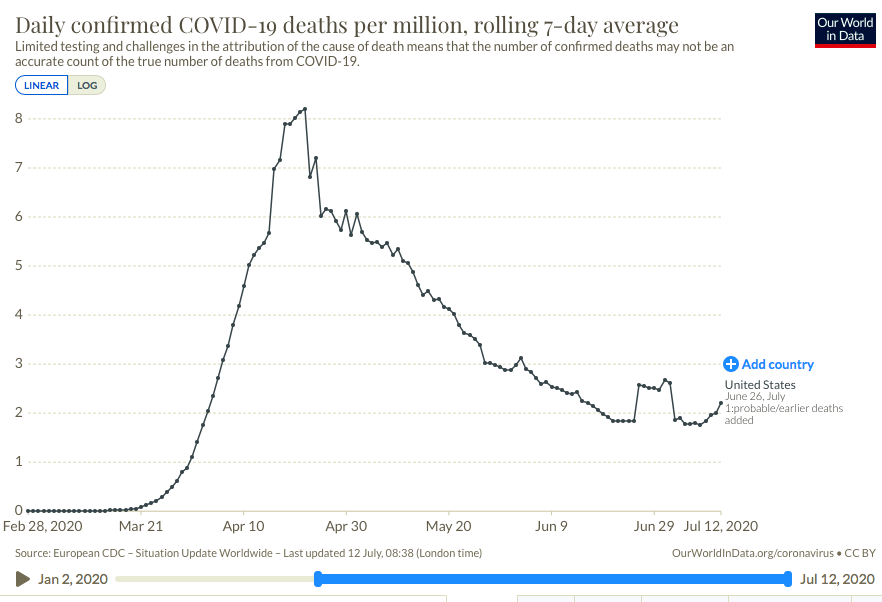
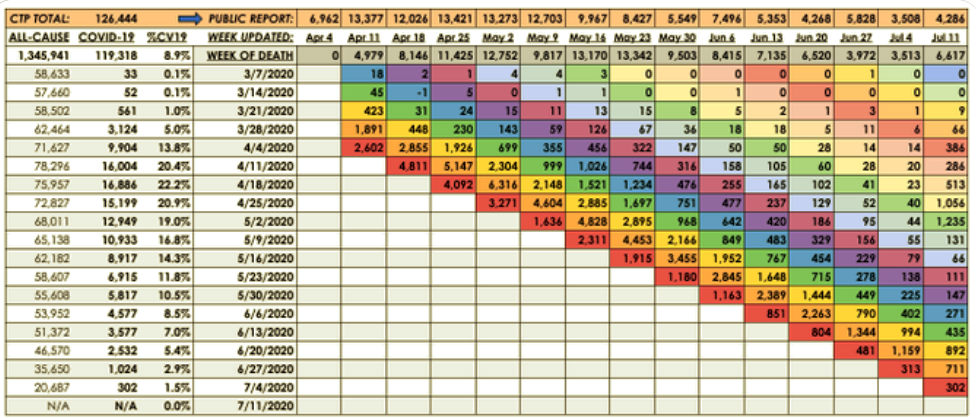
We know that reports of C19 deaths lag actual dates of death by anywhere from 1 to 8 weeks, sometimes even more. This is misleading when no effort is made to explain that difference, which I’ve never heard out of a single journalist. We also know that false positive tests inflate C19 deaths. The Florida report gives us a sense of how large that exaggeration might be. In addition, the Florida data show that the CDC guidelines inflate C19 deaths in other ways: as a mere contributing factor, it can now be listed as the cause of death, unlike the treatment of pneumonia as a contributing factor, for instance. The same kind of distortion occurs when patients contract C19 (or have a false positive test) while in hospice.

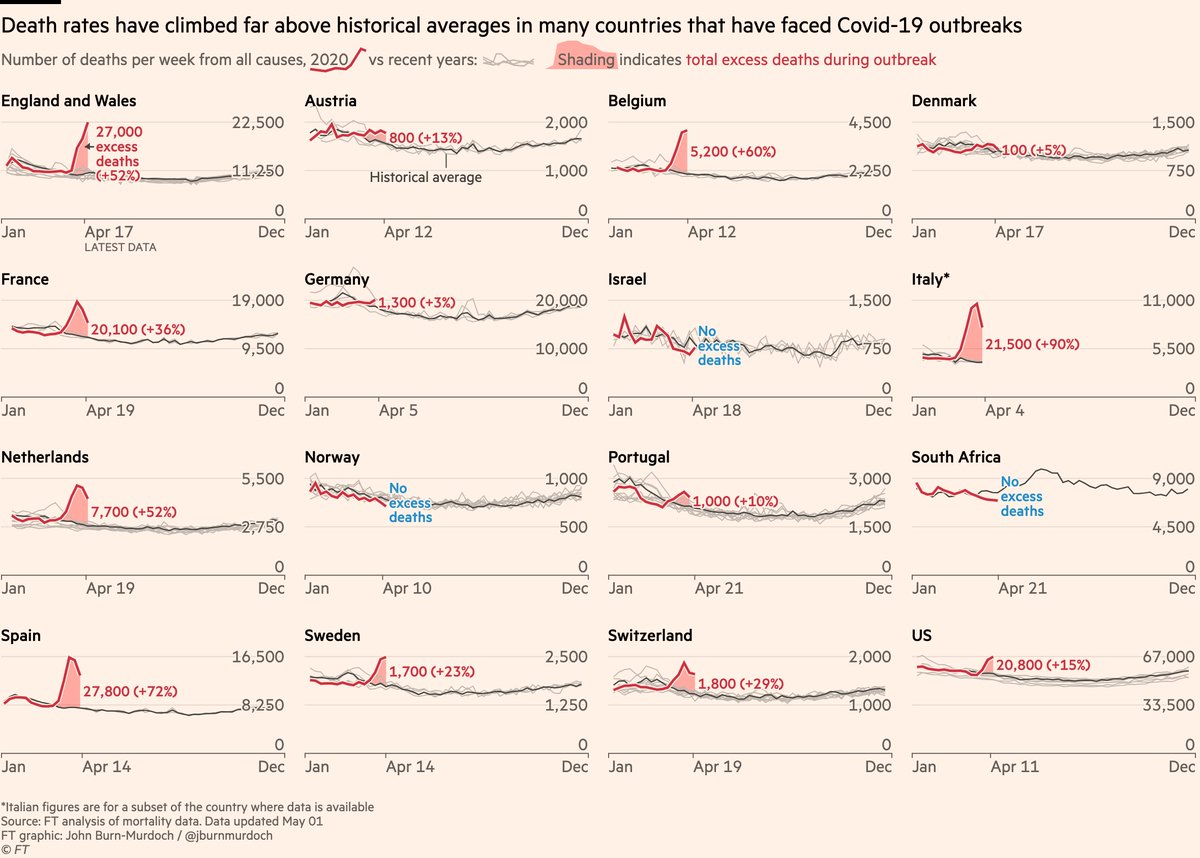
There is no doubt that C19 led to “excess deaths” relative to all-cause mortality. However, many of these fatalities are misclassified, and it’s likely that a large share were and are lockdown deaths as opposed to C19 deaths. That’s tragic. The CDC has done the country a massive disservice by creating “special rules” for attributing cause-of-death to C19. If reported C19 fatality rates reflected the same rules applied to other conditions, our approach to managing the pandemic surely would have inflicted far less damage to health and economic well being.

Reported and “Actual” COVID Deaths

13 Monday Jul 2020

Posted by Nuetzel in Pandemic, Political Bias

≈ 2 Comments

Tags

Cause of Death, CDC, Coronavirus, Covid Tracking Project, COVID-Phobic Deaths, Death Toll, Hospital Reimbursements, Kyle Lamb, Lockdown Deaths, Our World In Data, Reclassified Deaths

I was updating my post from twelve days ago on the upward trend in new coronavirus cases when I came across a great tabular summary of a phenomenon that’s been underway since early April: significant delays in reporting deaths from COVID-19 (C19). Before I get to that, a quick word on what’s happened over the past 12 days. New coronavirus cases keep climbing in a number of states, and it’s been a grisly waiting game to see whether the severity and lethality of infections will follow the case counts upward. The following chart provides a very preliminary answer. It’s taken from Our World In Data, and it shows the seven-day moving average of C19 deaths in the U.S.

There has indeed been an upturn in reported deaths over the past week. Just prior to that, a temporary plateau in late June was caused by a set of “reclassifications” of earlier deaths in New Jersey (the “plateau effect is caused by seven-day averaging). These kinds of changes in reporting make it rather difficult to interpret trends accurately. Unfortunately, the reporting of deaths has been subject to continuing distortions that are even more difficult to discern than New Jersey’s spike.

Kyle Lamb provides the interesting table below, which might be difficult to read without either clicking on it or going to the link at Twitter. Here is another link to an annotated version of the table. The top row labeled “CTP Total” is the C19 death toll reported each week by the COVID Tracking Project. This is generally what the public sees. These reports show that deaths reached their highest levels during the weeks of April 11th through May 9th. However, the second column shows C19 deaths by their actual week of occurrence. This series shows a more distinct peak on April 18th with steady declines thereafter.

The weekly totals in the second column are not final, however. Take a look at the last reporting week in the far right column (July 11th). The CTP reported 4,286 deaths, an increase over the prior week consistent with the upturn in the first chart above. But the table shows that over half of that week’s reported deaths actually occurred in late April and early May! So the upturn in deaths is something of a mirage.

We won’t have a reasonable approximation of the death totals for the past several weeks (or how they compare) for at least several more weeks. In fact, one can argue that it might be a matter of months before we have a reasonable approximation of those deaths, but it’s worth noting that the vast bulk of “actual” C19 deaths tend to be reported within four weeks of the initial reporting week, and the additions or revisions to the two weeks in late April and early May in the last column were exceptionally large. Chances are we won’t see many more that big…. Or will we?

Aspects of this process hint at the ease with which the C19 death totals could be manipulated. The reported totals for all-cause mortality in the first column are incomplete; more recent weeks, especially, are not fully settled as to causes of death. Some of those fatalities are certain to be attributed to C19. Others might be reclassified as C19. And here is the scary part: the all-cause totals are certain to include a significant number of lockdown-related or COVID-phobic deaths: individuals who were unable or unwilling to seek medical care for urgent needs due to lockdowns or fears of rampant spread of C19 infections within hospital environments. To anyone with an interest in manipulating the C19 death toll, whether hospital officials seeking higher reimbursements, local or state officials seeking federal funds, or public officials at any level seeking to promote pandemic fears and/or political discord, these “extra” deaths might be tempting marks for reclassification.

I’m fairly confident that the uptrend of new cases will be far less severe than early in the pandemic. I believe much of the alarm I see on social and mainstream media is misplaced. More on that in a subsequent post, but for now I’ll simply note that those testing positive are concentrated in much lower ranges of the age distribution, and treatment has improved in a variety of ways. The table above shows that the downtrend in actual weekly C19 deaths is intact as of the admittedly incomplete July 11th reporting week. We won’t know the “actual” pattern of early-July C19 fatalities for another month or more. Even then, one might harbor suspicions that the totals are manipulated for economic or political reasons, but we can hope the reporting authorities are exercising the utmost objectivity in assigning cause of death.

The Vagaries of Excess Deaths

02 Saturday May 2020

Posted by Nuetzel in Liberty, Pandemic, Tyranny

≈ 2 Comments

Tags

Cause of Death, CDC, Civid-Only Deaths, Co-Morbidities, Coronavirus, Covid-19, Denmark Covid, Eastern Europe Covid, Euromomo, Excess Mortality, Germany Covid, Jacob Sullum, John Burn-Murdoch, New York Covid, New York Times, Probable Covid Deaths

The New York Times ran a piece this week suggesting that excess mortality from Covid-19 in the U.S. is, or will be, quite high. The analysis was based on seven “hard hit” states, including three of the top four states in Covid death rate and five of the top ten. Two states in the analysis, New York and New Jersey, together account for over half of all U.S. active cases. This was thinly-veiled cherry picking by the Times, as Jacob Sullum notes in his discussion of what excess mortality does and doesn’t mean. Local and regional impacts of the virus have varied widely, depending on population density, international travel connections, cultural practices, the quality of medical care, and private and public reaction to news of the virus. To suggest that the experience in the rest of the country is likely to bear any similarity to these seven states is complete nonsense. Make no mistake: there have been excess deaths in the U.S. over the past few weeks of available data, but again, not of the magnitude the Times seems to intimate will be coming.

Beyond all that, the Times asserts that the CDC’s all-cause death count as of April 11 is a significant undercount, though the vast majority of deaths are counted within a three week time frame. In fact, CDC data at this link show that U.S. all-cause mortality was at a multi-year low during the first week of April. The author admits, however, that the most recent data is incomplete. The count will rise as reporting catches up, but even an allowance for the likely additions to come would leave the count for the U.S. well below the kinds of levels suggested by the Times‘s fear-mongering article, based as it was on the seven cherry-picked states.

The author of this Twitter thread, John Burn-Murdoch, seems to engage in the same practice with respect to Europe. He shows charts with excess deaths in 12 countries, almost all of which show significant, recent bumps in excess deaths (the sole exception being Denmark). Inexplicably, he excludes Germany and a number of other countries with low excess deaths or even “valleys” of negative excess deaths. His most recent update is a bit more inclusive, however. (It was the source of the chart at the top of this post.) Euromomo is a site that tracks excess mortality in 24 European countries or major regions (non-overlapping), and by my count, 13 of have no or very little excess mortality. And by the way, even this fails to account for a number of other Eastern European nations having low Covid deaths.

Excess mortality is a tricky metric: it cannot be measured with certainty, and almost any measure has conceptual shortcomings. In the case of Covid-19, excess mortality seeks to measure the number of deaths attributable to the virus net of deaths that would have occurred anyway in the absence of the virus. For example, abstracting from some of the details, suppose there are 360 deaths per hundred-thousand of population during the average month of a pandemic. If the “normal” mortality rate is 60 per hundred-thousand, then excess mortality is 300 per month. It can also be expressed as a percentage of the population (0.3% in the example). But that’s just one way to measure it.

In the spirit of Sullum’s article, it’s important to ask what we’re trying to learn from statistics on excess mortality. It’s easy to draw general conclusions if the number of Covid-19 deaths is far in excess of the normal death rate, but that depends on the quality of the data, and any conclusion is subject to limits on its applicability. Covid deaths are not that high in many places. By the same token, if the number of Covid deaths (defined narrowly) is below the normal death rate (measured by an average of prior years), it really conveys little information about whether excess mortality is positive of negative: that depends on the nature of the question. For each of the following I offer admittedly preliminary answers:

  • Are people dying from Covid-19? Of course, virtually everywhere. There is no “normal” death rate here. And while this is the most direct question, it might not be the “best” question.
  • Is Covid-19 causing an increase in respiratory deaths? Yes, in many places, but perhaps not everywhere. Here and below, the answer might depend on the time frame as well.
  • Is Covid-19 increasing deaths from infectious diseases (biological and viral)? Yes, but perhaps not everywhere.
  • Is Covid-19 increasing total deaths from natural causes? Yes, but not everywhere.
  • Is all-cause mortality increasing due to Covid-19? In some places, not others. Accurate global and national numbers are still a long way off.

All-cause mortality is the most “rough and ready” comparison we have, but it includes deaths that have no direct relationship to the disease. For example, traffic fatalities might be down significantly due to social distancing or regulation during a pandemic. Thus, if our purpose is purely epidemiological, traffic fatalities might bias excess mortality downward. On the other hand, delayed medical treatments or personal malaise during a pandemic might lead to higher deaths, creating an upward bias in excess deaths via comparisons based on all-cause mortality.

Do narrow comparisons give a more accurate picture? If we focus only on respiratory deaths then we exclude deaths from other causes and co-morbidities that would have occurred in the absence of the virus. That may create a bias in excess mortality. So narrow comparisons have their drawbacks, depending on our purpose.

That also goes for the length of time over which excess mortality is measured. It can make a big difference. Again, much has been made of the fact that so many victims of Covid-19 have been elderly or already ailing severely before the pandemic. There is no question that some of these deaths would have occurred anyway, which goes to the very point of calculating excess mortality. If the pandemic accelerates death by a matter of weeks or months for a certain percentage of victims, it is reasonable to measure excess mortality over a lengthier period of time, despite the (perhaps) highly valuable time lost by those victims (that being dependent on the decedent’s likely quality of life during the interval).

Conversely, too narrow a window in time can lead to biases that might run in either direction. Yet a cottage industry is busy calculating excess mortality even as we speak with the pandemic still underway. There are many fatalities to come that are excluded by premature calculations of excess mortality. On the other hand, if the peak in deaths is behind us, a narrow window and premature calculation may sharply exaggerate excess mortality.

Narrow measures of excess mortality are affected by the accuracy of cause-of-death statistics. There are always inaccuracies in this data because so many deaths involve multiple co-morbidities, so there is often an arbitrary element in these decisions. For Covid-19, cause-of-death attribution has been extremely problematic. Some cases are easy: those testing positive for the virus, or even its presence immediately after death, and having no other respiratory infections, can fairly be counted as Covid-19 deaths. But apparently just over half of Covid-19 deaths counted by the CDC are “Covid-Only” deaths. A significant share of deaths involve both Covid and the flu, pneumonia, or all three. There are also “probable” Covid-19 deaths now counted without testing. In fact, hospitals and nursing homes are being encouraged to code deaths that way, and there are often strong financial incentives to do so. Many deaths at home, sans autopsy, are now routinely classified as Covid-19 deaths. While I have no doubt there are many Covid deaths of untested individuals both inside or outside of hospitals, there is no question this practice will overcount Covid deaths. Whether you believe that or not, doubts about cause-of-death accuracy is another reason why narrow comparisons can be problematic.

More trustworthy estimates of the coronavirus’ excess mortality will be possible with the passage of time. It’s natural, in the heat of the pandemic, to ask about excess mortality, but such early estimates are subject to tremendous uncertainty. Unfortunately, those calculations are being leveraged and often mis-applied for political purposes. Don’t trust anyone who would use these statistics as a cudgel to deny your Constitutional rights, or otherwise to shame or threaten you.

New York’s Covid experience is not applicable to the country as a whole. Urban mortality statistics are not applicable to areas with lower population densities. Excess mortality for the elderly cannot be used to make broad generalizations about excess mortality for other age groups. And excess mortality at the peak of a pandemic cannot be used to make generalizations about the full course of the pandemic. In the end, I expect Covid-19 excess mortality to be positive, whether calculated by all-cause mortality or more narrow measures. However, it will not be uniform in its impact. Nor will it be of the magnitude we were warned to expect by the early epidemiological models.

Follow Sacred Cow Chips on WordPress.com

Recent Posts

  • The Case Against Interest On Reserves
  • Immigration and Merit As Fiscal Propositions
  • Tariff “Dividend” From An Indigent State
  • Almost Looks Like the Fed Has a 3% Inflation Target
  • Government Malpractice Breeds Health Care Havoc

Archives

  • January 2026
  • December 2025
  • November 2025
  • October 2025
  • September 2025
  • August 2025
  • July 2025
  • June 2025
  • May 2025
  • April 2025
  • March 2025
  • February 2025
  • January 2025
  • December 2024
  • November 2024
  • October 2024
  • September 2024
  • August 2024
  • July 2024
  • June 2024
  • May 2024
  • April 2024
  • March 2024
  • February 2024
  • January 2024
  • December 2023
  • November 2023
  • August 2023
  • July 2023
  • June 2023
  • May 2023
  • April 2023
  • March 2023
  • February 2023
  • January 2023
  • December 2022
  • November 2022
  • October 2022
  • September 2022
  • August 2022
  • July 2022
  • June 2022
  • May 2022
  • April 2022
  • March 2022
  • February 2022
  • January 2022
  • December 2021
  • November 2021
  • October 2021
  • September 2021
  • August 2021
  • July 2021
  • June 2021
  • May 2021
  • April 2021
  • March 2021
  • February 2021
  • January 2021
  • December 2020
  • November 2020
  • October 2020
  • September 2020
  • August 2020
  • July 2020
  • June 2020
  • May 2020
  • April 2020
  • March 2020
  • February 2020
  • January 2020
  • December 2019
  • November 2019
  • October 2019
  • September 2019
  • August 2019
  • July 2019
  • June 2019
  • May 2019
  • April 2019
  • March 2019
  • February 2019
  • January 2019
  • December 2018
  • November 2018
  • October 2018
  • September 2018
  • August 2018
  • July 2018
  • June 2018
  • May 2018
  • April 2018
  • March 2018
  • February 2018
  • January 2018
  • December 2017
  • November 2017
  • October 2017
  • September 2017
  • August 2017
  • July 2017
  • June 2017
  • May 2017
  • April 2017
  • March 2017
  • February 2017
  • January 2017
  • December 2016
  • November 2016
  • October 2016
  • September 2016
  • August 2016
  • July 2016
  • June 2016
  • May 2016
  • April 2016
  • March 2016
  • February 2016
  • January 2016
  • December 2015
  • November 2015
  • October 2015
  • September 2015
  • August 2015
  • July 2015
  • June 2015
  • May 2015
  • April 2015
  • March 2015
  • February 2015
  • January 2015
  • December 2014
  • November 2014
  • October 2014
  • September 2014
  • August 2014
  • July 2014
  • June 2014
  • May 2014
  • April 2014
  • March 2014

Blogs I Follow

  • Passive Income Kickstart
  • OnlyFinance.net
  • TLC Cholesterol
  • Nintil
  • kendunning.net
  • DCWhispers.com
  • Hoong-Wai in the UK
  • Marginal REVOLUTION
  • Stlouis
  • Watts Up With That?
  • Aussie Nationalist Blog
  • American Elephants
  • The View from Alexandria
  • The Gymnasium
  • A Force for Good
  • Notes On Liberty
  • troymo
  • SUNDAY BLOG Stephanie Sievers
  • Miss Lou Acquiring Lore
  • Your Well Wisher Program
  • Objectivism In Depth
  • RobotEnomics
  • Orderstatistic
  • Paradigm Library
  • Scattered Showers and Quicksand

Blog at WordPress.com.

Passive Income Kickstart

OnlyFinance.net

TLC Cholesterol

Nintil

To estimate, compare, distinguish, discuss, and trace to its principal sources everything

kendunning.net

The Future is Ours to Create

DCWhispers.com

Hoong-Wai in the UK

A Commonwealth immigrant's perspective on the UK's public arena.

Marginal REVOLUTION

Small Steps Toward A Much Better World

Stlouis

Watts Up With That?

The world's most viewed site on global warming and climate change

Aussie Nationalist Blog

Commentary from a Paleoconservative and Nationalist perspective

American Elephants

Defending Life, Liberty and the Pursuit of Happiness

The View from Alexandria

In advanced civilizations the period loosely called Alexandrian is usually associated with flexible morals, perfunctory religion, populist standards and cosmopolitan tastes, feminism, exotic cults, and the rapid turnover of high and low fads---in short, a falling away (which is all that decadence means) from the strictness of traditional rules, embodied in character and inforced from within. -- Jacques Barzun

The Gymnasium

A place for reason, politics, economics, and faith steeped in the classical liberal tradition

A Force for Good

How economics, morality, and markets combine

Notes On Liberty

Spontaneous thoughts on a humble creed

troymo

SUNDAY BLOG Stephanie Sievers

Escaping the everyday life with photographs from my travels

Miss Lou Acquiring Lore

Gallery of Life...

Your Well Wisher Program

Attempt to solve commonly known problems…

Objectivism In Depth

Exploring Ayn Rand's revolutionary philosophy.

RobotEnomics

(A)n (I)ntelligent Future

Orderstatistic

Economics, chess and anything else on my mind.

Paradigm Library

OODA Looping

Scattered Showers and Quicksand

Musings on science, investing, finance, economics, politics, and probably fly fishing.

  • Subscribe Subscribed
    • Sacred Cow Chips
    • Join 128 other subscribers
    • Already have a WordPress.com account? Log in now.
    • Sacred Cow Chips
    • Subscribe Subscribed
    • Sign up
    • Log in
    • Report this content
    • View site in Reader
    • Manage subscriptions
    • Collapse this bar
 

Loading Comments...