It happens every summer! It’s been hot, and the news media and professional grifters in the anti-carbon climate-change establishment want us to panic about it. Granted, the weather really was quite hot for several weeks in July across parts of the U.S., Europe, and elsewhere, but it’s cooled off considerably since then, especially in my neck of the woods.
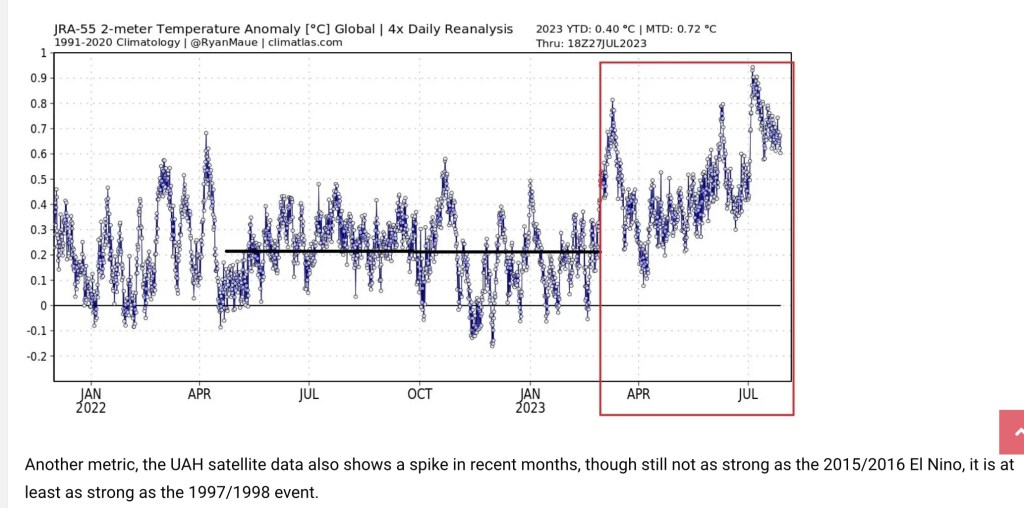
July is typically the warmest month of the year, and July 2023 was the warmest July for the troposphere on the satellite record. (The troposphere is the lowest 13 km of the atmosphere, but that’s an average — it’s thicker toward equatorial latitudes, thinner toward the poles.) However, attribution of this summer’s heat waves to carbon-induced climate change is misplaced. What follows are a few considerations in evaluating this claim, and the lengths to which climate activists go to distort weather data and reporting.
The Biggest Greenhouse Gas
One speculative explanation for the recent heat wave has gained some traction: the eruption of the Hunga Tonga-Hunga Ha’apai volcano in the South Pacific on Jan. 15, 2022 (and see here). This underwater eruption spewed massive quantities of water vapor into the stratosphere, which encircled the globe in fairly short order. Water vapor acts as a greenhouse gas, and it is by far the most important greenhouse gas. This plume of vapor may have affected the climate with a delay, and it is not expected to dissipate for at least a couple of years. However, there are theories that the eruption might have led to some offsetting effects due to the reflective properties of water and ice in the stratosphere. See here for an interesting debate on the estimated effects of this “shock” to the atmosphere.
NASA has estimated that the Hunga Tonga eruption resulted in a 10% increase in atmospheric water vapor, while the European Space Agency puts the increase at 13%. Now, in addition to this added water vapor, we have the early effects of an El Niño event in the Pacific, which may elevate temperatures over the next couple of years.
However, the temperatures in July simply don’t justify the claim that we’re experiencing “unprecedented” warmth. The satellite records go back only to 1979, which is an especially narrow window on climatological scales. The longer record of temperatures shows earlier periods of higher temperatures, For example, U.S. surface temperature records indicate that the 1930s had periods warmer than this July. Moreover, while estimates of paleo-climate data are a matter of great dispute, there is no question that the globe has experienced warmer temperatures in the past, with an ice-free Arctic.
So, was July 3 really the hottest day in history? No way, and the worst part of this warm spell wasn’t even the warmth. Rather, it was the attempts to make weather a political matter, as if public policymakers possess some kind of control knob over weather phenomena, or as if we should bestow upon them dictatorial powers to act on their fantasy.
Longer Trends
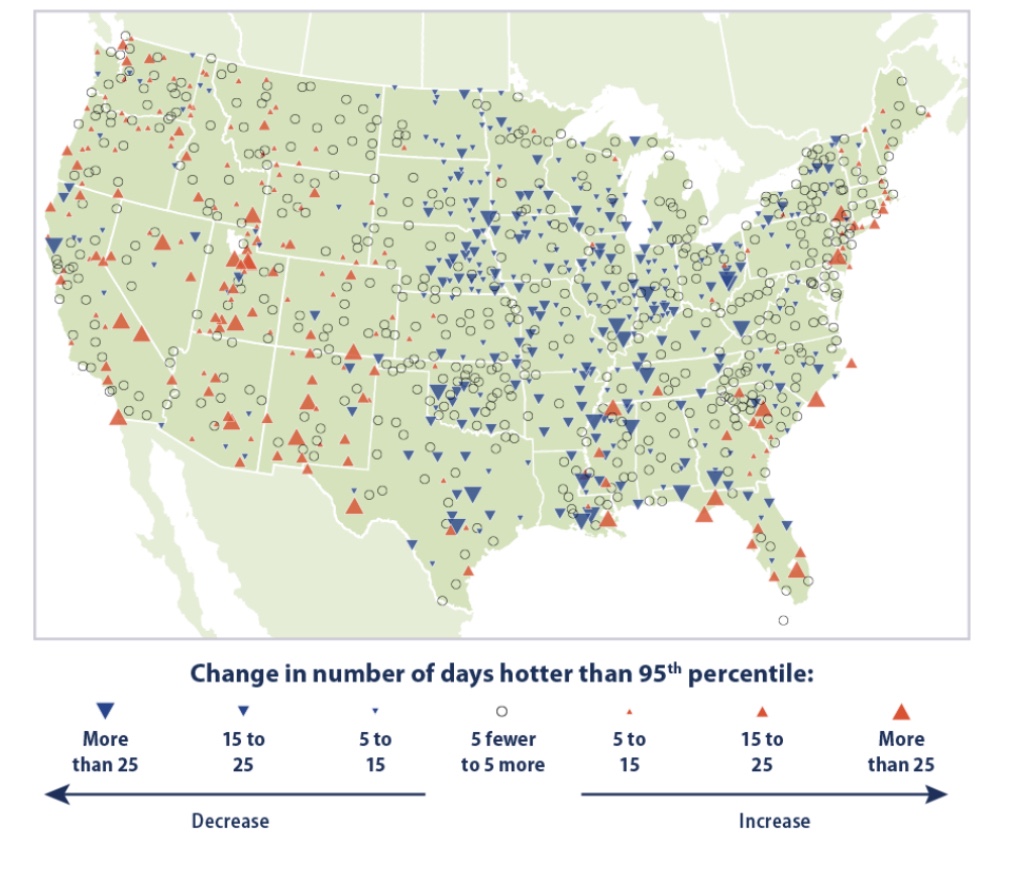
There’s plenty of other evidence running contrary to the “hotter-than-any-time in-history” foolishness. Take a look at trends in hot and cool weather from individual U.S. weather stations over a somewhat longer time span than the satellite record. The red symbols shown on the map below mark stations reporting increases in the number of unusually hot days (heat in the 95th percentile) between 1948 – 2020, with larger symbols corresponding to greater increases in extremely hot days. The blue symbols mark stations reporting increases in the number of unusually cool days (in the 5th percentile) over the same period. The data in this chart is published by the EPA, and it is definitely not alarming.
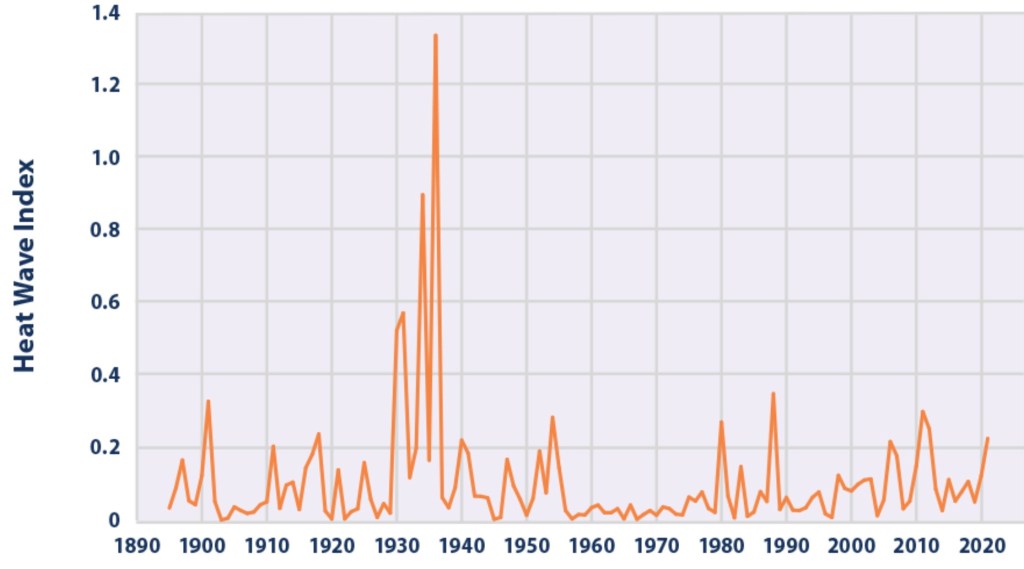
The next chart shows the so-called Heat Wave Index produced by the EPA. Recent spikes in the index are muted relative to the Dust Bowl days of the 1930s.
Journalism or Exaggeration?
Reports of hot weather in Europe have been distorted as well, often placing more emphasis on forecasts of high temperatures than on the temperatures themselves. It’s almost as if authorities, with the aid of the news media and naive weather reporters, are determined to raise an exaggerated sense of alarm among the citizenry. Almost?
Cold 10x Deadlier Than Heat
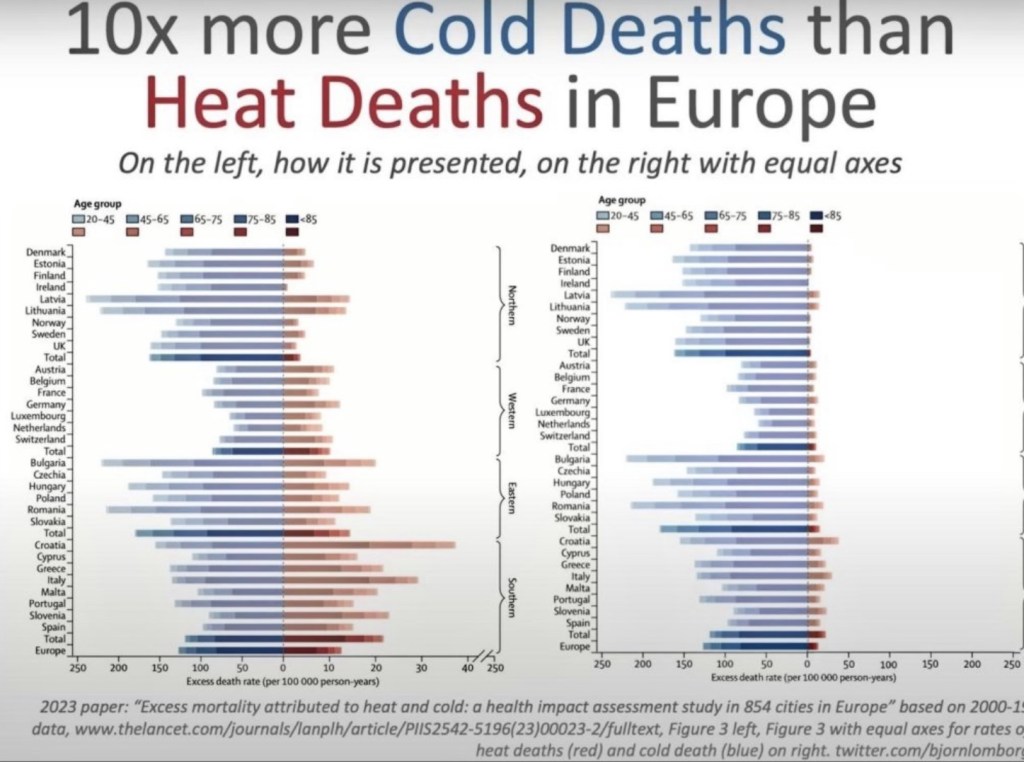
The next chart vividly illustrates an attempt to propagandize climate misinformation. Take a look at the left side of this illustration, which appeared in the medical journal Lancet. Note the difference in the horizontal scale for heat deaths vs. cold deaths. The chart on the right side uses equivalent scales for heat vs. cold deaths. This should qualify the journal for some kind of award for mendacity, or perhaps sheer stupidity. It’s the cold that really kills, not the heat! I’m moving south!
Finding Hot Water
And here’s a take-down of some incredible water temperature propaganda. A PBS News Hour reporter has pushed claims that South Florida water temperatures reached 101 degrees this summer. The emphasis on a single reading was taken from a buoy not subject to the cooling effects of deep water circulation, and it is located where fresh water often overlays salt water, which traps heat. Data from other buoys not far away showed much lower temperatures.
Spreads Like Wildfire
Another fallacious claim we hear too often is that global warming is literally causing the world to go up in flames. The facts run contrary to these scare stories. Björn Lomborg notes the following:
“For more than two decades, satellites have recorded fires across the planet’s surface. The data are unequivocal: Since the early 2000s, when 3% of the world’s land caught fire, the area burned annually has trended downward.
“In 2022, the last year for which there are complete data, the world hit a new record-low of 2.2% burned area. Yet you’ll struggle to find that reported anywhere.”
The heavy focus by the media on this year’s wild fires in North America offers a perfect example of the media’s tendency to “cherry pick for clicks”. Africa and Europe have had little burning this year, and in North America, arson has played a conspicuous role (and see here) in the wildfires.
Distorted Measurements
Personally, I have trouble accepting claims that temperatures are any warmer now than they were in my youth, at least where I grew up. My subjective and local assessment aside, there are strong reasons to doubt the reliability and significance of trends in official temperature records. The urban heat-island effect has distorted temperatures by ever greater magnitudes, as growing metropolitan areas absorb heat readily compared to rural green space.
Furthermore, poor siting of weather stations and temperature gauges has become all too common. This includes equipment located at airports and other areas in close proximity to asphalt or concrete. This contributes to an upward bias in more recent temperature data. It’s also worth noting in this context that satellite temperature readings must be calibrated periodically to surface temperatures. If the latter are corrupted in any way, the satellite readings may be corrupted as well.
“Adjusting” the Past
Official historical records also include a variety of “adjustments” to temperature data that raise concerns. Ostensibly, these adjustments are justified by an interest in maintaining a consistent historical record. Changes in equipment or it’s exact location can create discontinuities, for example. Unfortunately, the adjustments appear to have had a systematic tendency to “cool the past” relative to more recent data. This reinforcement of the warming trend over the past few decades is suspicious, to say the least. It does very little to build confidence in the agencies responsible for these records.
Conclusion
The hot temperatures in July brought the usual deluge of propaganda, including distortions in the reporting of weather phenomena. And we hear increasing calls to force transition to EVs (which are powered mostly by fossil-fuel electric plants), subsidize intermittent renewable power sources, and to end the use of air conditioning and gas stoves. Yet these coercive measures would do nothing to prevent summer heat or climate change generally. Water vapor represents 95% of greenhouse gases, and the huge vapor shock from the Hunga Tonga eruption might well make us prone to warmer temperatures for at least some months to come, mixed with signals from the Pacific El Niño pattern. But these are not evidence of a man-made crisis, despite perverse cheers from those rooting for more draconian state intrusions and an end to growth, or indeed, a reversal in gains to human well being.
Note: I’m moving for the first time in many years. We have a lot to do quickly because we’ll close on our new home in early September. It’s in a place with palm trees, but no basements! The clean-up and winnowing of our accumulated papers, possessions, and … junk — not to mention attending to all the details of the move — is taking up all of my time. Anyway, I started the post below a week ago and had to put it aside. Not sure how frequently I’ll be posting till we’re fully settled in the fall, but we’ll see how it goes.
____________________________________________
The inflation news was great last week, with both the Consumer Price Index (CPI) and the Producer Price Index (PPI) reported below expectations. Month-over-month, the increase in the overall CPI was just 0.2%. Year-over-year, CPI inflation was 3%, down from 9% a year ago. Of course, contrary to Joe Biden’s ridiculous claims, this inflation news came despite, and not because of, the pernicious effects of “Bidenomics”. But that aside, just like that, we heard proclamations that the Federal Reserve had finally succeeded in bringing real short-term interest rates into positive territory. Finally, some said, Fed policy had moved into more restrictive territory. But in fact, real rates moved above zero months ago.
The popular rate narrative is based on the fact that the effective Fed Funds rate is now 5.08% while “headline” CPI inflation fell to 2.97%. That would give us a real Fed Funds rate of 3.11%… if that sort of calculation made sense. Here’s an appropriate reaction from Kevin Erdman:
“The short term rate minus trailing 12 month inflation is not a thing. It’s an irrelevant number. Nothing about June 2022 inflation has anything to do with the real fed funds rate in July 2023.”
His statement generalizes to interest rates at any maturity less a corresponding measure of trailing inflation. They are all irrelevant. A proper real rate of interest must incorporate a measure of inflation expectations. Survey data is often used for this purpose, but a better measure can be taken from market expectations by comparing a nominal Treasury rate with a rate on an inflation-indexed Treasury (TIPS) of the same maturity. This is a fairly convenient approach.
Below, we can see that the real one-year Treasury rate has been positive since last November.
And here is the real one-month Treasury rate:
Again, these charts suggest that real short-term rates have been positive much longer than some believe. Whether that represents a “restrictive policy stance” by the Federal Reserve is another matter. We know the Fed has tightened policy, but that began after the notably loose policy conducted throughout the pandemic. Have we truly crossed the threshold into “tightness”?
Here’s the effective (nominal) federal funds rate over the past year.
This rate is under fairly direct control by the Fed, and it is the primary focus of most Fed watchers. It’s an overnight lending rate on loans of reserves between banks, so to adjust it precisely for expected inflation requires an annualized, overnight inflation rate. That’s pretty tricky!
Finding a published measure of expected inflation over durations of less than a year forward is difficult. One can derive one or use a longer-term rate of expected inflation as a proxy, with the proviso that near-term expectations might be more extreme than the proxy, especially if inflation is expected to change from its current pace. Here are one-year inflation expectations over the past year from a Cleveland Fed model that utilizes TIPS returns and other data.
So inflation expectations have declined substantially. If we compare them with short-term interest rates or the effective fed funds rate over the past year, it’s likely the real fed funds rate climbed above zero before the end of the first quarter of 2023. It might even have exceeded the so called “neutral” real Fed funds rate (R*), which was estimated by the Fed to be 1.14% in the first quarter of 2023. A real Fed funds rate above that level would have been deemed restrictive in the first quarter.
My own view is that changes in the Fed funds rate are not at the heart of the transmission mechanism from monetary policy to the real economy. The monetary aggregates are more reliable guides. The broad money stock M2 has been edging lower for well over a year now. That certainly qualifies as a restrictive move, but there is still a lot of excess liquidity out there, left over from the pandemic deluge engineered by the Fed.
The good reports last week might not mark the end of the inflation problem. There are still price pressures fromboth the demand and supply-sides. Furthermore, to put things in context, the month-to-month increases in May and June of last year were large, which helped to hold down the 12-month increases this May and June. But the CPI was flat during the second half of last year. That means month-to-month inflation over the next six months may well translate into an escalation of year-over-year inflation. That might or might not be turn out to be meaningful, but it would provide a pretext for additional Fed tightening.
The main point of this post is that real interest rates cannot be calculated on the basis of reported inflation over prior months. Doing so at this juncture understates the degree of monetary tightening in terms of short-term rates. Real interest rates can only be determined by nominal rates relative to expectations of future inflation. This gives a more accurate picture of actual credit market conditions and the Fed’s rate policy stance.
We’re told again and again that government must take action to correct “market failures”. Economists are largely responsible for this widespread view. Our standard textbook treatments of external costs and benefits are constructed to demonstrate departures from the ideal of perfectly competitive market equilibria. This posits an absurdly unrealistic standard and diminishes the power and dramatic success of real-world markets in processing highly dispersed information, allocating resources based on voluntary behavior, and raising human living standards. It also takes for granted the underlying institutional foundations that lead to well-functioning markets and presumes that government possesses the knowledge and ability to rectify various departures from an ideal. Finally, “corrective” interventions are usually exposited in economics classes as if they are costless!
Failed Disgnoses
This brings into focus the worst presumption of all: that government solutions to social and economic problems never fail to achieve their intended aims. Of course that’s nonsense. If defined on an equivalent basis, government failure is vastly more endemic and destructive than market failure.
“According to ancient legend, a Roman emperor was asked to judge a singing contest between two participants. After hearing the first contestant, the emperor gave the prize to the second on the assumption that the second could be no worse than the first. Of course, this assumption could have been wrong; the second singer might have been worse. The theory of market failure committed the same mistake as the emperor. Demonstrating that the market economy failed to live up to the ideals of general competitive equilibrium was one thing, but to gleefully assert that public action could costlessly correct the failure was quite another matter. Unfortunately, much analytical work proceeded in such a manner. Many scholars burst the bubble of this romantic vision of the political sector during the 1960s. But it was [James] Buchanan and Gordon Tullock who deserve the credit for shifting scholarly focus.”
John Cochrane sums up the whole case succinctly in the “punchline” of a recent post:
“The case for free markets never was their perfection. The case for free markets always was centuries of experience with the failures of the only alternative, state control. Free markets are, as the saying goes, the worst system; except for all the others.”
Tracing Failures
We can view the relation between market failure and government failure in two ways. First, we can try to identify market failures and root causes. For example, external costs like pollution cause harm to innocent third parties. This failure might be solely attributable to transactions between private parties, but there are cases in which government engages as one of those parties, such as defense contracting. In other cases government effectively subsidizes toxic waste, like the eventual disposal of solar panels. Another kind of market failure occurs when firms wield monopoly power, but that is often abetted by costly regulations that deliver fatal blows to small competitors.
The second way to analyze the nexus between government and market failures is to first examine the taxonomy of government failure and identify the various damages inflicted upon the operation of private markets. That’s the course I’ll follow below, though by no means is the discussion here exhaustive.
Failures In and Out of Scope
An extensive treatment of government failure was offered eight years ago by William R. Keech and Michael Munger. To start, they point out what everyone knows: governments occasionally perpetrate monstrous acts like genocide and the instigation of war. That helps illustrate a basic dichotomy in government failures:
“… government may fail to do things it should do, or government may do things it should not do.’
Both parts of that statement have numerous dimensions. Failures at what government should do run the gamut from poor service at the DMV, to failure to enforce rights, to corrupt bureaucrats and politicians skimming off the public purse in the execution of their duties. These failures of government are all too common.
What government should and should not do, however, is usually a matter of political opinion. Thomas Jefferson’s axioms appear in a single sentence at the beginning of the Declaration of Independence; they are a tremendous guide to the first principles of a benevolent state. However, those axioms don’t go far in determining the range of specific legal protections and services that should and shouldn’t be provided by government.
Pareto Superiority
Keech and Munger engage in an analytical exercise in which the “should and shouldn’t” question is determined under the standard of Pareto superiority. A state of the world is Pareto superior if at least one person prefers it to the current state (and no one else is averse to it). Coincidentally, voluntary trades in private markets always exploit Pareto superior opportunities, absent legitimate external costs and benefits.
The set of Pareto superior states available to government can be expanded by allowing for side payments or compensation to those who would have preferred the current state. Still, those side payments are limited by the magnitude of the gains flowing to those who prefer the alternative (and if those gains can be redistributed monetarily).
Keech and Munger define government failure as the unexploited existence of Pareto superior states. Of course, by this definition, only a benevolent, omniscient, and omnipotent dictator could hope to avoid government failure. But this is no more unrealistic than the assumptions underlying perfectly competitive market equilibrium from which departure are deemed “market failures” that government should correct. Thus, Keech and Munger say:
“The concept of government failure has been trapped in the cocoon of the theory of perfect markets. … Government failure in the contemporary context means failing to resolve a classic market failure.”
But markets must operate within a setting defined by culture and institutions. The establishment of a social order under which individuals have enforceable rights must come prior to well-functioning markets, and that requires a certain level of state capacity. Keech and Munger are correct that market failure is often a manifestation of government failure in setting and/or enforcing these “rules of the game”.
“The real question is … how the rules of the game should be structured in terms of incentives, property rights, and constraints.”
The Regulatory State and Market Failures
Government can do too little in defining and enforcing rights, and that’s undoubtedly a cause of failure in markets in even the most advanced economies. At the same time there is an undeniable tendency for mission creep: governments often try to do too much. Overregulation in the U.S. and other developed nations creates a variety of market failures. This includes the waste inherent in compliance costs that far exceed benefits; welfare losses from price controls, licensing, and quotas; diversion of otherwise productive resources into rent seeking activity, anti-competitive effects from “regulatory capture”; Chevron-like distortions endemic to the administrative judicial process; unnecessary interference in almost any aspect of private business; and outright corruption and bribe-taking.
Central Planning and Market Failures
Another category of government attempting to “do too much” is the misallocation of resources that inevitably accompanies efforts to pick “winners and losers”. The massive subsidies flowing to investors in various technologies are often misdirected. Many of these expenditures end up as losses for taxpayers, and this is not the only form in which failed industrial planning takes place. A related evil occurs when steps are taken to penalize and destroy industries in political disfavor with thin economic justification.
Other clear examples of government “planning” failure are protectionist laws. These are a net drain on our wealth as a society, denying consumers of free choice and saddling the country with the necessity to produce restricted products at high cost relative to erstwhile trading partners.
There are, of course, failures lurking within many other large government spending programs in areas such as national defense, transportation, education, and agriculture. Many of these programs can be characterized as centrally planning. Not only are some of these expenditures ineffectual, but massive procurement spending seems to invite waste and graft. After all, it’s somebody else’s money.
Redistribution and Market Failures
One might regard redistribution programs as vehicles for the kinds of side payments described by Keech and Munger. Some might even say these are the side payments necessary to overcome resistance from those unable to thrive in a market economy. That reverses the historical sequence of events, however, since the dominant economic role of markets preceded the advent of massive redistribution schemes. Unfortunately, redistribution programs have been plagued by poor design, such as the actuarial nightmare inherent in Social Security and the destructive work incentives embedded in other parts of the social safety net. These are rightly viewed as government failures, and their distortionary effects spill variously into capital markets, labor markets and ultimately product markets.
Taxation and Market Failures
All these public initiatives under which government failures precipitate assorted market failures must be paid for by taxpayers. Therefore, we must also consider the additional effects of taxation on markets and market failures. The income tax system is rife with economic distortions. Not only does it inflict huge compliance costs, but it alters incentives in ways that inhibit capital formation and labor supply. That hampers the ability of input markets to efficiently meet the needs of producers, inhibiting the economy’s productive capacity. In turn, these effects spill into output market failures, with consequent losses in .social welfare. Distortionary taxes are a form of government failure that leads to broad market failures.
Deficits and Market Failure
More often than not, of course, tax revenue is inadequate to fund the entire government budget. Deficit spending and borrowing can make sense when public outlays truly produce long-term benefits. In fact, the mere existence of “risk-free” assets (Treasury debt) across the maturity spectrum might enhance social welfare if it enables improvements in portfolio diversification that outweigh the cost of the government’s interest obligations. (Treasury securities do bear interest-rate risk and, if unindexed, they bear inflation risk.)
Nevertheless, borrowing can reflect and magnify deleterious government efforts to “do too much”, ultimately leading to market failures. Government borrowing may “crowd out” private capital formation, harming economy-wide productivity. It might also inhibit the ability of households to borrow at affordable rates. Interest costs of the public debt may become explosive as they rise relative to GDP, limiting the ability of the public sector to perform tasks that it should *actually* do, with negative implications for market performance.
Inflation and Market Failure
Deficit spending promotes inflation as well. This is more readily enabled when government debt is monetized, but absent fiscal discipline, the escalation of goods prices is the only remaining force capable of controlling the real value of the debt. This is essentially the inflation tax.
Inflation is a destructive force. It distorts the meaning of prices, causes the market to misallocate resources due to uncertainty, and inflicts costs on those with fixed incomes or whose incomes cannot keep up with inflation. Sadly, the latter are usually in lower socioeconomic strata. These are symptoms of market failure prompted by government failure to control spending and maintain a stable medium of exchange.
Conclusion
Markets may fail, but when they do it’s very often rooted in one form of government failure or another. Sometimes it’s an inadequacy in the establishment or enforcement of property rights. It could be a case of overzealous regulation. Or government may encroach on, impede, or distort decisions regarding the provision of goods or services best left to the market. More broadly, redistribution and taxation, including the inflation tax, distort labor and capital markets. The variety of distortions created when government fails at what it should do, or does what it shouldn’t do, is truly daunting. Yet it’s difficult to find leaders willing to face up to all this. Statism has a powerful allure, and too many elites are in thrall to the technocratic scientism of government solutions to social problems and central planning in the allocation of resources.
Tweaks to the projected costs and benefits of prospective regulations or programs can be a great way to encourage domination of resources and society by the state. Of course, public policy ideas will never receive serious consideration unless their “expected” benefits exceed costs. It’s therefore critical that the validity of cost and benefit estimates — to say nothing of their objectivity — are always subject to careful review. By no means does that ensure that the projections are reasonable, however.
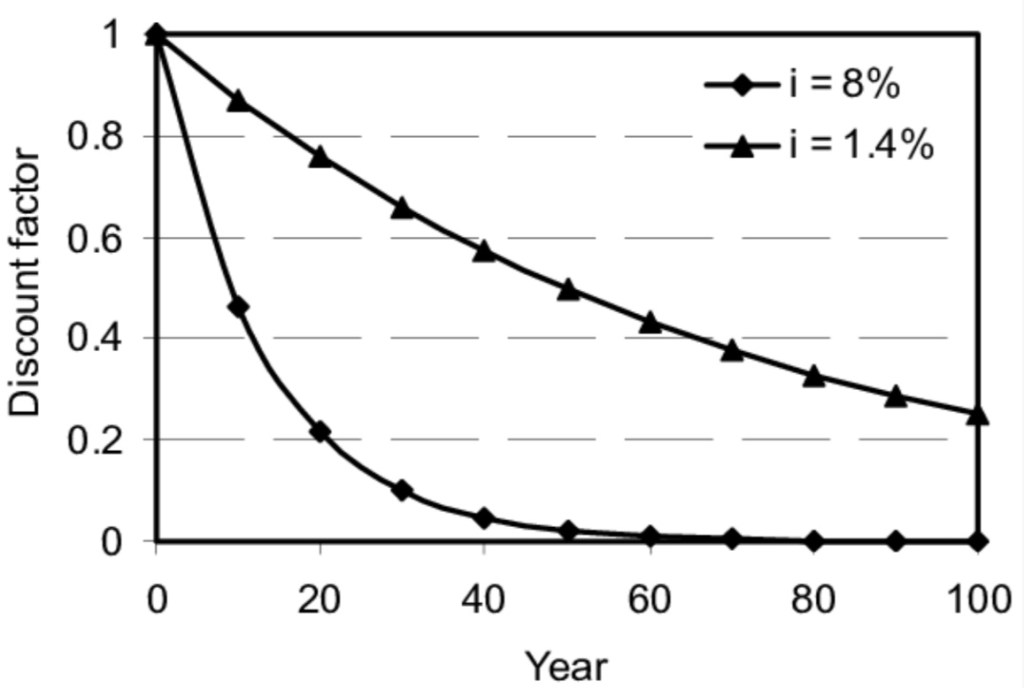
Traditionally less scrutinized is the rate at which the future costs and benefits of a program or regulation are discounted into present value terms. The discount rate can have a tremendous impact on the comparison of costs and benefits when their timing differs significantly, which is usually the case.
Intertemporal Tradeoffs
People generally aren’t willing to forsake present pleasure without at least a decentprospect of future gain. Thus, we observe that the deferral of $1 of consumption today generally brings a reward of more than $1 of future consumption. That’s made possible by the existence of productive opportunities for the use of resources. These opportunities, and the freedom to exploit them, allow a favorable tradeoff at which we transform resources across time for the benefit of both our older selves and our progeny. The interaction of savers and investors in such opportunities results in an equilibrium interest rate balancing the supply and demand for saving.
We can restate the tradeoff to demonstrate the logic of discounting. That is, the promise of $1 in the future induces the voluntary deferral of less than $1 of consumption today. To arrive at the amount of the deferral, the promised $1 in the future is discounted at the consumer’s rate of time preference. The promised $1 must cover the initial deferral of consumption plus the consumer’s perceived opportunity cost of lost consumption in the present, or else the “trade” won’t happen.
Discounting practices are broadly embedded in the economy. They provide a rational basis of evaluating inter-temporal tradeoffs. The calculation of net present values (NPVs) and internal rates of return (the discount rate at which NPV = 0) are standard practices for capital budgeting decisions in the private sector. Public-sector cost-benefit analysis often makes use of discounting methodology as well, which is unequivocally good as long as the process is not rigged.
Government Discounting
The Office of Management and Budget (OMB) provides guidance to federal agencies on matters like cost-benefit analysis. As part of a recent proposal that was prompted by executive orders on “Modernizing Regulatory Review” from the Biden Administration, the OMB has recommended revisions to a 2003 Circular entitled “Regulatory Analysis”. A major aspect of the proposal is a downward adjustment to recommended discount rates, largely dressed up as an update for “changes in market conditions”.
Since 2003, the OMB’s guidance on discount rates called for use of a historical average rate on 10-year government bonds. Before averaging, the rate was converted to a “real rate” in each period by subtracting the rate of increase in the Consumer Price Index (CPI). The baseline discount rate of 3% was taken from the average of that real rate over the 30 years ending in 2002. There has been an alternative discount rate of 7% under the existing guidance intended as a nod to the private costs of capital, but it’s not clear how seriously agencies took this higher value.
The new proposal seeks to update the calculation of recommended discount rates by using more recent data on Treasury rates and inflation. One aspect of the proposal is to utilize the rate on 10-year inflation-indexed Treasury bonds (TIPS) for the years in which it is available (2003-2022). The first ten years of the “new” 30-year average would use the previous methodology. However, the proposal gives examples of how other methods would change the resulting discount rate and requests comments on the most appropriate method of updating the calculation of the 30-year average.
The new baseline discount rate proposed by OMB is 1.7%, and it is lower still for very distant flows of benefits. This is intended as a real, after-tax discount rate on Treasury bonds. It represents an average (and ex post) risk-free rate on bonds held to maturity over the historical period in question, calculated as described by OMB. However, like the earlier guidance, it is not prospective in any sense. And of course it is quite low!
Our Poor Little Rich Ancestors
The projected benefits of regulations or other public initiatives can be highly dubious in the first place. Unintended consequences are the rule rather than the exception. Furthermore, even modest economic growth over several generations will leave our ancestors with far more income and wealth than we have at our disposal today. That means their ability to adapt to changes will be far superior, and they will have access to technologies making our current efforts seem quaint.
Now here’s the thing: discounting the presumed benefits of government intervention at a low rate would drastically inflate their present value. John Cochrane uses an extreme case to illustrate the point. Suppose a climate policy is projected to avoid costs equivalent to 5% of GDP 100 years from now. Those avoided costs would represent a gigantic sum! By then, at just 2% growth, real GDP will be over seven times larger than this year’s output. Cochrane calculates that 5% of real GDP in 2123 is equivalent to 37% of 2023 real GDP. And the presumed cost saving goes on forever.
We can calculate the present value of the climate policy’s benefits to determine whether it’s greater than the proposed cost of the policy. Let’s choose a fairly low discount rate like … oh, say zero. In that case, the present value is infinite, and it is infinite at any discount rate below 2% (such as 1.7%). That’s because the benefits grow at 2% (like real GDP) and go on forever! That’s faster than the diminishing effect of discounting on present value. In mathematical terms, the series does not converge. Of course, this is not discounting. It is non-discounting. Cochrane’s point, however, is that if you take these calculations seriously, you’d be crazy not to implement the policy at any finite cost! You shouldn’t mind the new taxes at all! Or the inflation tax induced by more deficit spending! Or higher regulatory costs passed along to you as a consumer! So just stop your bitching!
Formal Comments to OMB
If Cochrane’s example isn’t enough to convince you of the boneheadedness of the OMB proposal, there are several theoretical reasons to balk. Cochrane provides links to a couple of formal comments submitted to OMB. Joshua Rauh of the Stanford Business School details a few fundamental objections. His first point is that a regulatory impact analysis (RIA), or the evaluation of any other initiative, “should be based on market conditions that prevail at the time of the RIA”. In other words, the choice of a discount rate should not rely on an average over a lengthy historical period. Second, it is unrealistic to assume that the benefits and costs of proposed regulations are risk-free. In fact, unlike Treasury securities, these future streams are quite risky, and they are not tradable, and they are not liquid.
Rauh also notes that the OMB’s proposed decline in discount rates to be applied to benefits or cash flows in more distant periods has no reliable empirical basis. He believes that results based on a constant discount rate should at least be reported. Moreover, agencies should be required to offer justification for their choice of a discount rate relative to the risks inherent in the streams of costs and benefits on any new project or rule.
Rauh is skeptical of recommendations that agencies should add a theoretical risk premium to a risk-free rate, however, despite the analytical superiority of that approach. Instead, he endorses the simplicity of the OMB’s previous guidance for discount rates of 3% and 7%. But he also proposes that RIAs should always include “the complete undiscounted streams of both benefits and costs…”. If there are distributions of possible cost and benefit streams, then multiple streams should be included.
Furthermore, Rauh says that agencies should not recast streams of benefits in the form of certainty equivalents, which interpose various forms of objective functions in order to calculate a “fair guarantee”, rather than a range of actual outcomes. Instead, Rauh insists that straightforward expected values should be used, This is for the sake of transparency and to enable independent assessment of RIAs.
Another comment on the OMB proposal comes from a group of economists at MIT. They have fewer qualms than Rauh regarding the use of risk-adjusted discount rates by government agencies. In addition, they note that risk in the private sector can often be ameliorated by diversification, whereas risks inherent in public policy must be absorbed by changes in taxes, government spending, or unintended costs inflicted on the private sector. Taxpayers, those having stakes in other programs, and the general public bear these risks. Using Treasury rates for discounting presumes that bad outcomes have no cost to society!
Conclusion
Discounting the costs and benefits of proposed regulations and other government programs should be performed with discount rates that reflect risks. Treasury rates are wholly inappropriate as they are essentially risk-free over time horizons often much shorter than the streams of benefits and costs to be discounted. The OMB proposal might be a case of simple thoughtlessness, but I doubt it. To my mind, it aligns a little too neatly with the often expansive agenda of the administrative state. It would add to what is already a strong bias in favor of regulatory action and government absorption of resources. Champions of government intervention are prone to exaggerate the flow of benefits from their pet projects, and low discount rates exaggerate the political advantages they seek. That bias comes at the expense of the private sector and economic growth, where inter-temporal tradeoffs and risks are exploited only at more rational discounts and then tested by markets.
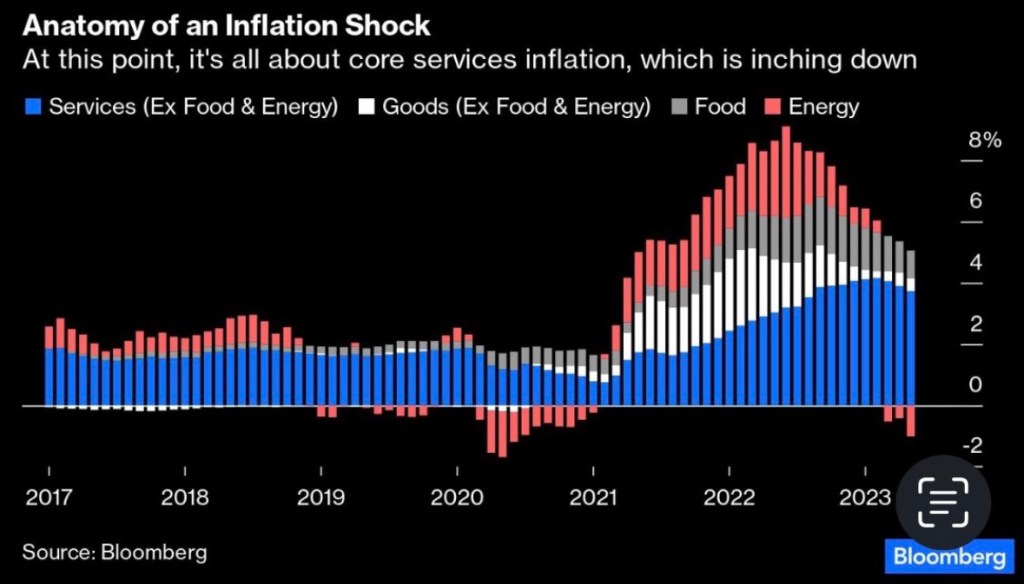
The inflation news was good last week, with both the consumer and producer price indices (CPI and PPI) for May coming in below expectations. The increase in the core CPI, which excludes food and energy prices, was the same as in April. Asthis series of tweets attempts to demonstrate, teasing out potential distortions from the shelter component of the CPI shows a fairly broad softening. That might be heartening to the Federal Reserve, though at 4.0%, the increase in the CPI from a year ago remains too high, as does the core rate at 5.3%. Later in the month we’ll see how much the Fed’s preferred inflation gauge, the PCE deflator, exceeds the 2% target.
Inflation has certainly tapered since last June, when the CPI had its largest monthly increase of this cycle. After that, the index leveled off to a plateau lasting through December. But the big run-up in the CPI a year ago had the effect of depressing the year-over-year increase just reported, and it will tend to depress next month’s inflation report as well. After this June’s CPI (to be reported in July), the flat base from a year earlier might have a tendency to produce rising year-over-year inflation numbers over the rest of this year. Also, the composition of inflation has shifted away from goods prices and into services, where markets aren’t as interest-rate sensitive. Therefore, the price pressure in services might have more persistence.
So it’s way too early to say that the Fed has successfully brought inflation under control, and they know it. But last week, for the first time in 10 meetings, the Fed’s chief policy-making arm (the Federal Open Market Committee, or FOMC) did not increase its target for the federal funds rate, leaving it at 5% for now. This “pause” in the Fed’s rate hikes might have more to do with internal politics than anything else, as new Vice Chairman Philip Jefferson spoke publicly about the “pause” several days before the meeting. That statement might not have been welcome to other members of the FOMC. Nevertheless, at least the pause buys some time for the “long and variable lags” of earlier monetary tightening to play out.
There are strong indications that the FOMC expects additional rate hikes to be necessary in order to squeeze inflation down to the 2% target. The “median member” of the Committee expects the target FF rate to increase by an additional 50 basis points by the end of 2023. At a minimum, it seems they felt compelled to signal that later rate hikes might be necessary after having their hand forced by Jefferson. That “expectation” might have been part of a “political bargain” struck at the meeting.
In addition, the Fed’s stated intent is to continue drawing down its massive securities portfolio, an act otherwise known as “quantitative tightening” (QT). That process was effectively interrupted by lending to banks in the wake of this spring’s bank failures. And now, a danger cited by some analysts is that a wave of Treasury borrowing following the increase in the debt ceiling, along with QT, could at some point lead to a shortage of bank reserves. That could force the Fed to “pause” QT, essentially allowing more of the new Treasury debt to be monetized. This isn’t an imminent concern, but perhaps next year it could present a test of the Fed’s inflation-fighting resolve.
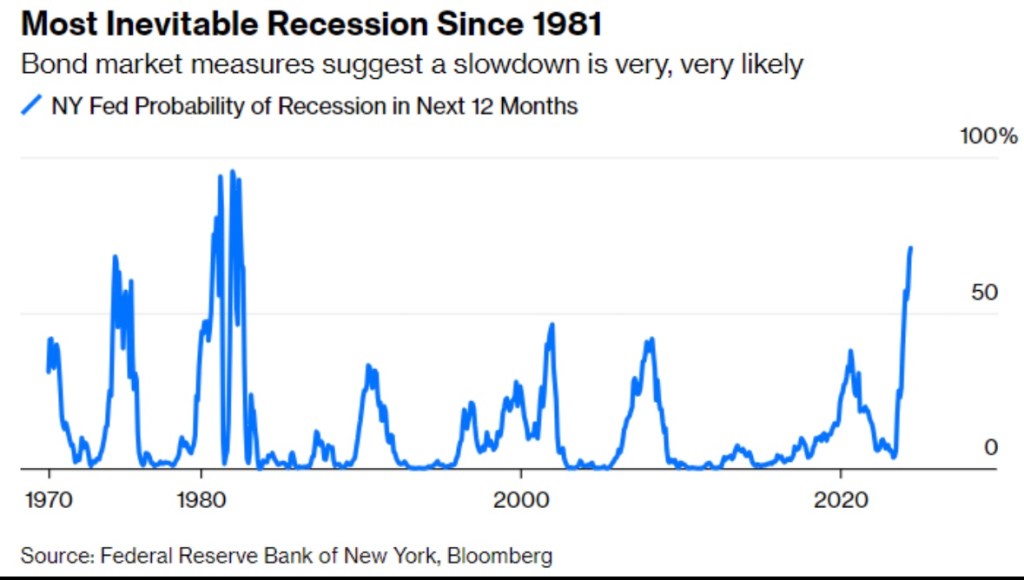
It’s certainly too early to declare that the Fed has engineered a “soft landing”, avoiding recession while successfully reigning-in inflation. The still-inverted yield curve is the classic signal that credit markets “expect” a recession. Here is the New York Federal Reserve Bank’s recession probability indicator, which is at its highest level in over 40 years:
There are other signs of weakness: the index of leading economic indicators has moved down for the last 13 months, real retail sales are down from 13 months ago, and real average weekly earnings have been trending down since January, 2021. A real threat is the weakness in commercial real estate, which could renew pressure on regional banks. Credit is increasingly tight, and that is bound to take a toll on the real economy before long.
The labor market presents its own set of puzzles. The ratio of job vacancies to job seekers has declined, but it is still rather high. Multiple job holders have increased, which might be a sign of stress. Some have speculated that employers are “hoarding” labor, hedging against the advent of an ultimate rebound in the economy, when finding new workers might be a challenge.
Despite some high-profile layoffs in tech and financial services, job gains have held up well thus far. Of course, the labor market typically lags turns in the real economy. We’ve seen declining labor productivity, consistent with changes in real earnings. This is probably a sign that while job growth remains strong, we are witnessing a shift in the composition of jobs from highly-skilled and highly-paid workers to lower-paid workers.
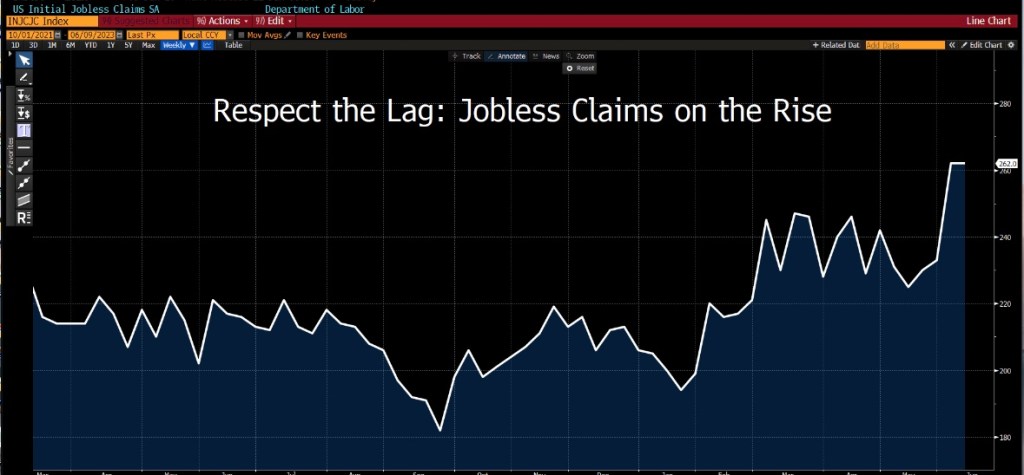
A further qualification is that many of the most highly-qualified job applicants are already employed, and are not part of the pool of idle workers. It’s also true that jobless claims, while not at alarming levels, have been trending higher.
It’s important to remember that the Fed’s policy stance over the past year is intended to reduce liquidity and ultimately excess demand for goods and services. In typical boom-and-bust fashion, the tightening was a reversal from the easy-money policy pursued by the Fed from 2020 – early 2022, even in the face of rising inflation. The money supply has been declining for just over a year now, but the declines have been far short of the massive expansion that took place during the pandemic. There is still quite a lot of liquidity in the system.
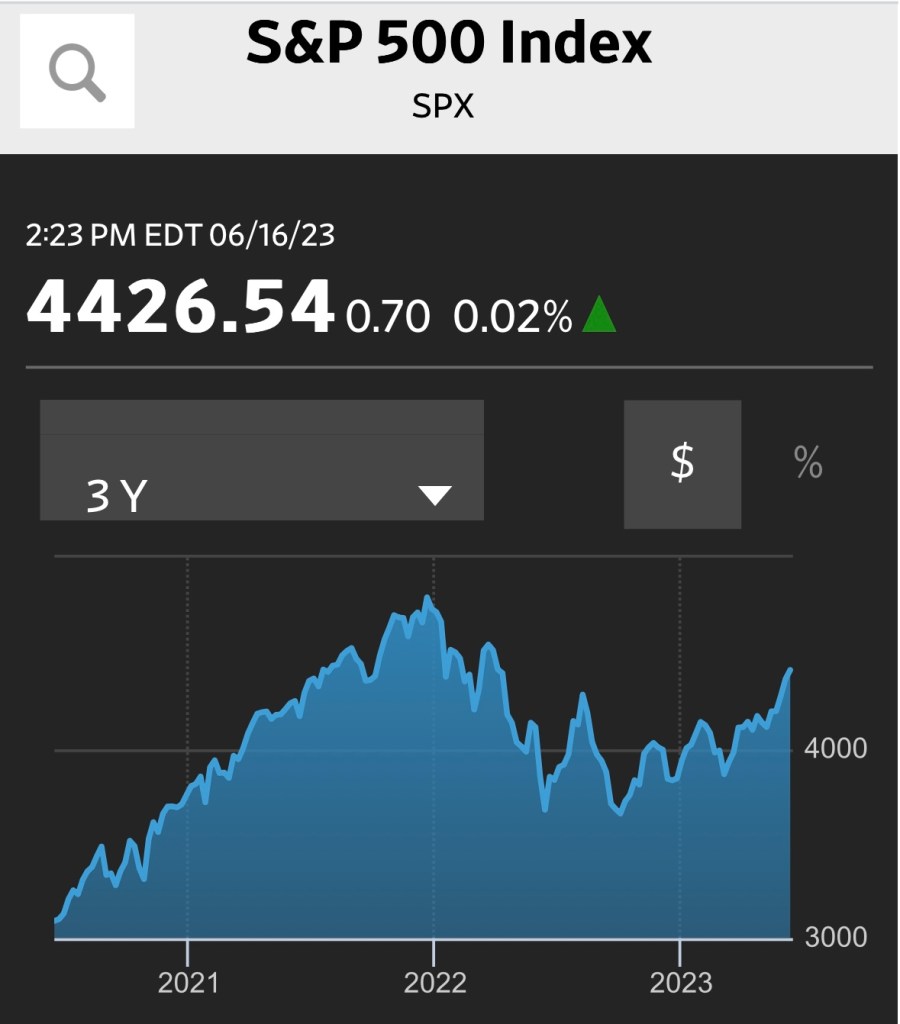
That liquidity helps explain the stock market’s recovery in the face of ongoing doubts about the economy. While the market is still well short of the highs reached in early 2022, recent gains have been impressive.
Some would argue that the forward view driving stock prices reflects an expectation of a mild recession and an inevitable rebound in the economy, no doubt accompanied by eventual cuts in the Fed’s interest rate target. But even stipulating that’s the case, the timing of a stock rally on those terms seems a little premature. Or maybe not! It wouldn’t be the first time incoming data revealed a recession had been underway that no one knew was happening in real time. Are we actually coming out of shallow woods?
To summarize, inflation is down but not out. The Fed might continue its pause on rate hikes through one more meeting in late July, but there will be additional rate increases if inflation remains persistent or edges up from present levels, or if the economy shows unexpected signs of strength. I’d like to be wrong about the prospects of a recession, but a downturn is likely over the next 12 months. I’ve been saying that a recession is ahead for the past eight months or so, which reminds me that even a broken clock is right twice a day. In any case, the stock market seems to expect something mild. However misplaced, hopes for a soft landing seem very much alive.
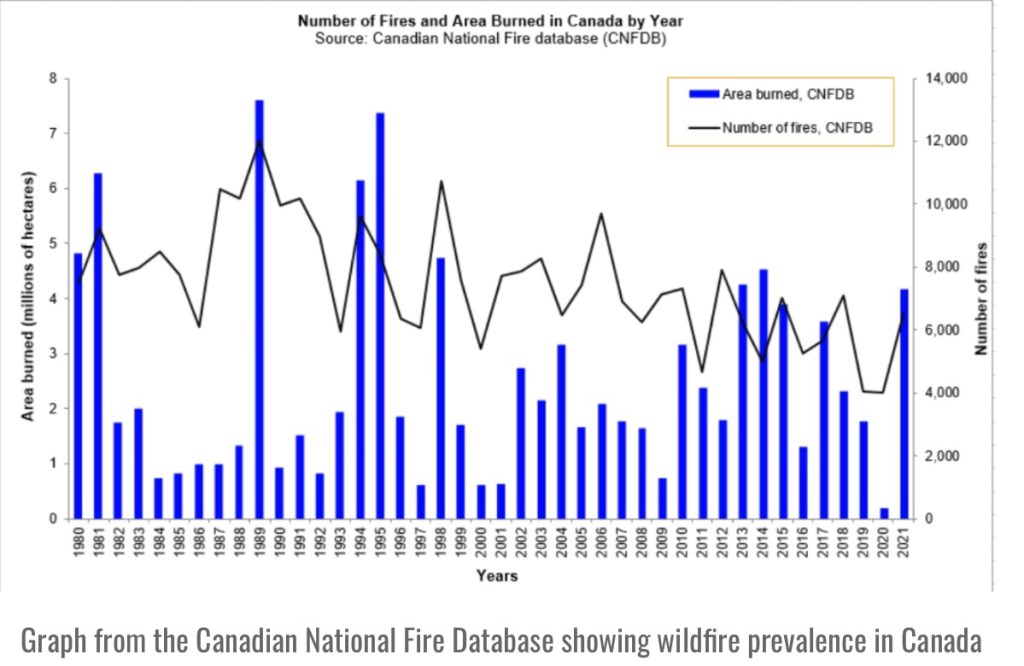
Smoke from this spring’s terrible forest fires in Canada has fouled the air in much of the country and blown into the northeastern U.S. and mid-Atlantic coastal states. The severity of the fires, if they continued at this pace over the rest of the fire season, would break Canadian records for number of fires and burned area.
Large wildfires with smoky conditions occur in these in regions from time-to-time, and it’s not unusual for fires to ignite in the late spring. The article shown above appeared in the New York Tribune on June 5, 1903. Other “dark day” episodes were recorded in New England in 1706, 1732, 1780, 1814, 1819, 1836, 1881, 1894, and 1903, and several times in the 20th century. I list early years specifically because they preceded by decades (even centuries) the era of supposed anthropomorphic global warming, now euphemistically known as “climate change”.
More recently, however, in the past 10 years, Quebec experienced relatively few wildfires. That left plenty of tinder in the boreal forests with highly flammable, sappy trees. In May, a spell of sunshine helped dry the brush in the Canadian forests. Then lightning and human carelessness sparked the fires, along with multiple instances of arson, some perpetrated by climate change activists.
On top of all that, poor forest management contributed to the conflagrations. So-calledfire suppression techniques have done more harm than good over the years, as I’ve discussed on this blog in the past. David Marcus emphasizes the point:
“For years, Canadian parks officials have been warning that their country does not do enough to cull its forests and now we’re witnessing the catastrophic results.
It’s simple really. Edward Struzik, author of ‘Dark Days at Noon, The Future of Fire’ lays it out well.
‘We have been suppressing fires for so many decades in North America that we have forests that are older than they should be,’ he said. …
‘Prescribed burns are one of the best ways to mitigate the wildfire threat,’ he added.”
Nevertheless, the media are eager to blame climate change for any calamity. That’s one part simple naïveté on the part of young journalists, fresh off the turnip truck as it were, with little knowledge or inclination to understand the history and causes of underlying forest conditions. But many seasoned reporters are all too ready to support the climate change narrative as well. There’s also an element of calculated political misinformation in these claims, abetted by those seeking rents from government climate policies.
Wildfires are as old as time; without good forest management practices they are necessary for forest renewal. Agitation to sow climate panic based on wildfires is highly unscrupulous. There is no emergency except for the need to reform forest management, reduce the fuel load, and more generally, put an end to the waste of resources inherent in government climate change initiatives.
Recent advances in artificial intelligence (AI) are giving hope to advocates of central economic planning. Perhaps, they think, the so-called “knowledge problem” (KP) can be overcome, making society’s reliance on decentralized market forces “unnecessary”. The KP is the barrier faced by planners in collecting and using information to direct resources to their most valued uses. KP is at the heart of the so-called “socialist calculation debate”, but it applies also to the failures of right-wing industrial policies and protectionism.
Apart from raw political motives, run-of-the-mill government incompetence, and poor incentives, the KP is an insurmountable obstacle to successful state planning, as emphasized by Friedrich Hayek and many others. In contrast, market forces are capable of spontaneously harnessing all sources of information on preferences, incentives, resources, as well as existing and emergent technologies in allocating resources efficiently. In addition, the positive sum nature of mutually beneficial exchange makes the market by far the greatest force for voluntary social cooperation known to mankind.
Nevertheless, the hope kindled by AI is that planners would be on an equal footing with markets and allow them to intervene in ways that would be “optimal” for society. This technocratic dream has been astir for years along with advances in computer technology and machine learning. I guess it’s nice that at least a few students of central planning understood the dilemma all along, but as explained below, their hopes for AI are terribly misplaced. AI will never allow planners to allocate resources in ways that exceed or even approximate the efficiency of the market mechanism’s “invisible hand”.
Michael Munger recently described the basic misunderstanding about the information or “data” that markets use to solve the KP. Markets do not rely on a given set of prices, quantities, and production relationships. They do not take any of those as givens with respect to the evolution of transactions, consumption, production, investment, or search activity. Instead, markets generate this data based on unobservable and co-evolving factors such as the shape of preferences across goods, services, and time; perceptions of risk and its cost; the full breadth of technologies; shifting resource availabilities; expectations; locations; perceived transaction costs; and entrepreneurial energy. Most of these factors are “tacit knowledge” that no central database will ever contain.
At each moment, dispersed forces are applied by individual actions in the marketplace. The market essentially solves for the optimal set of transactions subject to all of those factors. These continuously derived solutions are embodied in data on prices, quantities, and production relationships. Opportunity costs and incentives are both an outcome of market processes as well as driving forces, so that they shape the transactional footprint. And then those trades are complete. Attempts to impose the same set of data upon new transactions in some repeated fashion, freezing the observable components of incentives and other requirements, would prevent the market from responding to changing conditions.
Thus, the KP facing planners isn’t really about “calculating” anything. Rather, it’s the impossibility of matching or replicating the market’s capacity to generate these data and solutions. There will never be an AI with sufficient power to match the efficiency of the market mechanism because it’s not a matter of mere “calculation”. The necessary inputs are never fully unobservable and, in any case, are unknown until transactions actually take place such that prices and quantities can be recorded.
In my 2020post “Central Planning With AI Will Still Suck”, I reviewed a paper by Jesús Fernández-Villaverde (JFV), who was skeptical of AI’s powers to achieve better outcomes via planning than under market forces. His critique of the “planner position” anticipated the distinction highlighted by Munger between “market data” and the market’s continuous generation of transactions and their observable footprints.
JFV emphasized three reasons for the ultimate failure of AI-enabled planning: impossible data requirements; the endogeneity of expectations and behavior; and the knowledge problem. Again, the discovery and collection of “data” is a major obstacle to effective planning. If that were the only difficulty, then planners would have a mere “calculation” problem. This shouldn’t be conflated with the broader KP. That is, observable “data” is a narrow category relative the arrays of unobservables and the simultaneous generation of inputs and outcomes that takes place in markets. And these solutions are found by market processes subject to an array of largely unobservable constraints.
An interesting obstacle to AI planning cited by JFV is the endogeneity of expectations. It too can be considered part of the KP. From my 2020 post:
“Policy Change Often Makes the Past Irrelevant: Planning algorithms are subject to the so-called Lucas Critique, a well known principle in macroeconomics named after Nobel Prize winner Robert Lucas. The idea is that policy decisions based on observed behavior will change expectations, prompting responses that differ from the earlier observations under the former policy regime. … If [machine learning] is used to “plan” certain outcomes desired by some authority, based on past relationships and transactions, the Lucas Critique implies that things are unlikely to go as planned.”
Again, note that central planning and attempts at “calculation” are not solely in the province of socialist governance. They are also required by protectionist or industrial policies supported at times by either end of the political spectrum. Don Boudreaux offers this wisdom on the point:
“People on the political right typically assume that support for socialist interventions comes uniquely from people on the political left, but this assumption is mistaken. While conservative interventionists don’t call themselves “socialists,” many of their proposed interventions – for example, industrial policy – are indeed socialist interventions. These interventions are socialist because, in their attempts to improve the overall performance of the economy, proponents of these interventions advocate that market-directed allocations of resources be replaced with allocations carried out by government diktat.”
The hope that non-market planning can be made highly efficient via AI is a fantasy. In addition to substituting the arbitrary preferences of planners and politicians for those of private agents, the multiplicity of forces bearing on individual decisions will always be inaccessible to AIs. Many of these factors are deeply embedded within individual minds, and often in varying ways. That is why the knowledge problem emphasized by Hayek is much deeper than any sort of “calculation problem” fit for exploitation via computer power.
~~~~~~~~~~~~~~~~~~~~~~~~~~~~~~~~~~~~~
Note: The image at the top of this post is attributed by Bing to the CATO Institute-sponsored website Libertarianism.org and an article that appeared there in 2013, though that piece, by Jason Kuznicki, no longer seems to feature that image.
Policy activists have long maintained that manipulating government policy can stabilize the economy. In other words, big spending initiatives, tax cuts, and money growth can lift the economy out of recessions, or budget cuts and monetary contraction can prevent overheating and inflation. However, this activist mirage burned away under the light of experience. It’s not that fiscal and monetary policy are powerless. It’s a matter of practical limitations that often cause these tools to be either impotent or destabilizing to the economy, rather than smoothing fluctuations in the business cycle.
The macroeconomics classes seem like yesterday: Keynesian professors lauded the promise of wise government stabilization efforts: policymakers could, at least in principle, counter economic shocks, particularly on the demand side. That optimistic narrative didn’t end after my grad school days. I endured many client meetings sponsored by macro forecasters touting the fine-tuning of fiscal and monetary policy actions. Some of those economists were working with (and collecting revenue from) government policymakers, who are always eager to validate their pretensions as planners (and saviors). However, seldom if ever do forecasters conduct ex post reviews of their model-spun policy scenarios. In fairness, that might be hard to do because all sorts of things change from initial conditions, but it definitely would not be in their interests to emphasize the record.
In this post I attempt to explain why you should be skeptical of government stabilization efforts. It’s sort of a lengthy post, so I’ve listed section headings below in case readers wish to scroll to points of most interest. Pick and choose, if necessary, though some context might get lost in the process.
Expectations Change the World
Fiscal Extravagance
Multipliers In the Real World
Delays
Crowding Out
Other Peoples’ Money
Tax Policy
Monetary Policy
Boom and Bust
Inflation Targeting
Via Rate Targeting
Policy Coordination
Who Calls the Tune?
Stable Policy, Stable Economy
Expectations Change the World
There were always some realists in the economics community. In May we saw the passing of one such individual: Robert Lucas was a giant intellect within the economics community, and one from whom I had the pleasure of taking a class as a graduate student. He was awarded the Nobel Prize in Economic Science in 1995 for his applications of rational expectations theory and completely transforming macro research. As Tyler Cowen notes, Keynesians were often hostile to Lucas’ ideas. I remember a smug classmate, in class, telling the esteemed Lucas that an important assumption was “fatuous”. Lucas fired back, “You bastard!”, but proceeded to explain the underlying logic. Cowen uses the word “charming” to describe the way Lucas disarmed his critics, but he could react strongly to rude ignorance.
Lucas gained professional fame in the 1970s for identifying a significant vulnerability of activist macro policy. David Henderson explains the famous “Lucas Critique” in the Wall Street Journal:
“… because these models were from periods when people had one set of expectations, the models would be useless for later periods when expectations had changed. While this might sound disheartening for policy makers, there was a silver lining. It meant, as Lucas’s colleague Thomas Sargent pointed out, that if a government could credibly commit to cutting inflation, it could do so without a large increase in unemployment. Why? Because people would quickly adjust their expectations to match the promised lower inflation rate. To be sure, the key is government credibility, often in short supply.”
Non-credibility is a major pitfall of activist macro stabilization policies that renders them unreliable and frequently counterproductive. And there are a number of elements that go toward establishing non-credibility. We’ll distinguish here between fiscal and monetary policy, focusing on the fiscal side in the next several sections.
Fiscal Extravagance
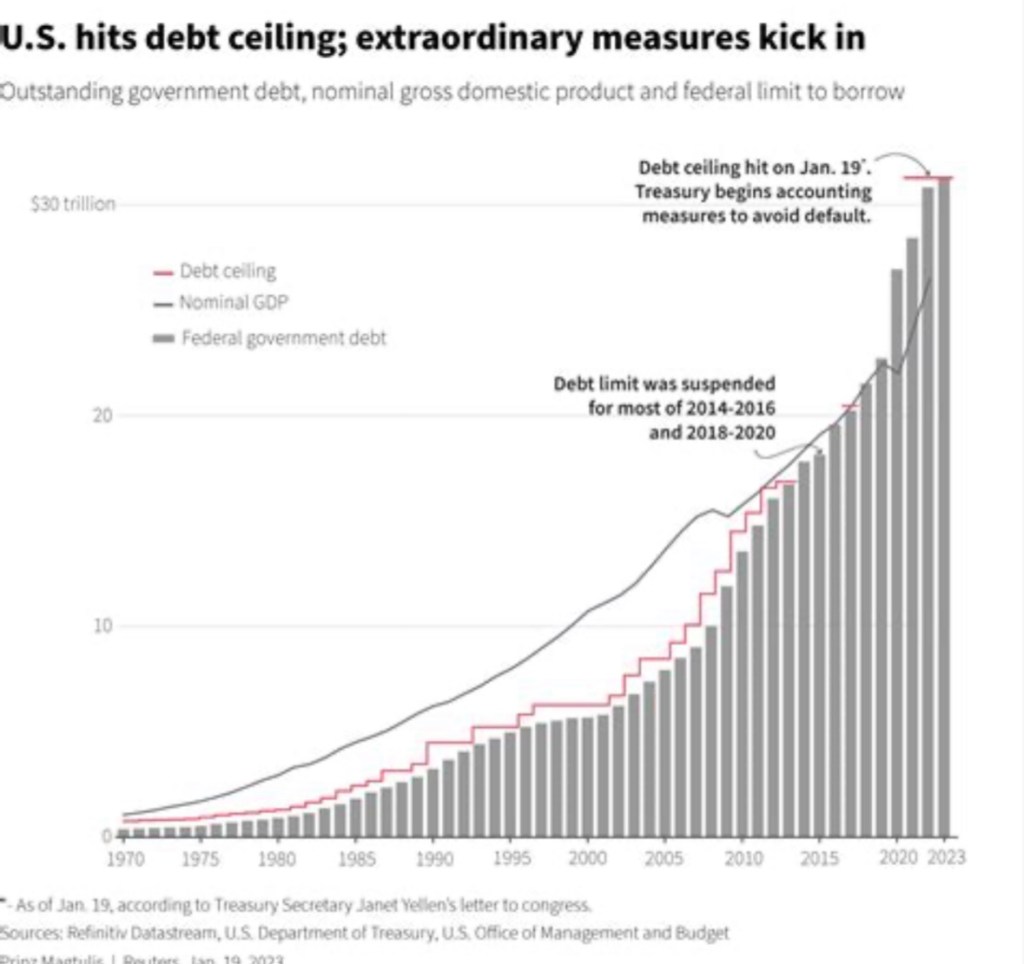
We’ve seen federal spending and budget deficits balloon in recent years. Chronic and growing budget deficits make it difficult to deliver meaningful stimulus, both practically and politically.
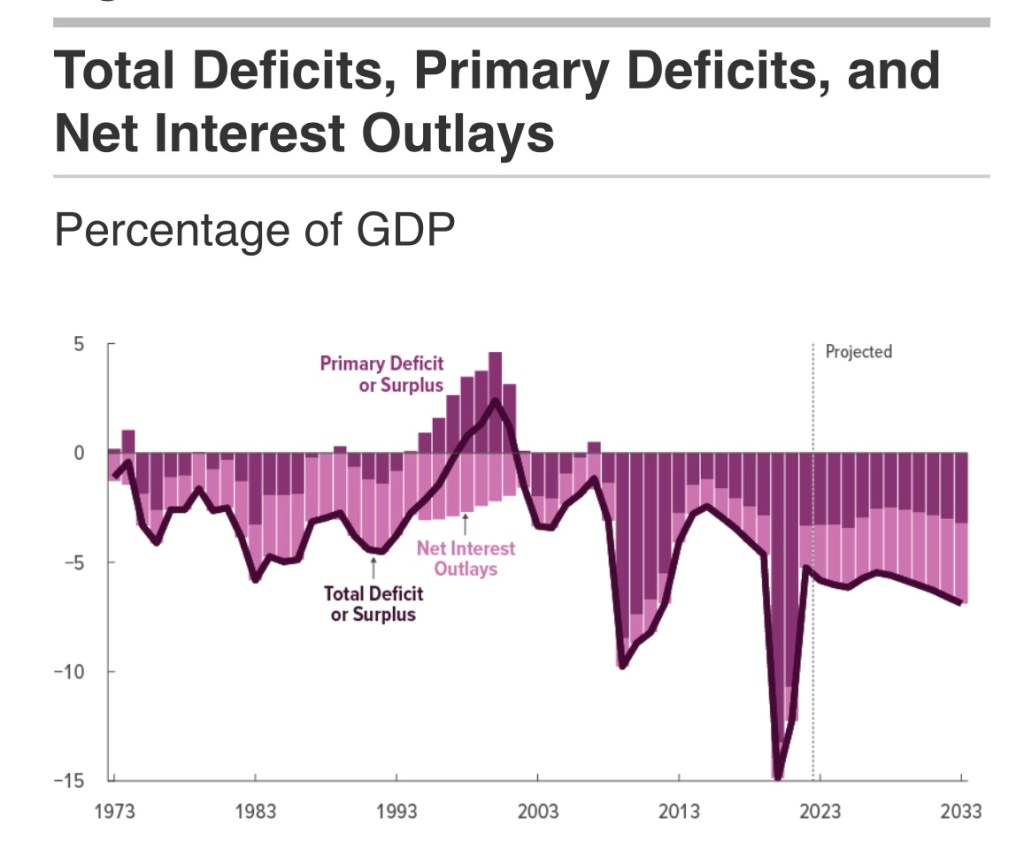
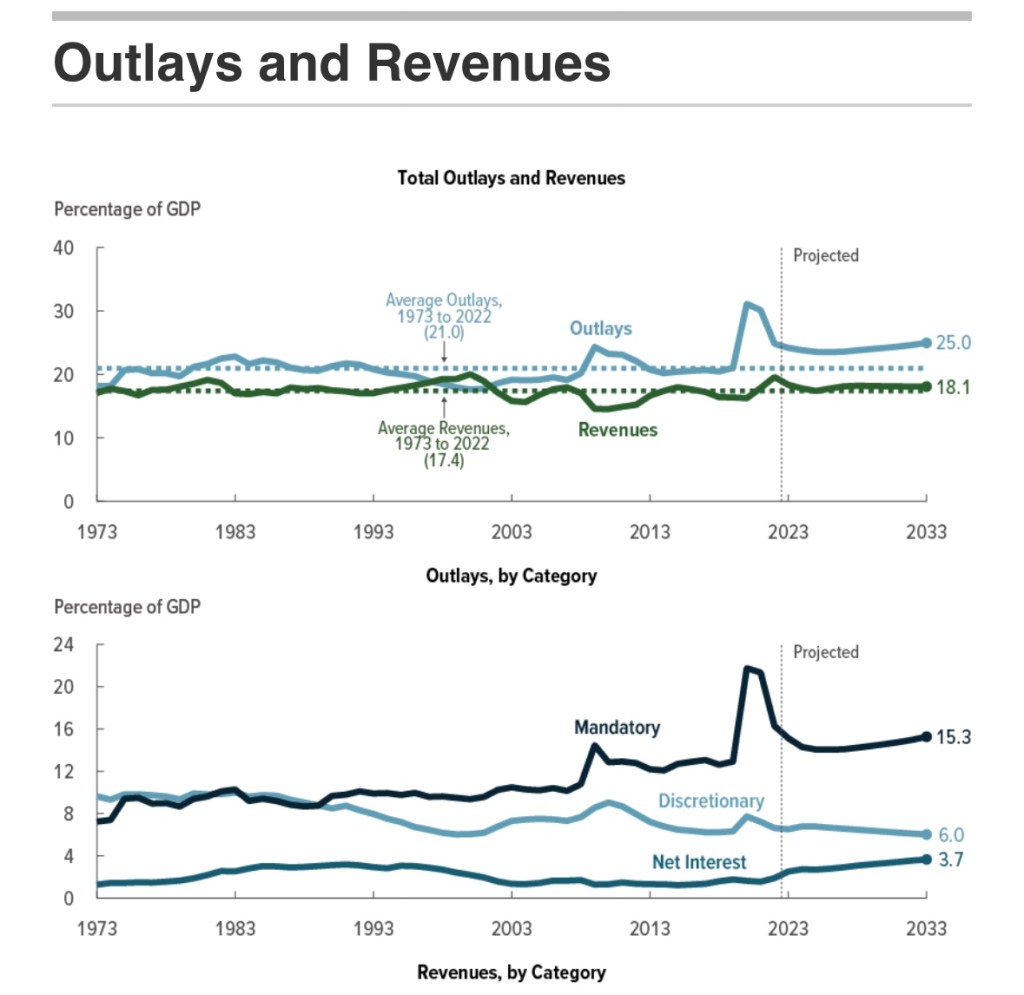
The next chart is from the most recent Congressional Budget Office (CBO) report. It shows the growing contribution of interest payments to deficit spending. Ever-larger deficits mean ever-larger amounts of debt on which interest is owed, putting an ever-greater squeeze on government finances going forward. This is particularly onerous when interest rates rise, as they have over the past few years. Both new debt is issued and existing debt is rolled over at higher cost.
Relief payments made a large contribution to the deficits during the pandemic, but more recent legislation (like the deceitfully-named Inflation Reduction Act) piled-on billions of new subsidies for private investments of questionable value, not to mention outright handouts. These expenditures had nothing to do with economic stabilization and no prayer of reducing inflation. Pissing away money and resources only hastens the debt and interest-cost squeeze that is ultimately unsustainable without massive inflation.
Hardly anyone with future political ambitions wants to address the growing entitlements deficit … but it will catch up with them. Social Security and Medicare are projected to exhaust their respective trust funds in the early- to mid-2030s, which will lead to mandatory benefit cuts in the absence of reform.
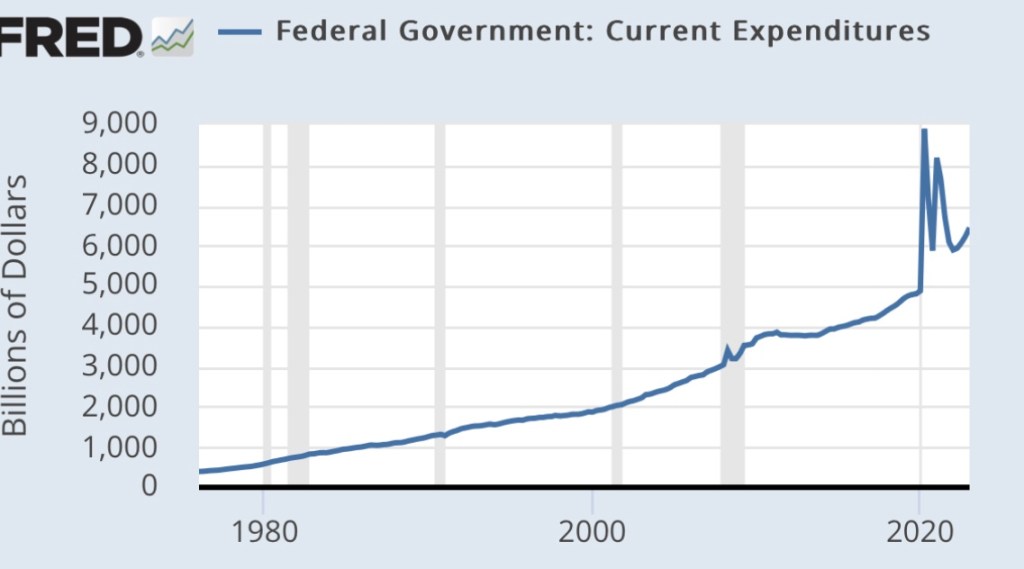
If it still isn’t obvious, the real problem driving the budget imbalance is spending, not revenue, as the next CBO chart demonstrates. The “emergency” pandemic measures helped precipitate our current stabilization dilemma. David Beckworth tweets that the relief measures “spurred a rapid recovery”, though I’d hasten to add that a wave of private and public rejection of extreme precautions in some regions helped as well. And after all, the pandemic downturn was exaggerated by misdirected policies including closures and lockdowns that constrained both the demand and supply sides. Beckworth acknowledges the relief measures “propelled inflation”, but the pandemic also seemed to leave us on a permanently higher spending path. Again, see the first chart below.
The second chart below shows that non-discretionary spending (largely entitlements) and interest outlays are how we got on that path. The only avenue for countercyclical spending is discretionary expenditures, which constitute an ever-smaller share of the overall budget.
We’ve had chronic deficits for years, but we’ve shifted to a much larger and continuing imbalance. With more deficits come higher interest costs, especially when interest rates follow a typical upward cyclical pattern. This creates a potentially explosive situation that is best avoided via fiscal restraint.
Putting other doubts about fiscal efficacy aside, it’s all but impossible to stimulate real economic activity when you’ve already tapped yourself out and overshot in the midst of a post-pandemic economic expansion.
Multipliers In the Real World
So-called spending multipliers are deeply beloved by Keynesians and pork-barrel spenders. These multipliers tell us that every dollar of extra spending ultimately raises income by some multiple of that dollar. This assumes that a portion of every dollar spent by government is re-spent by the recipient, and a portion of that is re-spent again by another recipient. But spending multipliers are never what they’re cracked up to be for a variety of reasons. (I covered these in“Multipliers Are For Politicians”, and also see this post.) There are leakages out of the re-spending process (income taxes, saving, imports), which trim the ultimate impact of new spending on income. When supply constraints bind on economic activity, fiscal stimulus will be of limited power in real terms.
If stimulus is truly expected to be counter-cyclical and transitory, as is generally claimed, then much of each dollar of extra government spending will be saved rather than spent. This is the lesson of the permanent income hypothesis. It means greater leakages from the re-spending stream and a lower multiplier. We saw this with the bulge in personal savings in the aftermath of pandemic relief payments.
Another side of this coin, however, is that cutting checks might be the government’s single-most efficient activity in execution, but it can create massive incentive problems. Some recipients are happy to forego labor market participation as long as the government keeps sending them checks, but at least they spend some of the income.
Delays
Another unappreciated and destabilizing downside of fiscal stimulus is that it often comes too late, just when the economy doesn’t need stimulus. That’s because a variety of delays are inherent in many spending initiatives: legislative, regulatory, legal challenges, planning and design, distribution to various spending authorities, and final disbursement. As I noted here:
“Even government infrastructure projects, heralded as great enhancers of American productivity, are often subject to lengthy delays and cost overruns due to regulatory and environmental rules. Is there any such thing as a federal ‘shovel-ready’ infrastructure project?”
Crowding Out
The supply of savings is limited, but when government borrows to fund deficits, it directly competes with private industry for those savings. Thus, funds that might otherwise pay for new plant, equipment, and even R&D are diverted to uses that should qualify as government consumption rather than long-term investment. Government competition for funds “crowds-out” private activity and impedes growth in the economy’s productive capacity. Thus, the effort to stimulate economic activity is self-defeating in some respects.
Other Peoples’ Money
Government doesn’t respond to price signals the way self-interested private actors do. This indifference leads to mis-allocated resources and waste. It extends to the creation of opportunities for graft and corruption, typically involving diversion of resources into uses that are of questionable productivity (corn ethanol, solar and wind subsidies).
Consider one other type of policy action perceived as counter-cyclical: federal bailouts of failing financial institutions or other troubled businesses. These rescues prop up unproductive enterprises rather than allowing waste to be flushed from the system, which should be viewed as a beneficial aspect of recession. The upshot is that too many efforts at economic stabilization are misdirected, wasteful, ill-timed, and pro-cyclical in impact.
Tax Policy
Like stabilization efforts on the spending side, tax changes may be badly timed. Tax legislation is often complex and can take time for consumers and businesses to adjust. In terms of traditional multiplier analysis, the initial impact of a tax change on spending is smaller than for expenditures, so tax multipliers are smaller. And to the extent that a tax change is perceived as temporary, it is made less effective. Thus, while changes in tax policy can have powerful real effects, they suffer from some of the same practical shortcomings for stabilization as changes in spending.
However, stimulative tax cuts, if well crafted, can boost disposable incomes and improve investment and work incentives. As temporary measures, that might mean an acceleration of certain kinds of activity. Tax increases reduce disposable incomes and may blunt incentives, or prompt delays in planned activities. Thus, tax policy may bear on the demand side as well as the timing of shifts in the economy’s productive potential or supply side.
Monetary Policy
Monetary policy is subject to problems of its own. Again, I refer to practical issues that are seemingly impossible for policy activists to overcome. Monetary policy is conducted by the nation’s central bank, the Federal Reserve (aka, the Fed). It is theoretically independent of the federal government, but the Fed operates under a dual mandate established by Congress to maintain price stability and full employment. Therein lies a basic problem: trying to achieve two goals that are often in conflict with a single policy tool.
Make no mistake: variations in money supply growth can have powerful effects. Nevertheless, they are difficult to calibrate due to “long and variable lags” as well as changes in money “velocity” (or turnover) often prompted by interest rate movements. Excessively loose money can lead to economic excesses and an overshooting of capacity constraints, malinvestment, and inflation. Swinging to a tight policy stance in order to correct excesses often leads to “hard landings”, or recession.
Boom and Bust
The Fed fumbled its way into engineering the Great Depression via excessively tight monetary policy. “Stop and go” policies in the 1970s led to recurring economic instability. Loose policy contributed to the housing bubble in the 2000s, and subsequent maladjustments led to a mortgage crisis (also see here). Don’t look now, but the inflationary consequences of the Fed’s profligacy during the pandemic prompted it to raise short-term interest rates in the spring of 2022. It then acted with unprecedented speed in raising rates over the past year. While raising rates is not always synonymous with tightening monetary conditions, money growth has slowed sharply. These changes might well lead to recession. Thus, the Fed seems given to a pathology of policy shifts that lead to unintentional booms and busts.
Inflation Targeting
The Fed claims to follow a so-called flexible inflation targeting policy. In reality, it has reacted asymmetrically to departures from its inflation targets. It took way too long for the Fed to react to the post-pandemic surge in inflation, dithering for months over whether the surge was “transitory”. It wasn’t, but the Fed was reluctant to raise its target rates in response to supply disruptions. At the same time, the Fed’s own policy actions contributed massively to demand-side price pressures. Also neglected is the reality that higher inflation expectations propel inflation on the demand side, even when it originates on the supply side.
Via Rate Targeting
At a more nuts and bolts level, today the Fed’s operating approach is to control money growth by setting target levels for several key short-term interest rates (eschewing a more direct approach to the problem). This relies on price controls (short-term interest rates being the price of liquidity) rather than allowing market participants to determine the rates at which available liquidity is allocated. Thus, in the short run, the Fed puts itself into the position of supplying whatever liquidity is demanded at the rates it targets. The Fed makes periodic adjustments to these rate targets in an effort to loosen or tighten money, but it can be misdirected in a world of high debt ratios in which rates themselves drive the growth of government borrowing. For example, if higher rates are intended to reduce money growth and inflation, but also force greater debt issuance by the Treasury, the approach might backfire.
Policy Coordination
While nominally independent, the Fed knows that a particular monetary policy stance is more likely to achieve its objectives if fiscal policy is not working at cross purposes. For example, tight monetary policy is more likely to succeed in slowing inflation if the federal government avoids adding to budget deficits. Bond investors know that explosive increases in federal debt are unlikely to be repaid out of future surpluses, so some other mechanism must come into play to achieve real long-term balance in the valuation of debt with debt payments. Only inflation can bring the real value of outstanding Treasury debt into line. Continuing to pile on new debt simply makes the Fed’s mandate for price stability harder to achieve.
Who Calls the Tune?
The Fed has often succumbed to pressure to monetize federal deficits in order to keep interest rates from rising. This obviously undermines perceptions of Fed independence. A willingness to purchase large amounts of Treasury bills and bonds from the public while fiscal deficits run rampant gives every appearance that the Fed simply serves as the Treasury’s printing press, monetizing government deficits. A central bank that is a slave to the spending proclivities of politicians cannot make credible inflation commitments, and cannot effectively conduct counter-cyclical policy.
Stable Policy, Stable Economy
Activist policies for economic stabilization are often perversely destabilizing for a variety of reasons. Good timing requires good forecasts, but economic forecasting is notoriously difficult. The magnitude and timing of fiscal initiatives are usually wrong, and this is compounded by wasteful planning, allocative dysfunction, and a general absence of restraint among political leaders as well as the federal bureaucracy..
Predicting the effects of monetary policy is equally difficult and, more often than not, leads to episodes of over- and under-adjustment. In addition, the wrong targets, the wrong operating approach, and occasional displays of subservience to fiscal pressure undermine successful stabilization. All of these issues lead to doubts about the credibility of policy commitments. Stated intentions are looked upon with doubt, increasing uncertainty and setting in motion behaviors that lead to undesirable economic consequences.
The best policies are those that can be relied upon by private actors, both as a matter of fulfilling expectations and avoiding destabilization. Federal budget policy should promote stability, but that’s not achievable institutions unable to constrain growth in spending and deficits. Budget balance would promote stability and should be the norm over business cycles, or perhaps over periods as long as typical 10-year budget horizons. Stimulus and restraint on the fiscal side should be limited to the effects of so-called automatic stabilizers, such as tax rates and unemployment compensation. On the monetary side, the Fed would do more to stabilize the economy by adopting formal rules, whether a constant rate of money growth or symmetric targeting of nominal GDP.
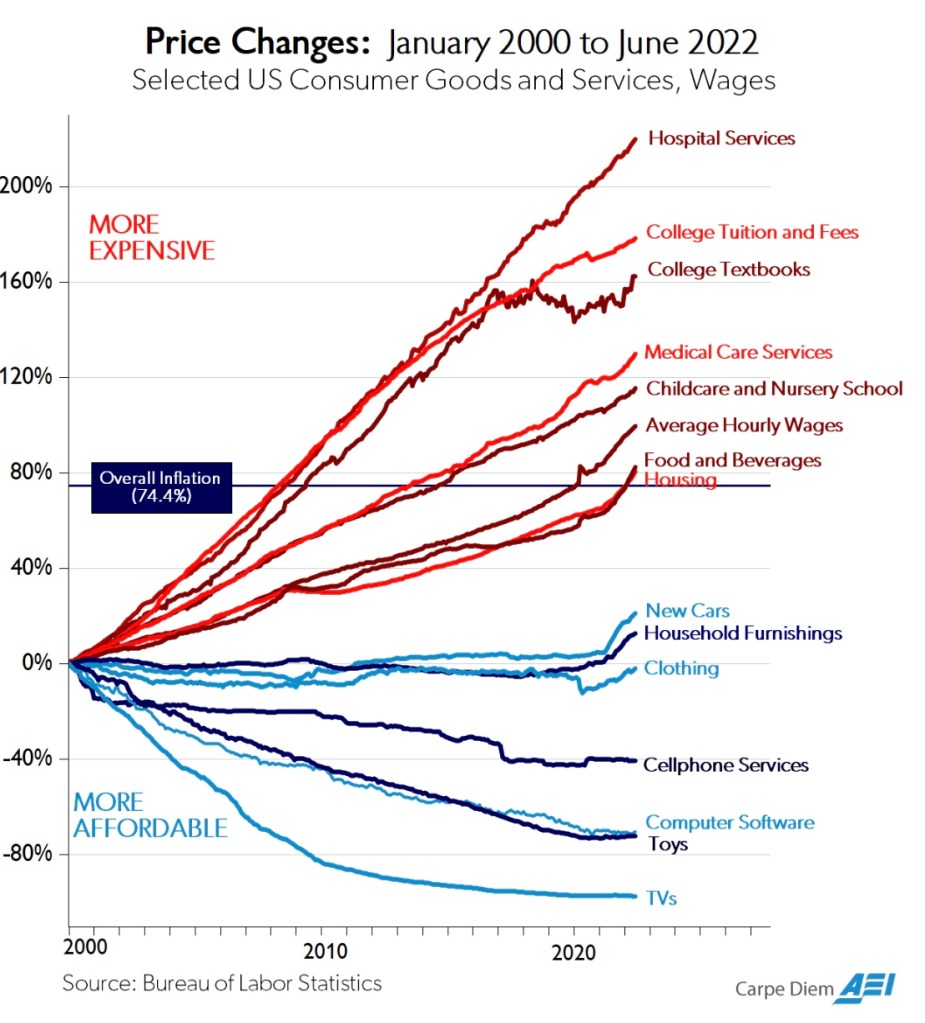
This post is about relative prices in two major sectors of the U.S. economy, both of which are hindered by slow productivity growth while being among the most heavily subsidized: education and health care. Historically, both sectors have experienced rather drastic relative price increases, as illustrated for the past 20 years in the chart from Mark Perry above.
Baumol’s Cost Disease
These facts are hardly coincidental, though it’s likely the relative costs education and health care would have risen even in the absence of subsidies. Over long periods of time, the forces primarily guiding relative price movements are differentials in productivity growth. The tendency of certain industries to suffer from slow growth in productivity is the key to something known among economists as Baumol’s Disease, after the late William Baumol, who first described the phenomenon’s impact on relative prices.
Standards of living improve when a sufficient number of industries enjoy productivity growth. That creates a broad diffusion of new demands across many industries, including those less amenable to productivity growth, such as health care and education. But slow productivity growth and rising demand in these industries are imbalances that push their relative prices upward.
Alex Tabarrok and Eric Helland noted a few years ago that it took four skilled musicians 44 minutes to play Beethoven’s String Quartet No. 14 in 1826 and also in 2010, but the inflation-adjusted cost was 23 times higher. Services involving a high intensity of skilled labor are more prone to Baumol’s Disease than manufactured goods. As well, services for which demand is highly responsive to income or sectors characterized by monopoly power may be more prone to Baumol’s disease.
Tabarrok wonders whether we should really consider manifestations of Baumol’s Disease a blessing, because they show the extent to which productivity and real incomes have grown across the broader economy. So, rather than blame low productivity growth in certain services for their increasing relative prices, we should really blame (or thank) the rapid productivity growth in other sectors.
The Productivity Slog
There are unavoidable limits to the productivity growth of skilled educators, physicians, and other skilled workers in health care. Again, in a growing economy, prices of things in relatively fixed supply or those registering slow productivity gains will tend to rise more rapidly.
Technology offers certain advantages in some fields of education, but it’s hard to find evidence of broad improvement in educational success in the U.S. at any level. In the health care sector, new drugs often improve outcomes, as do advances in technologies such as drug delivery systems, monitoring devices, imaging, and robotic surgery. However, these advances don’t necessarily translate into improved capacity of the health care system to handle patients except at higher costs.
There’s been some controversy over the proper measurement of productivity in the health care sector. Some suggest that traditional measures of health care productivity are so flawed in capturing quality improvements that the meaning of prices themselves is distorted. They conclude that adjusting for quality can actually yield declines in effective health care prices. I’d interject, however, that patients and payers might harbor doubts about that assertion.
Other investigators note that while real advances in health care productivity should reduce costs, the degree of success varies substantially across different types of innovations and care settings. In particular, innovations in process and protocols seem to be more effective in reducing health care expenditures than adding new technologies to existing protocols or business models. All too often, medical innovations are of the latter variety. Ultimately, innovations in health care haven’t allowed a broader population of patients to be treated at low cost.
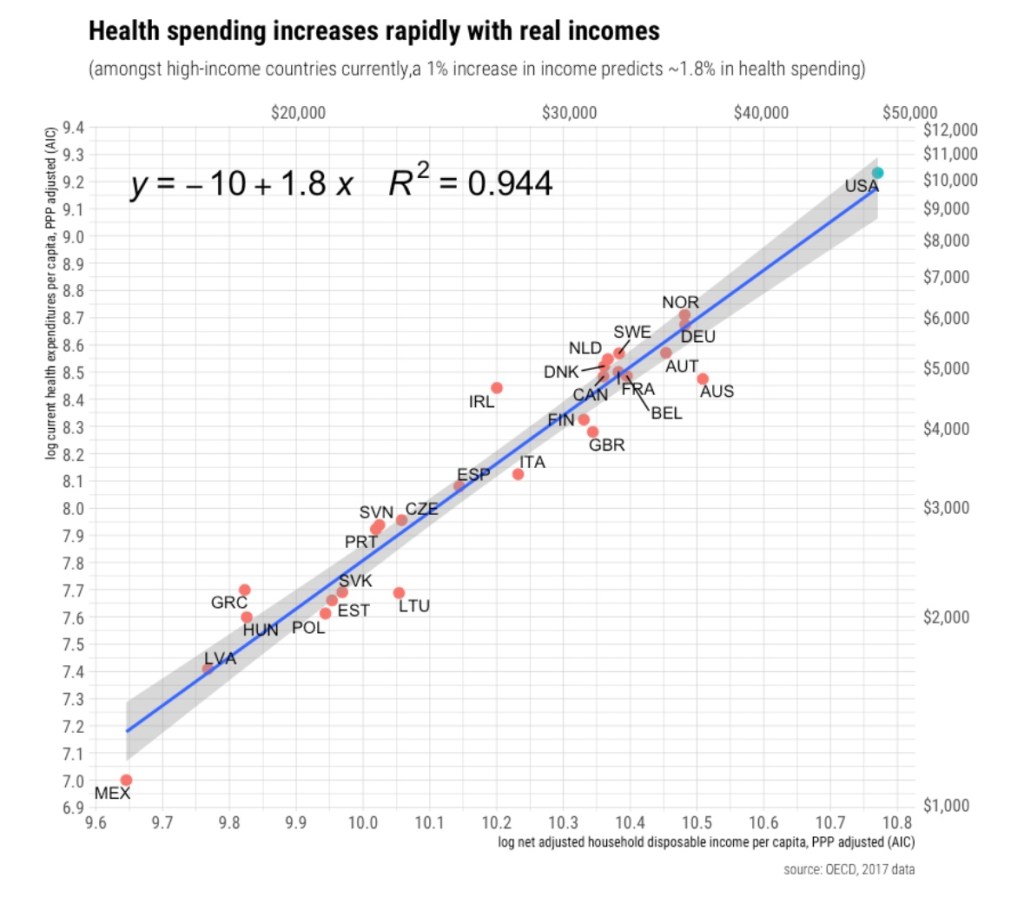
Superior Goods
Therefore, it appears that increases in the relative prices of education and health care over time have arisen as a natural consequence of the interplay between disparities in productivity growth and rising demand. Indeed, this goes a long way toward explaining the high cost of health care in the U.S. compared to other developed nations, as standards of living in the U.S. are well above nearly all others. In that respect, the cost of health care in the U.S. is not necessarily alarming. People demand more health care and education as their incomes rise, but delivering more health care isn’t easy. To paraphrase Tabarrok, turning steelworkers into doctors, nurses and teachers is a costly proposition.
The Role of Subsidies
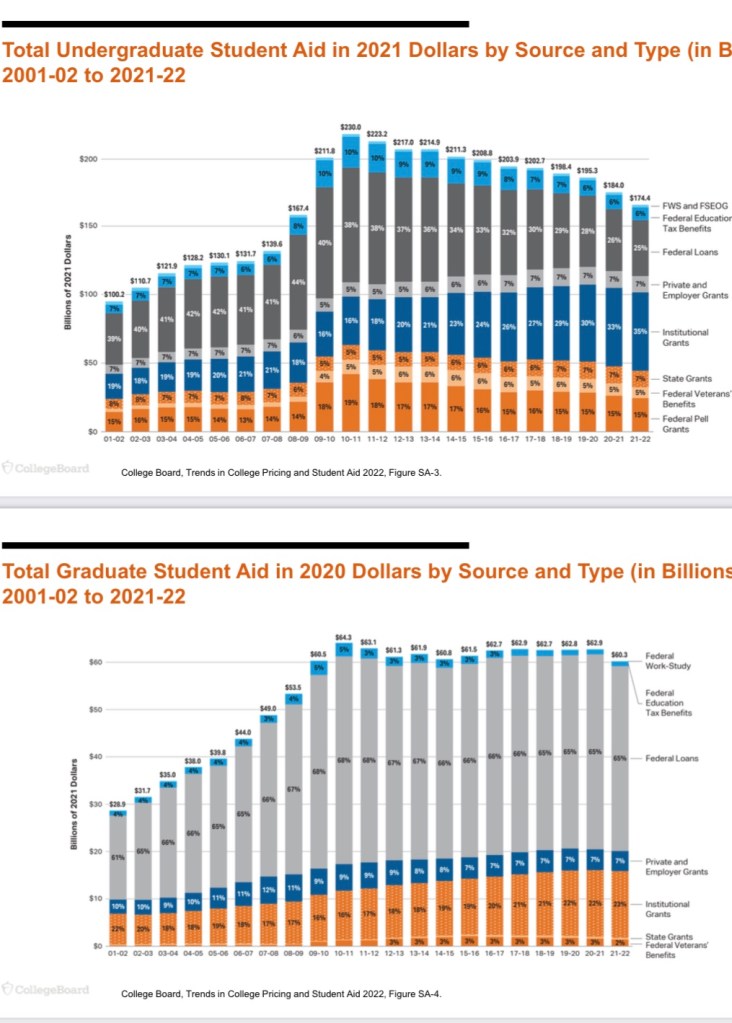
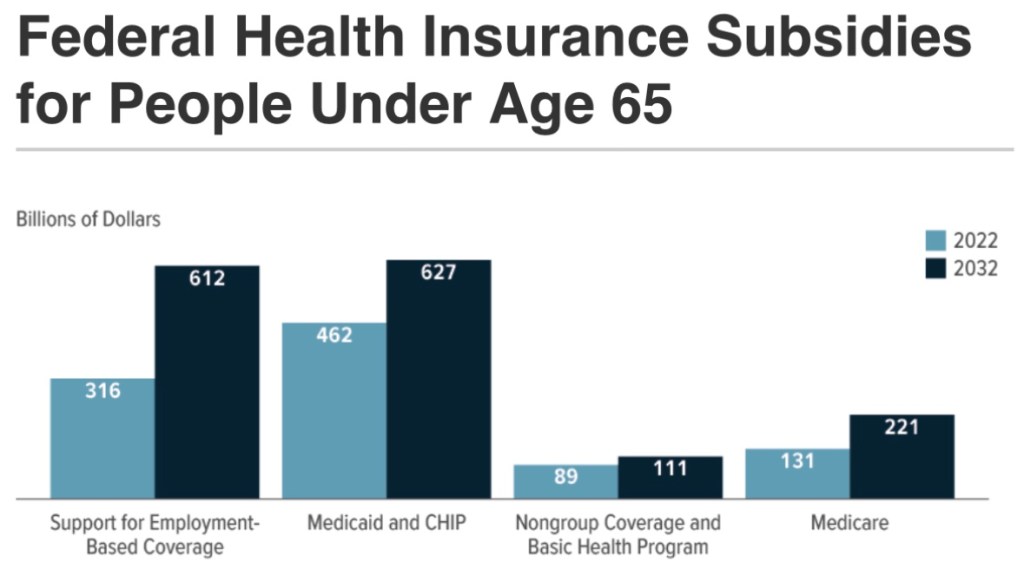
In the clamor for scarce educational and health care resources, natural tensions over access have spilled into the political sphere. In pursuit of distributing these resources more equitably, public policy has relied heavily on subsidies. It shouldn’t surprise anyone that subsiding a service resistant to productivity gains will magnify the Baumol effect on relative price. One point is beyond doubt: the amounts of these subsidies is breathtaking.
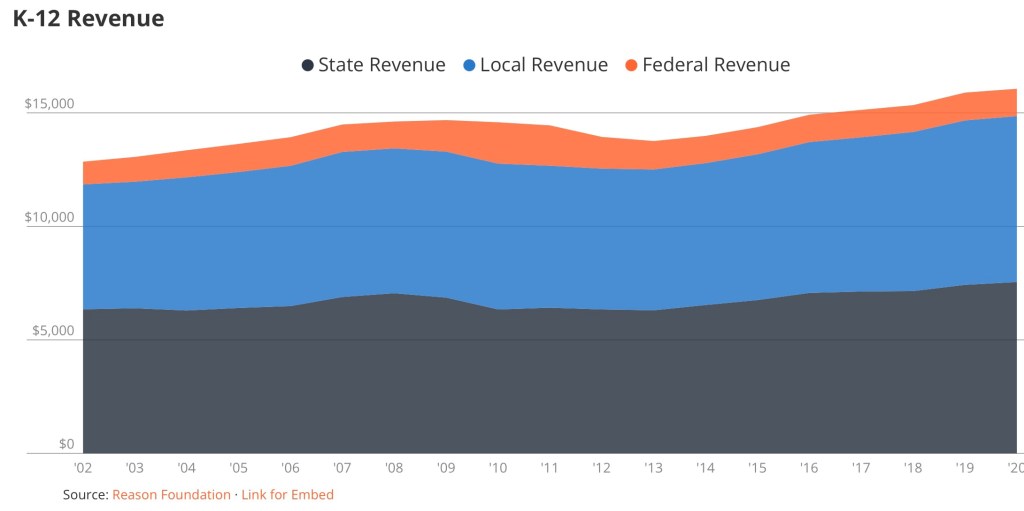
Education: Public K -12 schools are largely funded by local taxpayers. Taxpayer-parents of school-aged children pay part of this cost whether they send their children to public schools or not. If they don’t, they must pay the additional cost of private or home schooling. This severely distorts the link between payments and the value assigned by actual users of public schools. It also confers a huge degree of market power to public schools, thus insulating them economically from performance pressures.
Public K – 12 schools are also heavily subsidized by state governments and federal grants. The following chart shows the magnitude and growth of K – 12 revenue per student over the past couple of decades.
Subsidies for higher education take the form of student aid, including federal student loans, grants to institutions, as well as a variety of tax subsidies. Here’s a nice breakdown:
This represents a mix of buyer and seller subsidies. That suggests less upward pressure on price and more stimulus to output, but we still run up against the limits to productivity growth noted above. Moreover, other constraints limit the effectiveness of these subsidies, such as lower academic qualifications in a broader student population and the potential for rewards in the job market to diminish with a potential excess of graduates.
Health care: Subsidies here are massive and come in a variety of forms. They often directly provide or reduce the cost of health insurance coverage: Medicaid, the Children’s Health Insurance Program (CHIP), Obamacare exchange subsidies, Medicare savings programs, tax-subsidies on employer-paid health coverage, and medical expense tax deductions. Within limits, these subsidies reduce the marginal cost of care patients are asked to pay, thus contributing to over-utilization of various kinds of care.
The following are CBO projections from June 2022. They are intended here to give an idea of the magnitude of health care insurance subsidies:
Still Other Dysfunctions
There are certainly other drivers of high costs in the provision of health care and education beyond a Baumol effect magnified by subsidies. The third-party payment system has contributed to a loss of price discipline in health care. While consumers are often responsible for paying at least part of their health insurance premiums, the marginal cost of health care to consumers is often zero, so they have little incentive to manage their demands.
Another impediment to cost control is a regulatory environment in health care that has led to a sharply greater concentration of hospital services and the virtual disappearance of independent provider practices. Competition has been sorely lacking in education as well. Subsidies flowing to providers with market power tend to exacerbate behaviors that would be punished in competitive markets, and not just pricing.
Summary
Baumol’s Disease can explain a lot about the patterns of relative prices shown in the chart at the top of this post. That pattern is a negative side effect of general growth in productivity. Unfortunately, it also reflects a magnification engendered by the payment of subsidies to sectors with slow productivity growth. The intent of these subsidies is to distribute health care and education more equitably, but the impact on relative prices undermines these objectives. The approach forces society to exert wasted energy, like an idiotic dog chasing its tail.
Peter Suderman wrote an excellent piece in which he discussed health care and education subsidies in the context of the so-called “abundance agenda”. His emphasis is on the futility of this agenda for the middle class, for which quality education and affordable health care always seem just out of reach. The malign effects of “abundance” policies are reinforced by anti-competitive regulation and payment mechanisms, which subvert market price discipline and consumer sovereignty. We’d be far better served by policies that restore consumer responsibility, deregulate providers, and foster competition in the delivery of health care and education.
Long-awaited developments in the federal debt limit standoff shook loose in late April when Republicans passed a debt limit bill in the House of Representatives. Were it signed into law, the bill would extend the debt ceiling by about $1.5 trillion while incorporating elements of spending restraint. That approach is highly unpopular with democrats, but the zero-hour looms: Treasury Secretary Janet Yellen says the Treasury will run out of funds to pay all of the government’s obligations in early June. Soon we’ll have a better fix on President Biden’s response to the republicans, as he’s invited congressional leaders to the White House this Tuesday, May 8th to discuss the issue.
Biden wants a “clean” debt limit bill without changes impacting the budget path or existing appropriations. Senate Majority Leader Chuck Schumer would like to see a “clean” suspension of the debt limit. Republicans would like to use a debt limit extension to impose some spending restraint. They’ve focused only on the discretionary side of the budget, however, while much-needed reforms of mandatory programs like Social Security and Medicare were left aside. In fairness, both political parties have made massive contributions over the years to the burgeoning public debt, so not many are free of blame. But any time is a good time to try to enforce some fiscal discipline.
The Extraordinary Has Its Limits
Three months ago I wrote that the Treasury’s “extraordinary measures” to avoid breaching the debt limit would probably allow adequate time to break the impasse. In other words, accounting maneuvers allowed spending to continue without the sale of new debt. That bought some time, but perhaps not as much as hoped … tax filing season has revealed that revenue is coming in short of expectations, probably because weak asset markets have not generated anticipated levels of taxable capital gains income. In any case, very little progress was made over the past three months on settling the debt limit issue until the House passed the plan pushed by McCarthy. So we await the results of the pow-wow at the White House this week.
A Legislative Trick?
There’s been talk that House democrats will try to push through a “clean” debt limit bill of one sort or another by using a so-called discharge petition. They conveniently snuck this measure into an unrelated piece of legislation back in January. The upshot is that a bill meeting certain conditions must go to the floor for a vote if the discharge petition on the issue has at least 218 signatures. That means at least five republicans must join the democrats to force a vote and then join them again to pass a clean debt limit bill. That’s a long shot for democrats. Given the odds, will Biden deign to negotiate with House Speaker Kevin McCarthy? Even if he does, Biden will probably stall a while longer to extend the game of chicken. His hope would be for a few House republicans to lose their resolve for budget discipline in the face of looming default.
An Aside On Some Falsehoods
There’s a good measure of jingoistic BS surrounding the public debt. For example, you’ve probably heard from prominent voices in the debate that the U.S. has never defaulted on its debt and dad-gummit, it won’t start now!But the federal government has defaulted on its debt four times in the past! In three of those cases, the government reneged on commitments to convert bills or certificates into precious metals. The first default occurred during the Civil War, however, when the Union was unable to pay its war costs and subsequently went on a money printing binge. Unfortunately, we’re now engaged in a civil war of public versus private claims on resources, but the government can’t pay its bills without piling on debt. The statist forces now in control of the executive branch continue to insist that every American should demand more federal borrowing.
Here’s more BS in the form of linguistics that seemingly pervade all budget discussions these days: the House bill includes modest spending restraints, but mostly these are reductions in the growth of spending. Yet these are routinely described by democrats and the media as spending cuts. We could use another bill in the House demanding clear language that abides by the commonly accepted meaning of words. Fat chance!
The Trillion Dollar Coin
In my earlier debt limit post, I discussed two unconventional solutions to the Treasury’s financing dilemma. Both are conceived as short-term workarounds.
One is the minting of a $1 trillion platinum coin by the Treasury, which would deposit the coin at the Federal Reserve. The Fed would then sell back to the public (banks) existing Treasury bonds out of its massive holdings (> $8 trillion). The Treasury could then use the proceeds to pay the government’s bills. Thus, the Fed would do what the Treasury is prohibited from doing under the debt ceiling: selling debt.
When the debt ceiling is ultimately lifted, the “coin” process would be reversed (and the coin melted) without any impact on the money supply. As described, this is wholly different from earlier proposals to mint coins that would feed growth in the stock of money. Those were the brainchildren of so-called Modern Monetary Theorists and a few left-wing members of Congress.
There hasn’t been much discussion of “the coin” in recent months. In any case, the Fed would not be obligated to cooperate with the Treasury on this kind of workaround. The Fed has urged fiscal discipline, and it could simply refuse to take the coin if it felt that debt limit negotiations should be settled between Congress and the President.
Premium Bonds
The other workaround I discussed earlier is the sale by the Treasury of premium bonds or even perpetuities. This involves a little definitional trickery, as the debt limit is expressed in terms of the par value of debt. An example of premium bonds is given at the link above. High interest, low par bonds could be issued by the Treasury with the proceeds used to pay off older discounted bonds and pay the government’s bills. Perpetuities are an extreme case of premium bonds because they have zero par value and would not count against the debt limit at all. They simply pay interest forever with no return of principle. Paradoxically, perpetuities might also be less controversial because they would not involve payments to retire older debt.
Constitutional Challenge
The Biden Administration has pondered another way out of the jam, one that is perhaps more radical than either premium bonds or minting a big coin: challenge the debt ceiling on constitutional grounds. The idea is based on a clause in the Fourteenth Amendment stating that the: “validity of the public debt of the United States… shall not be questioned.” That’s an extremely vague provision. Presumably, as an amendment to the Constitution, this “rule” applies to the federal government itself, not to anyone dumping Treasury debt because its value is at risk. Any fair interpretation would dictate that the government should do nothing to undermine the value of outstanding public debt.
Let’s put aside the significant degree to which the real value of the public debt has been eroded historically by inflationary fiscal and monetary policy. That leaves us with the following questions:
Does a legislated debt limit (in and of itself) undermine the value of the public debt? Why would restraining the growth of debt or setting a limit on its quantity do such a thing?
Would a refusal to legislate an increase in the debt limit undermine or “question” the debt’s value? No, because belt-tightening is always a valid alternative to default. The Fourteenth Amendment is not a rationale for fiscal over-extension.
If we frame this as a question of default vs. fiscal restraint, only the former undermines the value of the debt.
From here, it looks like the blame for bringing the value of the public debt into question is squarely on the spendthrifts. Profligacy undermines the value of one’s commitments, so one can hardly blame those wishing to use the debt ceiling to promote fiscal responsibility. Any challenge to the debt ceiling based on the Fourteenth Amendment is likely to be guffawed out of court.
The Market’s Likely Rebuke
The market will probably react harshly if the debt ceiling impasse continues. That would bring higher yields on outstanding Treasury debt and a sharp worsening of the liquidity crisis for banks holding devalued Treasury debt. Naturally, Biden will attempt to blame the GOP for any bad outcome. His Treasury could attempt to buy more time by announcing the minting of a large coin or the sale of premium bonds, including perpetuities. Ultimately, neither of those moves would do much to stem the damage. The real problem is fiscal incontinence.
In advanced civilizations the period loosely called Alexandrian is usually associated with flexible morals, perfunctory religion, populist standards and cosmopolitan tastes, feminism, exotic cults, and the rapid turnover of high and low fads---in short, a falling away (which is all that decadence means) from the strictness of traditional rules, embodied in character and inforced from within. -- Jacques Barzun