• About

Sacred Cow Chips

Sacred Cow Chips

Tag Archives: Influenza

The Great Unmasking: Take Back Your Stolen Face!

28 Friday Jan 2022

Posted by pnoetx in Masks, Pandemic

≈ Leave a comment

Tags

Aerosols, Anthony Fauci, City Journal, Cloth Masks, Cochrane Library, Dr. Robert Lending, Filtration Efficiency, Influenza, Jeffrey H. Anderson, Joe Biden, KN95, Mask Efficacy, Mask Fit, Mask Leaks, Mask Mandates, N95, Omicron Variant, OSHA, P95, Physics of Fluids, R95, Randomized Control Trial, RCT, Surgical Masks, Teachers Unions, Viral Transmission

Right at the start of the pandemic, Dr. Anthony Fauci insisted that masks were unnecessary, which was in line with the preponderance of earlier evidence. Later, he sowed confusion — and distrust — by claiming he said that to discourage a run on masks, thus preserving supplies for the medical community. That mix-up put a stain on his credibility among those who were paying attention, and the reversal was simply bad policy given what is well established by the evidence on mask efficacy.

No Mas, No Mask!

Despite my own doubts about the efficacy of masks, I went along with masking for a while. It gave me a chuckle to see people wearing them outside, especially runners, or solo drivers. We knew by then that contracting Covid outside was highly unlikely. I was also amused by the idiotic protocols in place at many restaurants, where it was just fine to remove them once you walked a few feet to sit at your table, as if aerosols indoors were bound within narrow bands of altitude. Finally, I had reservations about the health consequences of frequent masking, which have certainly been borne out. Restricting air flow is generally not good for human health! Neither is trapping bits of sputum and hot, exhaled moisture rich in microbes right up against one’s muzzle. Still, I thought it polite to wear a mask in places of business, and I did so for a number of months.

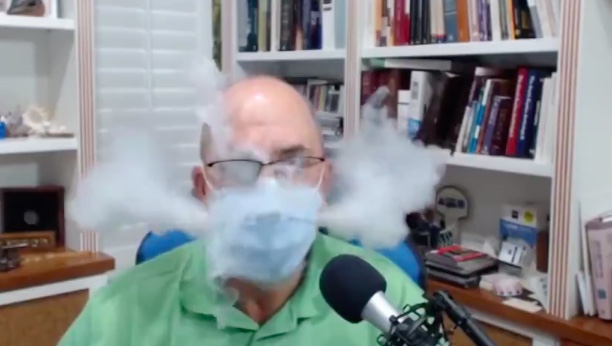
In time it became apparent that the cloth and paper masks we were all wearing were a waste of effort. Covid is spread via fine aerosols and generally not droplets. That’s important because the masks in common use cannot block a sufficient level of Covid particles from escaping nor from penetrating through gaps and through the fiber itself. Neither can N95s if not fitted properly, as so many are not. And none of these masks can protect your eyeballs! When tens of thousands of tiny beads of aerosol are released with each cough or exhalation, a mask that stops 70% of them will not accomplish much.

The evidence began to accumulate that mask mandates were completely ineffective at “stopping the spread” of Covid. I then became an ardent anti-masker. I generally don’t wear them anywhere except medical buildings, and then only because I refuse to defer normal medical care, the consequences of which have been tragic during the pandemic. I have told clerks “I don’t need a mask”, which is true, and they have backed off. I have turned on my heal at stores that refuse to give on the issue, but like masks themselves, the signs on the doors are usually more for show than anything else. So I walk right past them.

Now, the Biden Administration has decided to provide to the public 400 million N95 masks — on the taxpayer! It’s a waste of time and money. But the timing is incredible, just as the Omicron wave crashes on it’s own. It will be one more worthless act of theatre. But don’t doubt for a moment that Joe Biden, when no one remembers the timing, will claim that this action helped defeat Omicron.

Mask Varieties

What is the real efficacy of masks in stopping the spread of Covid aerosol emissions? Cloth masks, including bandanas and scarves, are still the most popular masks. Based on casual observation, I suspect most of those masks aren’t washed as frequently as they should be. People hang them from their rear view mirrors for God knows how long. Beyond that, cloth masks tend to fit loosely and protect from aerosols about as well as the disposable medical or surgical masks that are now so common. Which is to say they don’t provide much protection at all.

But can that be? Don’t surgeons think they help? Well yes, because operating rooms can be very splattery places. Besides, it’s rude to sneeze into your patient’s chest cavity. Protection against fine aerosols? Not so much. “Oh, but should I double mask?”, you might ask? Gross! Just Shut*Up!

Face shields are “transparently” useless, offering no barrier against floating aerosols whatsoever except a fleeting moment’s protection against those blown directly into the wearer’s face. Then there are respirator masks: N95 and KN95, which are essentially the same thing. The difference is that KN95s must meet Chinese performance standards rather than U.S. standards. Both must filter and capture 95% of airborne particles as small as 0.3 microns. Covid particles are smaller than that, but the aerosol “beadlets” in which they are swathed may be larger, so the respirators would appear to be a big step up from cloth or surgical masks. R95 and P95 masks are made for protection against oil-based particles. They seem to be better overall due to thicker material and tighter fit with an overhead strap and extra padding.

Measuring Mask Efficacy

A thorough assessment of these mask types is documented in a 2021 paper published in The Physics of Fluids. Here are the baseline filtration efficiencies measured by the authors with an ideal mask fit relative to exhalation of 1 micron aerosols:

  • Cloth_______40%
  • Surgical____47%
  • KN95_______95%
  • R95_________96%

These are simply the filtration efficiencies of the respective barrier materials used in each type of mask, as measured by the researcher’s tests. Obviously, cloth and surgical masks don’t do too well. Unfortunately, even the N95 and KN95 masks never fit perfectly:

“It is important to note that, while masks … decrease the forward momentum of the respiratory jet, a significant fraction of aerosol escapes the masks, particularly at the bridge of the nose.”

Next, the authors assess the “apparent” filtration efficiencies of masks measured by relative aerosol concentrations in an enclosed space, measured two meters away from the source, after an extended period. This is a tough test for a mask, but it amounts to what people hope masks can accomplish: trapping aerosols containing bits of crap on material surrounding the nose and mouth, and for many hours. Here are the results:

  • Cloth___________9.8%
  • Surgical_______12.4%
  • KN95__________46.3%
  • R95____________60.2%
  • KN95-Gap______3.4%
  • KN95-Valve____20.3%

Cloth and surgical masks don’t do much to reduce the aerosol concentrations. Both the KN95 and R95 masks capture a meaningful share of the aerosols, but the R95 is a bit more effective. Remember, however, that the uncaptured share is a stand-in for the many thousands of virus particles that would remain suspended within the indoor space, so the filtration efficiency of the R95, while far superior to cloth or surgical masks, would do little to mitigate the spread of the virus. The KN95-Gap case is a test of a more “loosely fitted” mask with 3 mm gaps, which the authors say is realistic. Under those circumstances, the KN95 is about as good as nothing. Finally, the authors tested a well-fitted KN95 equipped with a one-way discharge valve. While its efficiency was better than cloth or surgical masks, it still performed poorly. The authors also found that various degrees of air filtration were far more effective in reducing aerosol concentrations than masks.

On the subject of mask fit, I quote Dr. Robert Lending, who has regularly chronicled pandemic developments for patients in his practice since the start of the pandemic:

“N95 type masks cannot be worn by men with beards. They must be so tightly fitted that they leave deep creases in your face. Prior to Covid-19, when hospital employees had to wear them for TB exposure prevention, they were told not to wear them for more than 3 hours at a time. They had to be fit-tested and gas leak-tested. … The N95 knockoffs such as the KN95s are not as good. N95 with valves do not protect others from you. There are now many counterfeit N95s for sale. … Obviously, N95s were never meant to be worn for 8-12 hours; and certainly not by youth and school children. If you are wearing an N95 and you can smell anything, such as aroma in a restaurant when you walk in, perfume, cologne, coffee, citrus, foul odors, etc.; then your fit is not correct and that N95 is worthless.”

Other Evidence

Another kind of evidence on mask efficacy is offered by randomized control trials (RCTs) in mitigating transmission of the influenza virus across a variety of settings, including hospital wards, schools, and neighborhoods of varying characteristics. A meta-analysis of 44 such RCTs published in the Cochran Library in late 2020 found that surgical masks make little or no difference to the spread of the virus. In a small set of RCTs from health care settings, the authors found that N95 and P95 masks perform about as well as surgical masks in limiting transmission.

An excellent review of research on mask efficacy appeared in City Journal last August. The author, Jeffrey H. Anderson, was fairly awestruck at the uniformity of RCT evidence that masks are ineffective. One well-publicized RCT purporting to show the opposite relied on effects that were negligible. Meanwhile, other research has shown that state-level mask mandates are ineffective at reducing the spread of the virus. Finally, here is a nice “cheat sheet” containing links to a number of mask studies.

Children

Children in many parts of the country are forced to wear masks at school. It’s well-established, however, despite wailing from teachers’ unions, that Covid poses extremely low risks to children. And there is no shortage of evidence that constant masking has extremely negative effects on children. The stupidity has reached grotesque proportions. Now, some school districts are proposing that children wear N95 masks! This is unnecessary and cruel, and it is ineffective precisely because children will be even less likely to use them properly than adults, who are generally not very good at it. From the last link:

“If N95s filter so well, why are respirators an ineffective intervention? Because masking is a behavioral intervention as much as a physical one. For respirators to work, they must be well fitting, must be tested by OSHA, and must be used for only short time windows as their effectiveness diminishes as they get wet from breathing.

“Fit requirements and comfort issues are untenable in children who have small faces and are required to wear masks for six or more hours each day. For these reasons, NIOSH specifically states that children should not use respirators, and there are no respirators that are approved for children. These views are shared by the California Department of public health. Concerns about impaired breathing and improper use outweigh potential benefits. There are no studies on the effectiveness of respirators on children because they are not approved for pediatric use.”

Rip It Off

At this point in the Omicron wave, which appears to have crested, we’re basically dealing with a virus that is less lethal than the flu and, for most people, comparable to the common cold. It’s a good time for the timid to shed their masks, which don’t help contain the spread of the virus to begin with. And masks do more harm than has generally been acknowledged, especially to children. So stop the bullshit. Take off your mask, and leave it off!

Mask Truths and Signals

26 Tuesday Oct 2021

Posted by pnoetx in Coronavirus, Public Health

≈ 6 Comments

Tags

Aerosols, Anne Wheeler, Cloth Masks, Comorbitities, Coronavirus, Covid-19, Delta Variant, Emotional Interference, Endemicity, Germaphobia, Influenza, Mask Mandates, Masks, Michael Levitt, OCD Therapy, Outdoor Infectiions, Precautionary Principle, Randomized Control Trials, Seasonality, Viral Interference, Viral Transmission

It’s been clear since the beginning of the pandemic that your chance of getting infected with COVID outside is close to zero. (Also see here). Yet I still see a few masked people on the beach, in the park, on balconies, and walking in the neighborhood. Given the negligible risk of contracting COVID outdoors, the marginal benefit of masking outdoors is infinitesimal. Likewise, the benefit of a mask to the sole occupant of a vehicle is about zilch. Okay, some individuals might forget to remove their masks after leaving a “high-risk” environment. Sure, maybe, but cloth masks really don’t stop the dispersion of fine aerosols anywhere, indoors or outdoors. Of course, the immune-compromised have a reasonable excuse to apply the precautionary principle, but generally not outside with good air quality.

The following link provides a list of mask studies, and meta-studies. Several describe randomized control trials (RCTs). They vary in context, but all of them reject the hypothesis that masks are protective. Positive evidence on mask efficacy is lacking in health care settings, in community settings, and in school settings, and the evidence shows that masks create “pronounced difficulties” for young children and “emotional interference” for school children of all ages. Here’s another article containing links to more studies demonstrating the inefficacy of masks. Also see here. And this article is not only an excellent summary of the research, but it also highlights the hypocrisy of the “follow the science” public health establishment with respect to RCTs. Compliance is not even at issue in many of these studies, though if you think masks matter, it is always an issue in practice. Even studies claiming that cloth masks of the type normally worn by the public are “effective” usually concede that a large percentage of fine aerosols get through the masks… containing millions of tiny particles. In indoor environments with poor ventilation, those aerosols remain suspended in the air for periods long enough to be inhaled by others. That, in fact, is why masks are ineffective at preventing transmission.

Another dubious claim is that masks are responsible for virtually eliminating cases of influenza in 2020 and 2021. Again, to be charitable, masks are of very limited effectiveness in stopping viral transmission. Moreover, compliance has been weak at best, and areas without mask mandates have experienced the same plunge in flu cases as areas with mandates. A far more compelling explanation is that viral interference caused the steep reduction in flu incidence. The chance of being infected with more than one virus at a time is almost nil. Simply put, COVID outcompeted the flu.

Again, I grant that there are studies (though only a single randomized control trial out of India of which I’m aware) that have demonstrated significant protective effects. Even then, however, the mixed nature of this body of research does not support intrusive masking requirements.

Nevertheless, masks are still mandated in some jurisdictions. Those mandates usually don’t apply outdoors, however, and not in your own damn car! Mask mandates contribute to the general climate of fear surrounding COVID, which is wholly unjustified for most children and healthy working-age people. Public health messaging should focus on high-risk individuals: the elderly, the obese, and those having so-called comorbidities and compromised immune systems. Those groups have obvious reasons to be concerned about the virus. They have excuses to be germaphobic! Still, they are at little risk outdoors, the value of masks is doubtful, and breathing deep of fresh air is good for you in any case!

The incidence of COVID has declined substantially in many areas since early September, but the virus is now almost certainly endemic and is likely to return in seasonal waves. However, the Delta wave was far less deadly than earlier variants, a favorable trend many believe will continue. These charts from the UK posted by Michael Levitt demonstrate the improvement vividly. Perhaps the mask craze will fade away as the evidence accumulates.

The pandemic has been a moment of redemption for germaphobes, but no reasonable assessment of risk mitigation relative to the cost, inconvenience, discomfort, and psychological debasement of face jackets can prove their worth outdoors. Their value indoors is nearly as questionable. Yet there remains a stubborn reluctance by public health authorities to lift mask mandates. There are far too many individuals masking outdoors, and to be nice, perhaps it’s mere ignorance. But there are still a few would-be tyrants on Twitter presuming to shame others into joining this pathetic bit of theatre. I believe Anne Wheeler nailed it with this recent tweet:

“This is one of the first things you learn in OCD therapy – you don’t get to make people participate in your compulsions in order to lesson your own anxiety. It’s bizarre that it’s been turned into a virtue.”

There’s also no question that masks are still in vogue as a virtue signal in some circles, but a mask outdoors, especially, is increasingly viewed as a stupid-signal, and for good reason. I’ll continue to marvel at the irrationality of these masked alarmists, who just don’t understand how foolish they look. Give yourself permission to get some fresh air!

CDC Flubs COVID Impact on Life Expectancy

03 Wednesday Mar 2021

Posted by pnoetx in Coronavirus, Public Health

≈ Leave a comment

Tags

Acquired Immunity, Cause of Desth, CDC, Covid-19, Death Certificates, Deferred Care, Excess Deaths, Influenza, Kyle Smith, Life Expectancy, Mortality Rates, Overdoses, Peter B.Bach, STAT News, Suicide, Vaccinations, Zero Hedge

The CDC choked on a new analysis estimating COVID-19’s impact on U.S. life expectancy as of year-end 2020: they reported a decline of a full year, which is ridiculous on its face! As explained by Peter B. Bach in STAT News, the agency assumed that excess deaths attributed to COVID in 2020 would continue as a permanent addition to deaths going forward. Please forgive my skepticism, but isn’t this too basic to qualify as an analytical error by an agency that subjects its reports to thorough vetting? Or might this have been a deliberate manipulation intended to convince the public that COVID will be an ongoing public health crisis. Of course the media has picked it up; even Zero Hedge reported it uncritically!

Bach does a quick calculation based on 400,000 excess deaths attributed to COVID in 2020 and 12 life-years lost by the average victim. I believe the first assumption is on the high side, and I say “attributed to COVID” as a reminder that the CDC’s guidance for completing death certificates was altered in the spring of 2020 specifically for COVID and not other causes of death. Furthermore, if our objective is to assess the impact of the virus itself, under no circumstances should excess deaths induced by misguided lockdown policies enter the calculation (though Bach entertains the possibility). Bach arrives at a reduction in average life of 5.3 days! Of course, that’s not intended to be a projection, but it is a reasonable estimate of COVID’s impact on average lives in 2020.

The CDC’s projection essentially freezes death rates at each age at their 2020 values. We will certainly see more COVID deaths in 2021, and the virus is likely to become endemic. Even with higher levels of acquired immunity and widespread vaccinations, there will almost certainly be some ongoing deaths attributable to COVID, but they are likely to be at levels that will blend into a resumption of the long decline in mortality rates, especially if COVID continues to displace the flu in its “ecological niche”. I include the chart at the top to emphasize the long-term improvement in mortality (though the chart shows only a partial year for 2020, and there has been some flattening or slight backsliding over the past five years or so). As Bach says:

“Researchers have regularly demonstrated that life expectancy projections are overly sensitive to evanescent events like pandemics and wars, resulting in considerably overestimated declines. … And yet the CDC published a result that, if anything, would convey to the public an exaggerated toll that Covid-19 took on longevity in 2020. That’s a problem.”

There were excess deaths from other causes in 2020, which Bach acknowledges. Perhaps 100,000 or more could be attributed to lockdowns and their consequences like economically-induced stress, depression, suicide, overdoses, and medical care deferred or never sought. The Zero Hedge article mentioned above discusses findings that lockdowns and their consequences, such as unemployment spells and lost education, will have ongoing negative effects on health and mortality for many years. The net effect on life expectancy might be as large as 11 to 12 days. Again, however, I draw a distinction between deaths caused by the disease and deaths caused by policy mistakes.

The CDC’s estimate should not be taken seriously when, as Kyle Smith says, there is every indication that the battle against COVID is coming to a successful conclusion. Public health experts have not acquitted themselves well during the pandemic, and the CDC’s life expectancy number only reinforces that impression. Here is Smith:

“We have learned a lot about how the virus works, and how it doesn’t: Outdoor transmission, for the most part, hardly ever happens. Kids are at very low risk, especially younger children. Baseball games, barbecues, and summer camps should be fine. Some pre-COVID activities now carry a different risk profile — notably anything that packs crowds together indoors, so Broadway theater, rock concerts, and the like will be just about the last category of activity to return to normal.”

But return to normal we should, and yet the CDC seems determined to poop on the victory party!

COVID and Hospital Capacity

15 Sunday Nov 2020

Posted by pnoetx in Health Care, Pandemic

≈ 1 Comment

Tags

Bed Capacity, Capacity Management, CDC, Covid-19, HealthData.gov, Herd Immunity, Hospital Utilization, ICU Capacity, ICU Utilization, Influenza, Justin Hart, Lockdown Illnesses, Missouri, PCR Tests, Prevalence, Seasonality, St. Louis MO, Staffed Beds, Staffed Utilization, Statista

The fall wave of the coronavirus has brought with it an increase in COVID hospitalizations. It’s a serious situation for the infected and for those who care for them. But while hospital utilization is rising and is reaching tight conditions in some areas, claims that it is already a widespread national problem are without merit.

National and State Hospital Utilization

The table below shows national and state statistics comparing beds used during November 1-9 to the three-year average from 2017 – 19, from Justin Hart. There are some real flaws in the comparison: one is that full-year averages are not readily comparable to particular times of the year, with or without COVID. Nevertheless, the comparison does serve to show that current overall bed usage is not “crazy high” in most states, as it were. The increase in utilization shown in the table is highest in IA, MT, NV, PA, VT, and WI, and there are a few other states with sizable increases.

Another limitation is that the utilization rates in the far right column do not appear to be calculated on the basis of “staffed” beds, but total beds. The U.S. bed utilization rate would be 74% in terms of staffed beds.

Average historical hospital occupancy rates from Statista look like this:

Again, these don’t seem to be calculated on the basis of staffed beds, but current occupancies are probably higher now based on either staffed beds or total beds.

As of November 11th, a table available at HealthData.gov indicates that staffed bed utilization in the U.S. is at nearly 74%, with ICU utilization also at 74%. As the table above shows, states vary tremendously in their hospital bed utilization, a point to which I’ll return below.

COVID patients were using just over 9% of of all staffed beds and just over 19% of ICU beds as of November 11th. One caveat on the reported COVID shares you’ll see for dates going forward: the CDC changed its guidelines on counting COVID hospitalizations as of November 12th. It is now a COVID patient’s entire hospital stay, rather than only when a patient is in isolation with COVID. That might be a better metric if we can trust the accuracy of COVID tests (and I don’t), but either way, the change will cause a jump in the COVID share of occupied beds.

Interpreting Hospital Utilization

Many issues impinge on the interpretation of hospital utilization rates:

First, cases and utilization rates are increasing, which is worrisome, but the question is whether they have already reached crisis levels or will very soon. The data doesn’t suggest that is the case in the aggregate, but there certainly there are hospitals bumping up against capacity constraints in some parts of the country.

Second, occupancies are increasing due to COVID patients as well as patients suffering from lockdown-related problems such as self-harm, psychiatric problems, drug abuse, and conditions worsened by earlier deferrals of care. We can expect more of that in coming weeks.

Third, lockdowns create other hospital capacity issues related to staffing. Health care workers with school-aged children face the daunting task of caring for their kids and maintaining hours on jobs for which they are critically needed.

Fourth, there are capacity issues related to PPE and medical equipment that are not addressed by the statistics above. Different uses must compete for these resources within any hospital, so the share of COVID admissions has a strong bearing on how the care of other kinds of patients must be managed.

Fifth, some of the alarm is purely case-driven: all admissions are tested for COVID, and non-COVID admissions often become COVID admissions after false-positive PCR tests, or simply due to the presence of mild COVID with a more serious condition or injury. However, severe COVID cases have an outsized impact on utilization of staff because their care is relatively labor-intensive.

Sixth, there are reports that the average length of COVID patient stays has decreased markedly since the spring (it is hard to find nationwide figures), but it is also increasingly difficult to find facilities for post-acute care required for some patients on discharge. Nevertheless, if improved treatment reduces average length of stay, it helps hospitals deal with the surge.

Finally, thus far, the influenza season has been remarkably light, as the following chart from the CDC shows. It is still early in the season, but the near-complete absence of flu patients is helping hospitals manage their resources.

St. Louis Hotspot

The St. Louis metro area has been proclaimed a COVID “hotspot” by the local media and government officials, which certainly doesn’t make St. Louis unique in terms of conditions or alarmism. I’m curious about the data there, however, since it’s my hometown. Here is hospital occupancy on the Missouri side of the St. Louis region:

It seems this chart is based on total beds, not staffed beds, However, one of the interesting aspects of this chart is the variation in capacity over time, with several significant jumps in the series. This has to do with data coverage and some variation in daily reporting. Almost all of these data dashboards are relatively new, so their coverage has been increasing, but generally in fits and starts. Reporting is spotty on a day-to-day basis, so there are jagged patterns. And of course, capacity can vary from day-to-day and week-to-week — there is some flexibility in the number of beds that can be made available.

The share of St. Louis area beds in use was 61% as of November 11th (preliminary). COVID patients accounted for 12% of hospital beds. ICU utilization in the St. Louis region was a preliminary 67% as of Nov. 11, with COVID patients using 29% of ICU capacity (which is quite high). Again, these figures probably aren’t calculated on the basis of “staffed” beds, so actual hospital-bed and ICU-bed utilization rates could be several percentage points higher. More importantly, it does not appear that utilization in the St. Louis area has trended up over the past month.

At the moment, the St. Louis region appears to have more spare hospital capacity than the nation, but COVID patients are using a larger share of all beds and ICU beds in St. Louis than nationwide. So this is a mixed bag. And again, capacity is not spread evenly across hospitals, and it’s clear that hospitals are under pressure to manage capacity more actively. In fact, hospitals only have so many options as the share of COVID admissions increases: divert or discharge COVID and non-COVID patients, defer elective procedures, discharge COVID and non-COVID patients earlier, allow beds to be more thinly staffed and/or add temporary beds wherever possible.

Closing Thoughts

Anyone with severe symptoms of COVID-19 probably should be hospitalized. The beds must be available, or else at-home care will become more commonplace, as it was for non-COVID maladies earlier in the pandemic. A continued escalation in severe COVID cases would require more drastic steps to make hospital resources available. That said, we do not yet have a widespread capacity crisis, although that’s small consolation to areas now under stress. And a few of the states with the highest utilization rates now have been rather stable in terms of hospitalizations — they already had high average utilization rates, which is potentially dangerous.

COVID is a seasonal disease, and it’s no surprise that it’s raging now in areas that did not experience large outbreaks in the spring and summer. And those areas that had earlier outbreaks have not had a serious surge this fall, at least not yet. My expectation and hope is that the midwestern and northern states now seeing high case counts will soon reach a level of prevalence at which new infections will begin to subside. And we’re likely to see a far lower infection fatality rate than experienced in the Northeast last spring.

COVID Trends and Flu Cases

05 Thursday Nov 2020

Posted by pnoetx in Pandemic

≈ 1 Comment

Tags

Casedemic, Coronavirus, Covid Tracking Project, Covid-19, Flu Season, Herd Immunity, Infection Fatality Rate, Influenza, Johns Hopkins University, Justin Hart, Lockdowns, Provisional Deaths, Rational Ground

Writing about COVID as a respite from election madness is very cold comfort, but here goes….

COVID deaths in the U.S. still haven’t shown the kind of upward trend this fall that many had feared. It could happen, but it hasn’t yet. In the chart above, new cases are shown in brown (along with the rolling seven-day average), while deaths (on the right axis) are shown in blue. It’s been over six weeks since new case counts began to rise, but deaths have risen for about two weeks, and it’s been gradual relative to the first two waves. Either the average lag between diagnosis and death is much longer than earlier in the year, or the current “casedemic” is much less deadly, or perhaps both. It could change. And granted, this is national data; states in the midwest have had the strongest trends in cases, especially the upper midwest, as well as stronger trends in hospitalizations and deaths. Most of those areas had milder experiences with the virus in the spring and summer.

Lagged Reporting

What’s tricky about this is that both case reports and death reports in the chart above are significantly lagged. A COVID test might not take place until several days after infection (if at all), and sometimes not until hospitalization or death. Then the test result might not be known for several days. However, the greater availability of tests and faster turnaround time have almost certainly shortened that lag.

Deaths are reported with an even a greater delay, though you wouldn’t know it from listening to the media or some of the organizations that track these statistics, such as Johns Hopkins University and the COVID Tracking Project. Thus far, they only tell you what’s reported on a given day. This article from Rational Ground does a good job of explaining the issue and the distortion it causes in discerning trends.

Deaths by actual date-of-death

I’ve reported on the issue of lagged COVID deaths myself. The following graph from Justin Hart is a clear presentation of the reporting delays.

Reported deaths for the most recent week (10/24) are shown in dark blue, and those deaths were spread over a number of prior weeks. Actual deaths in a given week are represented by a “stack” of deaths reported later, in subsequent weeks. One word of caution: actual deaths in the most recent weeks are “provisional”, and more will be added in subsequent reporting weeks. Hence the steep drop off for the 10/17 and 10/24 reporting weeks.

Going back three or four weeks, it’s clear that actual deaths continued to decline into October. Unfortunately, that doesn’t tell us much about the recent trend or whether actual deaths have started to rise given the increase in new cases. I have seen a new weekly update with the deaths by actual date of death, but it is not “stacked” by reporting week. However, it does show a slight increase in the week of 10/10, the first weekly increase since the end of June. So perhaps we’ll see an uptick more in-line with the earlier lags between diagnosis and death, but that’s far from certain.

Another important point is that the number of deaths each week, and each day, are not as high as reported by the media and the popular tracking sites. How often have you heard “more than 1,000 people a day are dying”. That’s high even for weekly averages of reported deaths. As of three weeks ago, actual daily deaths were running at about 560. That’s still very high, but based on seroprevalence estimates (the actual number of infections from the presence of antibodies), the infection fatality keeps dropping toward levels that are comparable to the flu at ages less than 65.

Where is the flu?

Speaking of the flu, this chart from the World Health Organization is revealing: the flu appears to have virtually disappeared in 2020:

It’s still very early in the northern flu season, but the case count was very light this summer in the Southern Hemisphere. There are several possible explanations. One favored by the “lockdown crowd” is that mitigation efforts, including masks and social distancing, have curtailed the flu bug. Not just curtailed … quashed! If that’s true, it’s more than a little odd because the same measures have been so unsuccessful in curtailing COVID, which is transmitted the same way! Also, these measures vary widely around the globe, which weakens the explanation.

There are other, more likely explanations: perhaps the flu is being undercounted because COVID is being overcounted. False positive COVID tests might override the reporting of a few flu cases, but not all diagnoses are made via testing. Other respiratory diseases can be mistaken for the flu and vice versus, and they are now more likely to be diagnosed as COVID absent a test — and as the joke goes, the flu is now illegal! And another partial explanation: it is rare to be infected with two viruses at once. Thus, COVID is said to be “crowding out” the flu.

Waiting for data

There is other good news about transmission, treatment, and immunity, but I’ll devote another post to that, and I’ll wait for more data. For now, the “third wave” appears to be geographically distinct from the first two, as was the second wave from the first. This suggests a sort of herd immunity in areas that were hit more severely in earlier waves. But the best news is that COVID deaths, thus far this fall, are not showing much if any upward movement, and estimates of infection fatality rates continue to fall.

Not News: Infections and Long-Term Complications

06 Sunday Sep 2020

Posted by pnoetx in Coronavirus, Health Care

≈ Leave a comment

Tags

Antibodies, Autoimmune Disease, Bacterial Infection, Celiac Disease, Chronic Fatigue Syndrome, Endocrinology, Fibromyalgia, Graves', Graves’ Disease, Guillain-Barré Syndrome, Influenza, Islet Cells, Multiple Sclerosis, Myocarditis, Rheumatoid Conditions, Sjogren’s Syndrome, Type I Diabetis, Viral Unfection

At 15 years of age I was diagnosed as a Type I diabetic — 49 years ago. I had a genetic predisposition, but I’ve been told by several endocrinologists over the years that an “event” likely triggered the antibody response for which I was predisposed. The event was, in all probability, a viral or bacterial infection. The autoimmune response to that infection attacked the islet cells in my pancreas and destroyed my body’s ability to produce insulin. I’ve been dependent on external delivery of insulin ever since. Life goes on.

I relate this information to emphasize that it is not “novel” for a virus to trigger long-term “complications”. Recently, certain media factions have been shrieking about the long-term complications that might be triggered by the coronavirus (C19) even in those with otherwise light symptoms. Those are unfortunate, but again, this aspect of viral and bacterial infection is not uncommon.

We know, for example, that bacterial and viral infections often trigger autoimmune diseases like diabetes. Other examples are chronic fatigue syndrome, fibromyalgia, rheumatoid conditions, celiac disease, Graves’ disease, Guillain-Barré syndrome, Sjogren’s Syndrome, multiple sclerosis, and many others.

One condition that’s been cited as an especially dangerous complication of C19 is myocarditis, or inflammation of the heart muscle. This has been invoked as a reason to cancel sports competitions, for example. (See here for a denial of one rather hyperbolic claim regarding this condition.) Myocarditis has a long history as a side effect of influenza. Most people recover with no long-term complications, and others manage to live with it and remain productive. While C19 is “novel”, infection-induced myocarditis is not.

If you catch a virus or a bacterial infection, you might experience other complications with varying severity. Get used to the idea. It’s an unfortunate fact of life.

CDC Sows Covid Case-Fatality Confusion

15 Wednesday Apr 2020

Posted by pnoetx in Data Integrity, Pandemic

≈ Leave a comment

Tags

Case Fatality Rate, Centers for Disease Control, Co-Morbidities, Coronavirus, Covid "Hot Spots", Covid-119, Crisis Management, Data Integrity, Death Toll, Excess Deaths, Government Accounting, Influenza, New York Deaths, Probable Deaths, Respiratory Disease, Testing Guidelines

The Centers for Disease Control has formally decided to inflate statistics on coronavirus deaths by adding so-called “probable” cases to the toll. This news follows the announcement yesterday that New York decided to add, in one day, about 4,000 deaths from over the past month to its now “probable” Covid-19 death toll. So much for clean accounting! We have a confirmed death toll up to April 14th. We have a probable death toll after. The error in timing alone introduced by this abrupt adjustment impairs efforts to track patterns of change. Case fatality rates are rendered meaningless. Data integrity, which was already weak, has been thrown out the window by our public heath authorities.

It’s no longer necessary for a deceased patient to have tested positive for Covid-19:

“A probable case or death is defined as one that meets clinical criteria such as symptoms and evidence of the disease with no lab test confirming Covid-19. It can also be classified as a probable case if there are death or other vital records listing coronavirus as a cause. A third way to classify it is through presumptive laboratory evidence and either clinical criteria or evidence of the disease.”

Consider the following:

  • to date, more than 80% of patients presenting symptoms sufficient to meet testing guidelines have tested negative for Covid-19;
  • the most severe cases of Covid-19 and other respiratory diseases are coincident with significant co-morbidities;
  • “probable” cases appear to be concentrated among the elderly and infirm, whose regular mortality rate is high.

Deaths involving mere symptoms, or mere symptoms and co-morbidities, and even deaths of undetermined cause, are now more likely to be over-counted as Covid-19 deaths. This is certain to distort, and I believe overcount, Covid-19 deaths. Of course, this was already happening in some states, as I mentioned last week in “Coronavirus Controversies“.

One of the charts I’ve presented in my Continue%20reading Coronavirus “Framing” posts tracks Covid-19 deaths. The change in these cause-of-death guidelines will make continued tracking into something of a farce. I’d be tempted to deduct the one-day distortion caused by the New York decision, but then the count will still be distorted going forward by the broader definition of Covid-19 death.

The only possible rationale for these decisions by New York and the CDC is that testing is still subject to severe rationing. I have my doubts, as the number of daily tests has stabilized. On the other hand, I have heard anecdotes about hospitals with large numbers of respiratory patients who have not been tested! And they are intermingling all of these patients?? I’m not sure I can reconcile these reports. Surely the patients meet the guidelines for testing. Perhaps the CDC’s decision is associated with an effort to spread testing capacity by allowing only new patients to be tested, counting those already hospitalized as presumptively Covid-infected. And if they aren’t already, they will be! A decision to count deaths within that group as “probable” Covid deaths  would fit conveniently into that approach, but that would be wildly misguided and perverse.

I’m obviously cynical about the motives here. I don’t trust government accounting when it bears on the credit or blame for crisis management. Who stands to gain from a higher Covid death toll? The CDC? State health authorities? “Hot spots” vying for federal resources?

A consistent approach to attributing cause of death would have been more useful for gauging the direction of the pandemic, but as I’ve said, there will always be uncertainty about the true Covid-19 death toll. Ultimately, the best estimates will have to rely on calculations of “excess deaths” in 2020 compared to a “normal” level from a larger set of causes. In fact, even that comparison will be suspect because the flu season leading up to the Covid outbreak was harsh. Was it really the flu later in the season?

Covid-19: Killing It With Sunshine, Fresh Air

14 Saturday Mar 2020

Posted by pnoetx in Health Care, Pandemic

≈ 2 Comments

Tags

1918-19 Pandemic, Coronavirus, Covid-19, Fresh Air, Influenza, Medium.com, Open Air Factor, Ozone, Richard Hobday, Spanish Flu, UV Light, Vitamin D

Update: also see “Don’t Be Cowed: Shelter, But Get Outside”

Patients with viral and bacterial infections seem to respond better if exposed to sunshine and fresh air. In fact, anyone hoping to keep infections at bay would do well to get outside in the sun for a while every day. A friend’s post alerted me to this fascinating article in Medium.com: “Coronavirus and the Sun: a Lesson from the 1918 Influenza Pandemic“, by Richard Hobday. It is well-sourced, though the references aren’t hyperlinked. Here’s the main point:

“... records from the 1918 pandemic suggest one technique for dealing with influenza — little-known today — was effective. … Put simply, medics found that severely ill flu patients nursed outdoors recovered better than those treated indoors. A combination of fresh air and sunlight seems to have prevented deaths among patients; and infections among medical staff. There is scientific support for this. Research shows that outdoor air is a natural disinfectant. Fresh air can kill the flu virus and other harmful germs. Equally, sunlight is germicidal and there is now evidence it can kill the flu virus.

On the last assertion, see here. Viruses always ebb as the weather warms in the spring. Light conditions improve, which might be more important than temperature: UV light is thought to kill germs of many kinds. Moreover, Vitamin D is generally protective against infections, and a deficiency is thought to increase Covid-19 risk.

Hobday goes on to describe the Open Air Factor, which probably is related to the presence of ozone, but maybe other curatives:

“Doctors who had first-hand experience of open-air therapy at the hospital in Boston were convinced the regimen was effective. It was adopted elsewhere. If one report is correct, it reduced deaths among hospital patients from 40 per cent to about 13 per cent. …

Patients treated outdoors were less likely to be exposed to the infectious germs that are often present in conventional hospital wards. They were breathing clean air in what must have been a largely sterile environment. We know this because, in the 1960s, Ministry of Defence scientists proved that fresh air is a natural disinfectant. Something in it, which they called the Open Air Factor, is far more harmful to airborne bacteria — and the influenza virus — than indoor air. They couldn’t identify exactly what the Open Air Factor is. But they found it was effective both at night and during the daytime. 

I’m not sure they were able to control for the relative absence of germs in fresh air, as opposed to the presence of something beneficial, but it’s certainly intriguing.

So whether you’re still on the “office team” or otherwise on the job, try to get outside! Whether you’re in a Covid-19 self-quarantine or worried about catching it, get outside if you can. Get some sun and fresh air, especially after a thunderstorm, when the air is rich with ozone. But drink plenty of fluids and don’t get burned! I’ll be hanging out in my back yard.

The Federal Reserve and Coronatative Easing

09 Monday Mar 2020

Posted by pnoetx in Monetary Policy, Pandemic

≈ Leave a comment

Tags

Caronavirus, Covid-19, Donald Trump, Externality, Federal Reserve, Fiscal Actions, Flight to Safety, Glenn Reynolds, Influenza, Liquidity, Michael Fumento, Monetary policy, Network Effects, Nonpharmaceutical Intervention, Paid Leave, Pandemic, Payroll Tax, Quarantines, Scott Sumner, Solvency, Wage Assistance

Laughs erupted all around when the Federal Reserve reduced its overnight lending rate by 50 basis points last week: LIKE THAT’LL CURE THE CORANAVIRUS! HAHAHA! It’s easy to see why it seemed funny to people, even those who think the threat posed by Covid-19 is overblown. But it should seem less silly with each passing day. That’s not to say I think we’re headed for disaster. My own views are aligned with this piece by Michael Fumento: it will run its course before too long, and “viruses hate warm weather“. Nevertheless, the virus is already having a variety of economic effects that made the Fed’s action prudent.

Of course, the Fed did not cut its rate to cure the virus. The rate move was intended to deal with some of the economic effects of a pandemic. The spread of the virus has been concentrated in a few countries thus far: China, Iran, Italy, and South Korea. Fairly rapid growth is expected in the number of cases in the U.S. and the rest of the world over the next few weeks, especially now with the long-awaited distribution of test kits. But already in the U.S., we see shortages of supplies hitting certain industries, as shipments from overseas have petered. And now efforts to control the spread of the virus will involve more telecommuting, cancellation of public events, less travel, less dining out, fewer shopping trips, missed work, hospitalizations, and possibly widespread quarantines.

The upshot is at least a temporary slowdown in economic activity and concomitant difficulties for many private businesses. We’ve been in the midst of a “flight to safety”, as investors incorporate these expectations into stock prices and interest rates. Firms in certain industries will need cash to pay bills during a period of moribund demand, and consumers will need cash during possible layoffs. All of this suggests a need for liquidity, but even worse, it raises the specter of a solvency crisis.

The Fed’s power can attempt to fill the shortfall in liquidity, but insolvency is a different story. That, unfortunately, might mean either business failures or bailouts. Large firms and some small ones might have solid business continuation plans to help get them through a crisis, at least one of short to moderate duration, but many businesses are at risk. President Trump is proposing certain fiscal and regulatory actions, such as a reduction in the payroll tax, wage payment assistance, and some form of mandatory paid leave for certain workers. Measures might be crafted so as to target particular industries hit hard by the virus.

I do not object to these pre-emptive measures, even as an ardent proponent of small government, because the virus is an externality abetted by multiplicative network effects, something that government has a legitimate role in addressing. There are probably other economic policy actions worth considering. Some have suggested a review of laws restricting access to retirement funds to supplement inadequate amounts of precautionary savings.

Last week’s Fed’s rate move can be viewed as pre-emptive in the sense that it was intended to assure adequate liquidity to the financial sector and payment system to facilitate adjustment to drastic changes in risk appetites. It might also provide some relief to goods suppliers who find themselves short of cash, but their ability to benefit depends on their relationships to lenders, and lenders will be extremely cautious about extending additional credit as long as conditions appear to be deteriorating.

In an even stronger sense, the Fed’s action last week was purely reactive. Scott Sumner first raised an important point about ten days before the rate cut: if the Fed fails to reduce its overnight lending target, it represents a de facto tightening of U.S. monetary policy, which would be a colossal mistake in a high-risk economic and social environment:

“When there’s a disruption to manufacturing supply chains, that tends to reduce business investment, puts downward pressure on demand for credit. That will tend to reduce equilibrium interest rates. In addition, with the coronavirus, there’s also a lot of uncertainty in the global economy. And when there’s uncertainty, there’s sort of a rush for safe assets, people buy treasury bonds, that puts downward pressure on interest rates. So you have this downward pressure on global interest rates. Now while this is occurring, if the Fed holds constant its policy rate, it targets the, say fed funds rate at a little over 1.5 percent. While the equilibrium rates are falling, then essentially the Fed will be making monetary policy tighter.

… what I’m saying is, if the Fed actually wants to maintain a stable monetary policy, they may have to move their policy interest rate up and down with market conditions to keep the effective stance of monetary policy stable. So again, it’s not trying to solve the supply side problem, it’s trying to prevent it from spilling over and also impacting aggregate demand.”

The Fed must react appropriately to market rates to maintain the tenor of its policy, as it does not have the ability to control market rates. Its powers are limited, but it does have a responsibility to provide liquidity and to avoid instability in conducting monetary policy. Fiscal actions, on the other hand, might prove crucial to restoring economic confidence, but ultimately controlling the spread of the virus must be addressed at local levels and within individual institutions. While I am strongly averse to intrusions on individual liberty and I desperately hope it won’t be necessary, extraordinary measures like whole-city quarantines might ultimately be required. In that context, this post on the effectiveness of “non-pharmaceutical interventions” such as school closures, bans on public gatherings, and quarantines during the flu pandemic of 1918-19 is fascinating.


Follow Sacred Cow Chips on WordPress.com

Recent Posts

  • Rejecting Fossil Fuels at Our Great Peril
  • The Fed’s Balance Sheet: What’s the Big Deal?
  • Collectivism Is Not the “Natural” State
  • Social Insurance, Trust Fund Runoff, and Federal Debt
  • Critical Gender Theory and Trends in Gender Identity

Archives

  • May 2022
  • April 2022
  • March 2022
  • February 2022
  • January 2022
  • December 2021
  • November 2021
  • October 2021
  • September 2021
  • August 2021
  • July 2021
  • June 2021
  • May 2021
  • April 2021
  • March 2021
  • February 2021
  • January 2021
  • December 2020
  • November 2020
  • October 2020
  • September 2020
  • August 2020
  • July 2020
  • June 2020
  • May 2020
  • April 2020
  • March 2020
  • February 2020
  • January 2020
  • December 2019
  • November 2019
  • October 2019
  • September 2019
  • August 2019
  • July 2019
  • June 2019
  • May 2019
  • April 2019
  • March 2019
  • February 2019
  • January 2019
  • December 2018
  • November 2018
  • October 2018
  • September 2018
  • August 2018
  • July 2018
  • June 2018
  • May 2018
  • April 2018
  • March 2018
  • February 2018
  • January 2018
  • December 2017
  • November 2017
  • October 2017
  • September 2017
  • August 2017
  • July 2017
  • June 2017
  • May 2017
  • April 2017
  • March 2017
  • February 2017
  • January 2017
  • December 2016
  • November 2016
  • October 2016
  • September 2016
  • August 2016
  • July 2016
  • June 2016
  • May 2016
  • April 2016
  • March 2016
  • February 2016
  • January 2016
  • December 2015
  • November 2015
  • October 2015
  • September 2015
  • August 2015
  • July 2015
  • June 2015
  • May 2015
  • April 2015
  • March 2015
  • February 2015
  • January 2015
  • December 2014
  • November 2014
  • October 2014
  • September 2014
  • August 2014
  • July 2014
  • June 2014
  • May 2014
  • April 2014
  • March 2014

Blogs I Follow

  • Passive Income Kickstart
  • OnlyFinance.net
  • TLC Cholesterol
  • Nintil
  • kendunning.net
  • DCWhispers.com
  • Hoong-Wai in the UK
  • Marginal REVOLUTION
  • CBS St. Louis
  • Watts Up With That?
  • Aussie Nationalist Blog
  • American Elephants
  • The View from Alexandria
  • The Gymnasium
  • Public Secrets
  • A Force for Good
  • ARLIN REPORT...................walking this path together
  • Notes On Liberty
  • troymo
  • SUNDAY BLOG Stephanie Sievers
  • Miss Lou Acquiring Lore
  • Your Well Wisher Program
  • Objectivism In Depth
  • RobotEnomics
  • Orderstatistic

Blog at WordPress.com.

Passive Income Kickstart

OnlyFinance.net

Financial Matters!

TLC Cholesterol

Nintil

To estimate, compare, distinguish, discuss, and trace to its principal sources everything

kendunning.net

The future is ours to create.

DCWhispers.com

Hoong-Wai in the UK

A Commonwealth immigrant's perspective on the UK's public arena.

Marginal REVOLUTION

Small Steps Toward A Much Better World

CBS St. Louis

News, Sports, Weather, Traffic and St. Louis' Top Spots

Watts Up With That?

The world's most viewed site on global warming and climate change

Aussie Nationalist Blog

Commentary from a Paleoconservative and Nationalist perspective

American Elephants

Defending Life, Liberty and the Pursuit of Happiness

The View from Alexandria

In advanced civilizations the period loosely called Alexandrian is usually associated with flexible morals, perfunctory religion, populist standards and cosmopolitan tastes, feminism, exotic cults, and the rapid turnover of high and low fads---in short, a falling away (which is all that decadence means) from the strictness of traditional rules, embodied in character and inforced from within. -- Jacques Barzun

The Gymnasium

A place for reason, politics, economics, and faith steeped in the classical liberal tradition

Public Secrets

A 93% peaceful blog

A Force for Good

How economics, morality, and markets combine

ARLIN REPORT...................walking this path together

PERSPECTIVE FROM AN AGING SENIOR CITIZEN

Notes On Liberty

Spontaneous thoughts on a humble creed

troymo

SUNDAY BLOG Stephanie Sievers

Escaping the everyday life with photographs from my travels

Miss Lou Acquiring Lore

Gallery of Life...

Your Well Wisher Program

Attempt to solve commonly known problems…

Objectivism In Depth

Exploring Ayn Rand's revolutionary philosophy.

RobotEnomics

(A)n (I)ntelligent Future

Orderstatistic

Economics, chess and anything else on my mind.

  • Follow Following
    • Sacred Cow Chips
    • Join 120 other followers
    • Already have a WordPress.com account? Log in now.
    • Sacred Cow Chips
    • Customize
    • Follow Following
    • Sign up
    • Log in
    • Report this content
    • View site in Reader
    • Manage subscriptions
    • Collapse this bar
 

Loading Comments...